May 13, 2019 – NASA-NOAA Satellite Catches Tropical Cyclone Ann Threatening Queensland
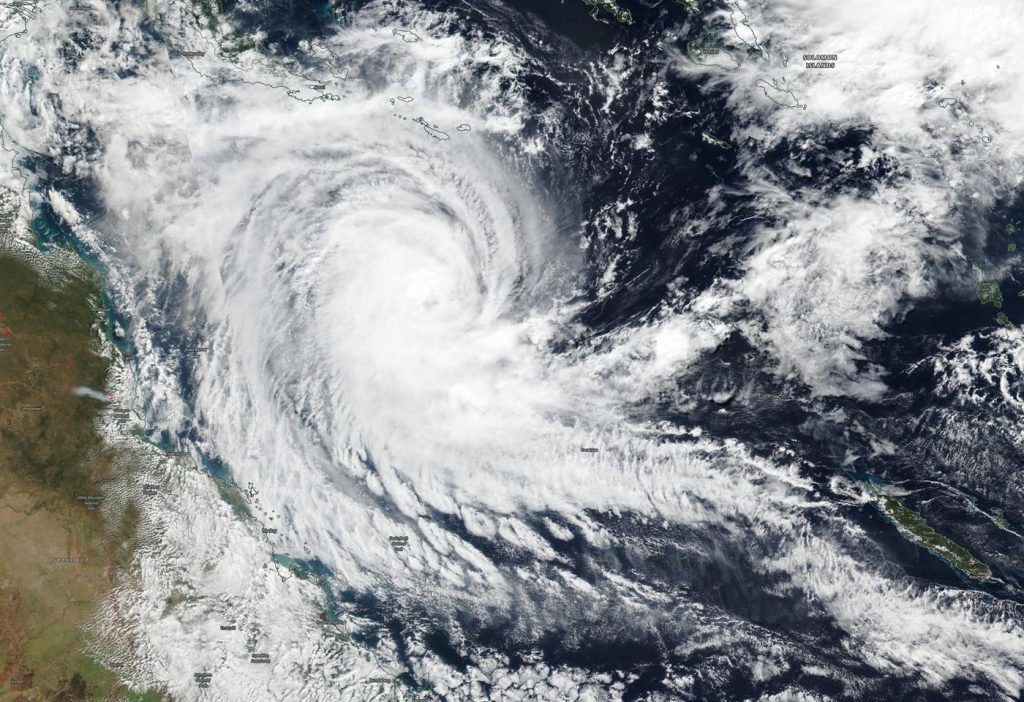
NASA-NOAA’s Suomi NPP satellite passed over the Southern Pacific Ocean and captured a visible image of Tropical Cyclone Ann in the Coral Sea, off the east coast of Queensland, Australia.
NASA-NOAA’s Suomi NPP satellite passed over the Southern Pacific Ocean and captured a visible image of Tropical Cyclone Ann on May 13. Ann was located in the Coral Sea, east of Queensland, Australia. Credit: NASA Worldview, Earth Observing System Data and Information System (EOSDIS).
The Australian Bureau of Meteorology or ABM noted that Watch zone includes Cape York to Port Douglas, including Lockhart River, Coen, and Cooktown.
NASA-NOAA’s Suomi NPP satellite passed over Ann on May 13 and the Visible Infrared Imaging Radiometer Suite (VIIRS) instrument provided a visible image of the storm. The VIIRS image showed powerful thunderstorms wrapping around the center of circulation that appeared to be a cloud-filled eye. The VIIRS image also revealed a large thick band of thunderstorms extending from the center to the southeast, giving the appearance of a large tail.
At 8 a.m. EDT (10 p.m. AEST local time) on Monday, May 13, 2019, ABM noted that Ann is a category 1 storm, sustained winds near the center of 40 knots (46 mph/75 kilometers per hour). Ann is centered near 15.2 degrees South latitude and 151.5 degrees East longitude. That is about 398 miles (640 kilometers) east northeast of Cairns. Ann is moving to the west-northwest at 17 miles (27 kilometers) per hour.
ABM forecasts that Ann will move on a westerly track over the next couple of days and make landfall on the east coast of the Cape York Peninsula, Queensland on the morning of May 15, local time most likely as a category 1 system. Ann is forecast to make landfall near the town of Coen. Coen is located in the Shire of Cook, Queensland.
May 10, 2019 – NASA Northern Quadrant Strength in Tropical Cyclone Lili
NASA’s Aqua satellite used infrared light to analyze the strength of storms in Tropical Cyclone Lili as it moved through the Southern Indian Ocean. Infrared data provides temperature information, and the strongest thunderstorms that reach high into the atmosphere have the coldest cloud top temperatures.
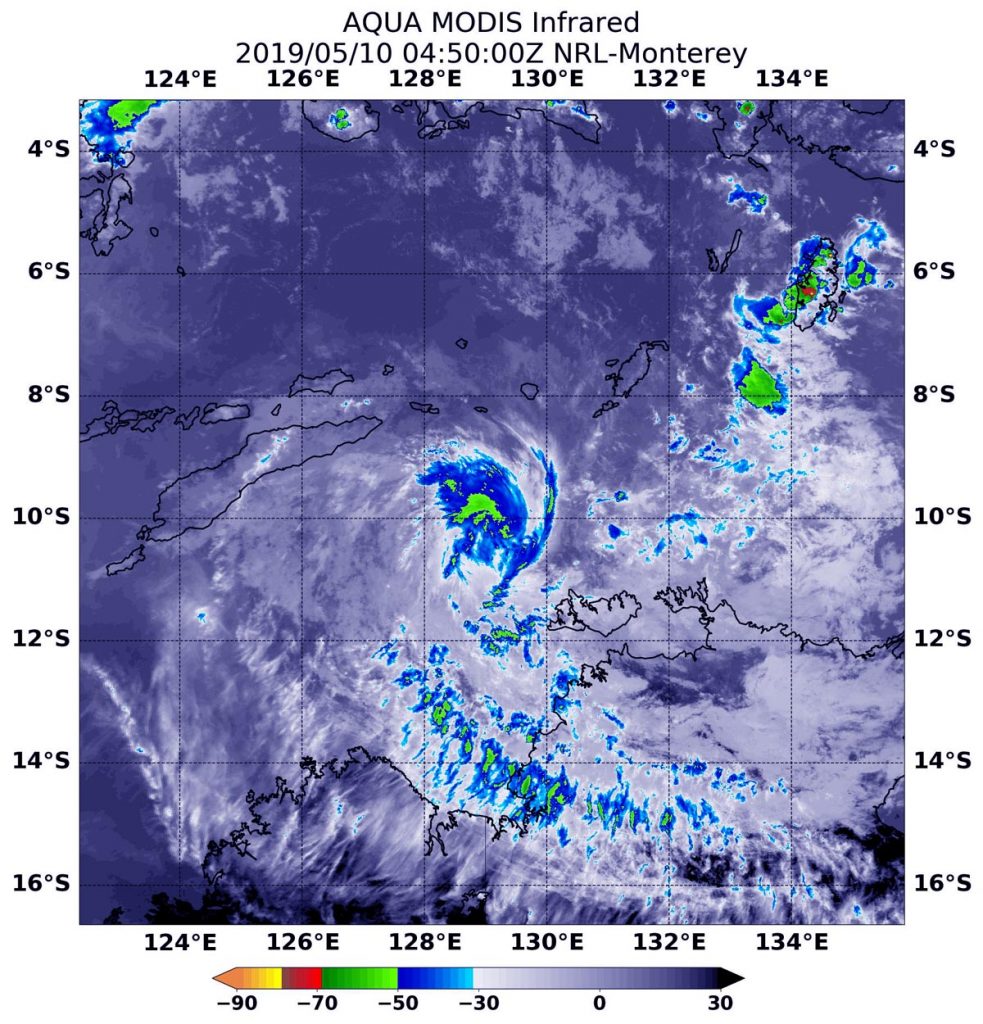
At 12:50 a.m. EDT (0450 UTC) on May 10, the MODIS instrument that flies aboard NASA’s Aqua satellite gathered infrared data on Tropical Cyclone Lili. Strongest thunderstorms north of the center where cloud top temperatures were as cold as minus 50 degrees Fahrenheit (minus 45.5 Celsius). Credit: NASA/NRL
At 12:50 a.m. EDT (0450 UTC) on May 10, the Moderate Imaging Spectroradiometer or MODIS instrument that flies aboard NASA’s Aqua satellite gathered infrared data on Lili. Strongest thunderstorms were north of the center where MODIS found cloud top temperatures as cold as minus 50 degrees Fahrenheit (minus 45.5 Celsius).
At 11 a.m. EDT (1500 UTC), the Joint Typhoon Warning Center or JTWC noted that Lili’s maximum sustained winds were near 35 knots (40 mph/74 kph). At the time, Lili was centered near 9.3 degrees south latitude and 128.2 degrees east longitude, about 238 nautical miles northwest of Darwin, Australia. Lili has tracked to the west-northwest at 3 knots (3.4 mph/5.5 kph).
At 8 a.m. EDT (1248 UTC) animated enhanced infrared satellite imagery and a microwave satellite image showed a partially-exposed low-level circulation with isolated strong thunderstorms now over the southern quadrant. Satellite imagery shows that dry air has been feeding into the storm and sapping the storm’s ability to generate the thunderstorms it needs to be maintained. That dry air “entrainment” or movement into Lili is expected to continue. Lili is forecast to track to the west-northwest and dissipate in a day.
May 09, 2019 – NASA-NOAA Satellite Catches Formation of Tropical Cyclone Lili
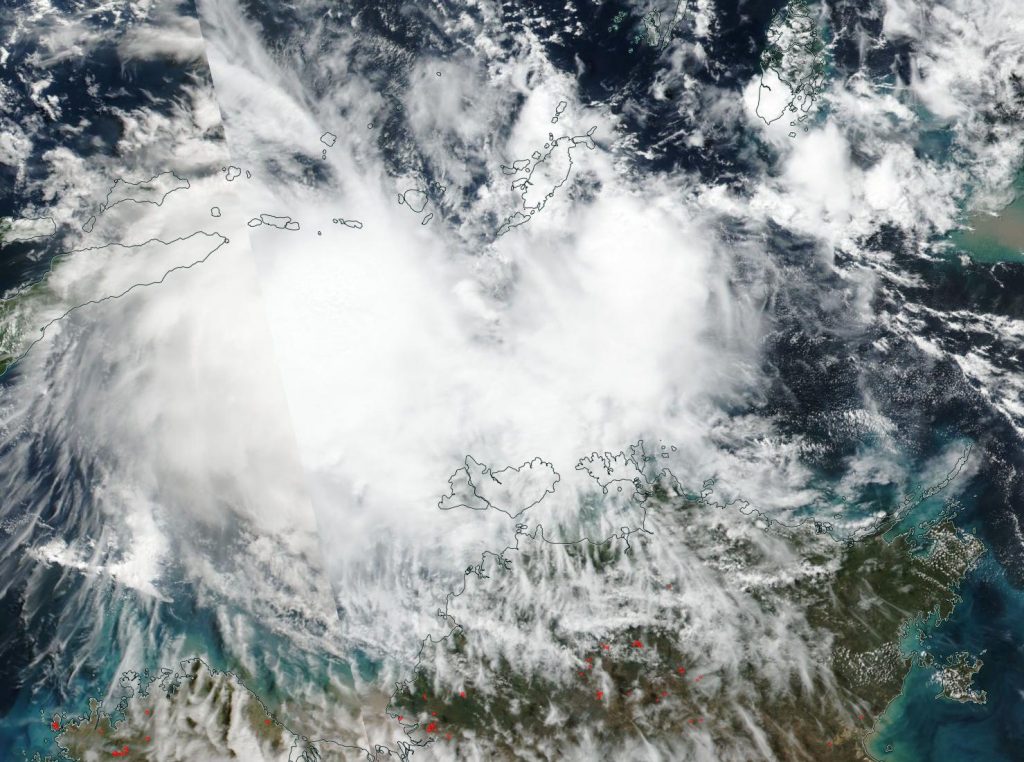
NASA-NOAA’s Suomi NPP satellite passed over the Southern Indian Ocean and captured a visible image of newly formed Tropical Cyclone Lili, located north of the coast of Australia’s Northern Territory.
NASA-NOAA’s Suomi NPP satellite passed over the Southern Indian Ocean and captured a visible image of Tropical Cyclone Lili on May 9, as it continued to linger north of Australia’s Northern Territory. Credit: NASA Worldview, Earth Observing System Data and Information System (EOSDIS)/NOAA
The Australian Bureau of Meteorology or ABM issued a Strong Wind Warning for the following areas: Beagle Bonaparte Coast, North Tiwi Coast, Arafura Coast and Roper Groote Coast. There is no tropical cyclone warning currently in effect.
NASA-NOAA’s Suomi NPP satellite passed over Lili on May 9 and the Visible Infrared Imaging Radiometer Suite (VIIRS) instrument provided a visible image of the storm. The VIIRS image showed strong thunderstorms around the center of circulation and in a large band extending to the east of the storm. The satellite imagery shows a consolidating system in the Timor Sea.
At 11 a.m. EDT (1500 UTC) on May 9, the Joint Typhoon Warning Center or JTWC noted that Lili had maximum sustained winds near 40 knots (46 mph/74 kph). Lili is centered near 9.1 degrees south latitude and 128.8 degrees east longitude. Lili is located approximately 236 nautical miles north-northwest of Darwin, Australia and has tracked south-southwestward.
Lili is expected to strengthen slightly in the next day before weakening as it moves in a westerly direction toward Timor.
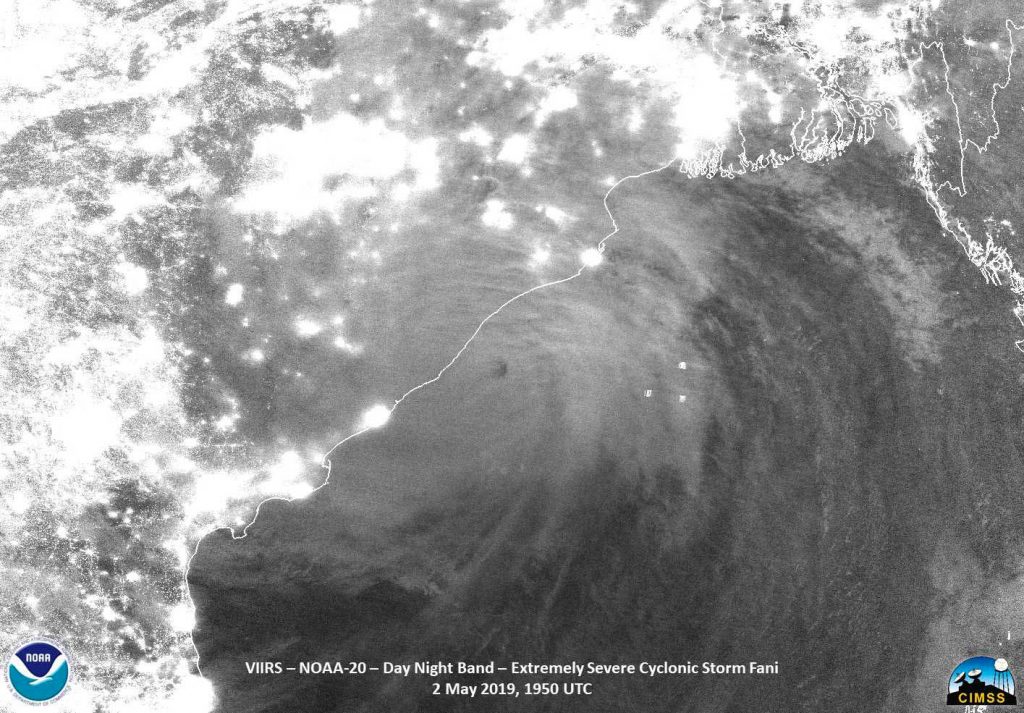
Tropical Cyclone Fani at Night The VIIRS instrument aboard NOAA’s NOAA-20 polar orbiting satellite provided a night-time view of Tropical Cyclone Fani on May 2 at 1950 UTC (3:50 p.m. EDT). At the time Fani was a strong Category 4 storm, on the Saffir-Simpson. The moon phase was a Waning Crescent moon with only approximately 6 percent illumination. That means the only illumination are from either man-made lights, lightning or airglow from the mesosphere (upper atmosphere). Airglow is a glow in the night sky caused by radiation from the upper atmosphere. Credit: NOAA/UWM-CIMSS/William Straka IIIDaytime View of Tropical Cyclone Fani Early on May 3, 2019 (EDT), NASA’s Terra satellite passed over the Northern Indian Ocean and captured this visible image of Tropical Cyclone Fani making landfall in the Indian state of Odisha. The Moderate Resolution Imaging Spectroradiometer or MODIS instrument aboard Terra provided the image that showed the center of circulation over Odisha. The bands of thunderstorms circling the center extended north and east over the states of Jharkhand and West Bengal and into the country of Bangladesh. Credit: NASA
May 03, 2019 – NASA Reveals Heavy Rainfall in Tropical Cyclone Fani
Satellite data revealed heavy rainfall in powerful Tropical Cyclone Fani before it made landfall in northeastern India. Fani brought that soaking rain to the region and continues to drop heavy rainfall on May 3, as it moves toward Bangladesh.
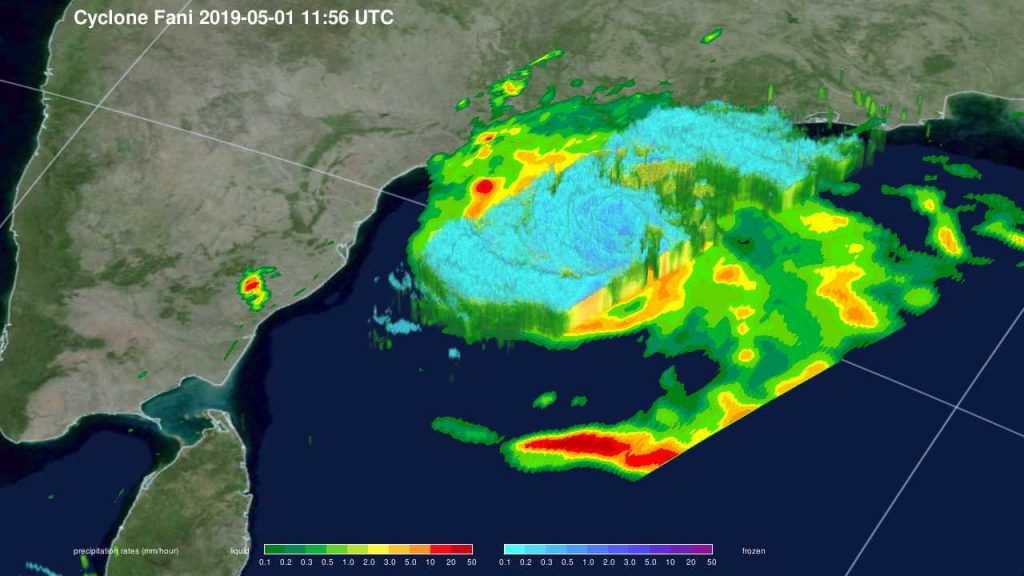
The GPM core observatory satellite passed over Tropical Cyclone Fani on May 1 as it was strengthening and nearing landfall in northeastern India. This 3D image shows the powerful storms circling the center. Credit: NASA/JAXA/Jacob Reed
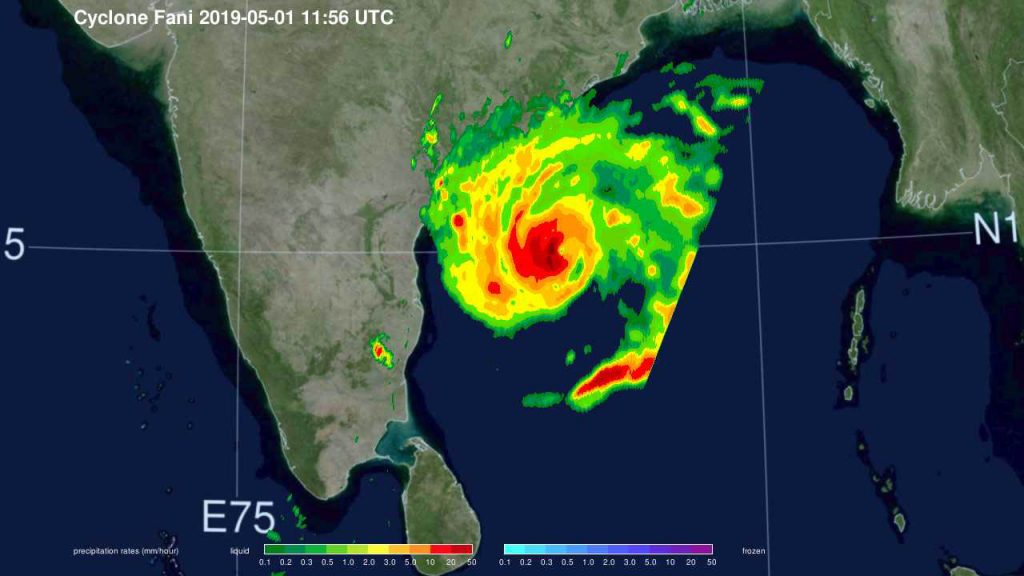
NASA’s GPM or Global Precipitation Measurement mission satellite provides information on precipitation from its orbit in space. On May 1 at 7:56 a.m. EDT (1156 UTC), the GPM Core Observatory captured an overpass of the powerful storm as it continued strengthening and moving toward landfall. A 3D image and a color-enhanced rainfall image were created at NASA’s Goddard Space Flight Center in Greenbelt, Maryland. The images showed how high thunderstorms stretched into the troposphere and measured rainfall rates. GPM found that some of the heaviest rainfall rates were up to 50 millimeters (2 inches) per hour and were in the western quadrant of the storm.
GPM is a joint mission between NASA and the Japan Aerospace Exploration Agency or JAXA. GPM also utilizes a constellation of other satellites to provide a global analysis of precipitation of rainfall around the world.
The GPM core observatory satellite passed over Tropical Cyclone Fani on May 1 as it was strengthening and nearing landfall in northeastern India. This image shows the powerful storms circling the center that were producing rainfall at a rate greater than 50 mm/2 inches per hour (red). Credit: NASA/JAXA/Jacob Reed
The India Meteorological Department reported that Fani made landfall in Odisha at about 8 a.m. local time on Friday morning, May 3. Fani’s sustained winds were estimated near 108 knots (125 mph/201 kph) at the time of landfall. Fani is the strongest cyclone to hit India’s coast since a storm in 1999. About 1.2 million people had evacuated prior to Fani’s landfall.
The Joint Typhoon Warning Center or JTWC issued their final warning on Fani at 11 a.m. EDT (1500 UTC) on May 3. At that time, Fani’s center was located near 21.8 degrees north latitude and 86.6 degrees east longitude. It was centered about 145 nautical miles west-southwest of Kolkata, India. Fani has tracked north-northeastward. At that time, Fani’s maximum sustained winds had dropped to 70 knots (80 mph/130) making it the equivalent of a Category 1 hurricane on the Saffir-Simpson Hurricane Wind Scale.
On May 3, NASA infrared satellite imagery measured the temperatures of the cloud tops of the thunderstorms that made up Fani. The imagery showed warming cloud tops and significantly reduced deep convection (rising air that forms the thunderstorms that make up a tropical cyclone).
The JTWC noted that Fani is weakening due to land interaction. Fani is expected to reach Bangladesh as a minimal tropical storm early on May 4, and dissipate later in the day.
May 02, 2019 – NASA Goes Infrared on Powerful Tropical Cyclone Fani
NASA’s Aqua satellite focused an infrared eye on a very powerful Tropical Cyclone Fani as it approached landfall in northeastern India. Fani is a powerful Category 4 hurricane on the Saffir-Simpson Hurricane Wind Scale.
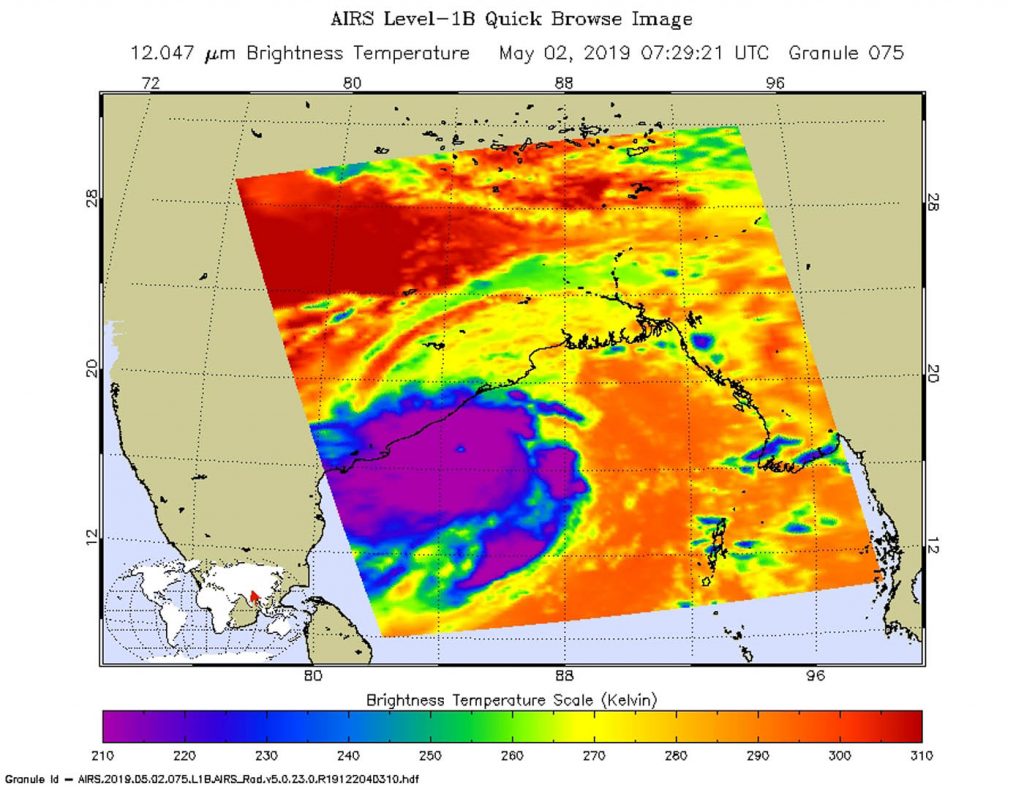
On May 2 at 3:29 a.m. EDT (0729 UTC), the AIRS instrument aboard NASA’s Aqua satellite analyzed cloud top temperatures of Tropical Cyclone Fani in infrared light. AIRS found cloud top temperatures of strongest thunderstorms were as cold as or colder than minus 80 degrees Fahrenheit (minus 62 degrees Celsius). Credit: NASA JPL/Heidar Thrastarson
On May 2 at 3:29 a.m. EDT (0729 UTC), the Atmospheric Infrared Sounder or AIRS instrument aboard NASA’s Aqua satellite analyzed cloud top temperatures of Tropical Cyclone Fani in infrared light. AIRS found cloud top temperatures of strongest thunderstorms as cold as or colder than minus 80 degrees Fahrenheit (minus 62 degrees Celsius) circling the eye and in a fragmented band of thunderstorms east of the center. Satellite data showed there is now a 16 nautical mile-wide round, symmetrical eye surrounded by a thick band of powerful thunderstorms. Cloud top temperatures that cold indicate strong storms that have the capability to create heavy rain.
On May 2 at 11 a.m. EST (1500 UTC), the center of Tropical Cyclone Fani was located near latitude 17.6 degrees north and longitude 84.8 degrees east. That is about 87 miles east of Visakhapatnam, India. Fani was moving to the north and maximum sustained winds increased to 135 knots (155 mph/250 kph).
Fani is forecast to move to the north-northeast. The India Meteorological Department forecasts Fani to make landfall within 12 to 24 hours, then weaken rapidly and dissipate over northeastern India and Bangladesh.
For local forecasts, visit the India Meteorological Department: www.imd.gov.in/
May 01, 2019 – NASA Satellites Track Tropical Cyclone Fani Along Eastern India’s Coastline
NASA’s Aqua and Terra satellites have been providing infrared, microwave and visible imagery of Tropical Cyclone Fani as it continued to move northward along the eastern coast of India.
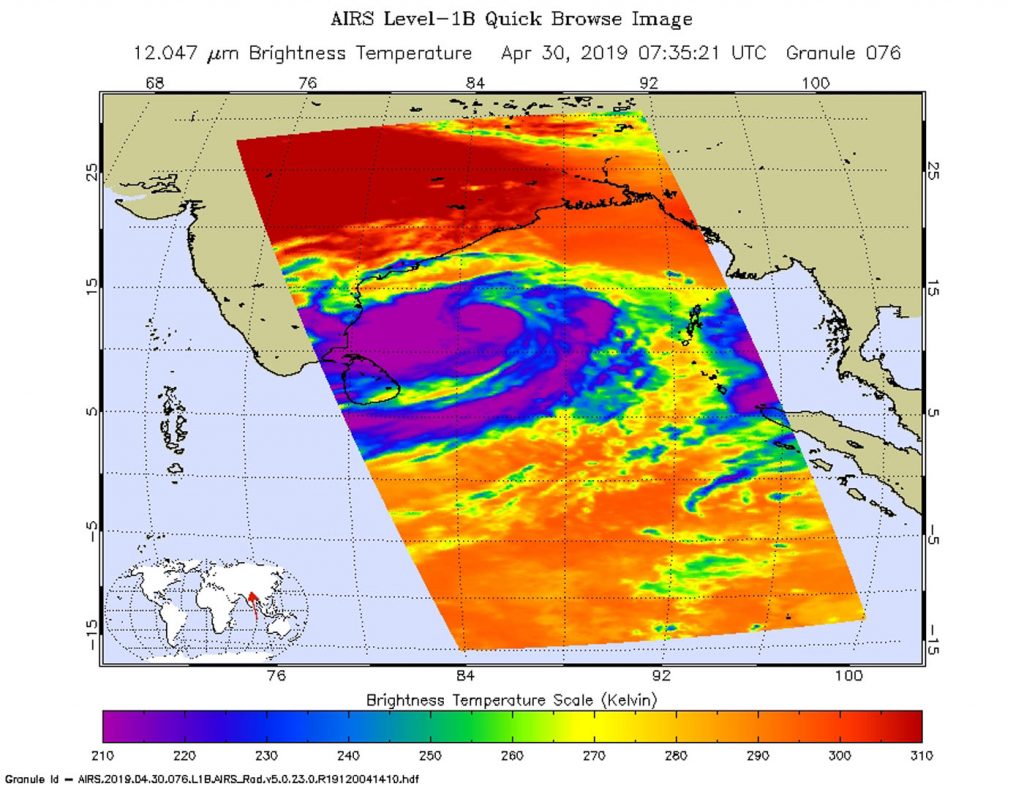
On April 30 at 3:35 a.m. EDT (0735 UTC), the AIRS instrument aboard NASA’s Aqua satellite analyzed cloud top temperatures of Tropical Cyclone Fani in infrared light. AIRS found cloud top temperatures of strongest thunderstorms were as cold as or colder than minus 63 degrees Fahrenheit (minus 53 degrees Celsius). Credit: NASA JPL/Heidar Thrastarson
Tropical Cyclone Fani continued to strengthen and move north through the Northern Indian Ocean on April 30 and May 1 when NASA’s Aqua and Terra satellite provided imagery of the strengthening storm. Fani is located off the southeastern coast of India, north of the island of Sri Lanka. Sri Lanka is an island country located southwest of the Bay of Bengal and southeast of the Arabian Sea.
On April 30 at 3:35 a.m. EDT (0735 UTC) the Atmospheric Infrared Sounder or AIRS instrument aboard NASA’s Aqua satellite analyzed cloud top temperatures of Tropical Cyclone Fani in infrared light. AIRS found cloud top temperatures of strongest thunderstorms as cold as or colder than minus 63 degrees Fahrenheit (minus 53 degrees Celsius) circling the center and in a large band east of the center. Cloud top temperatures that cold indicate strong storms that have the capability to create heavy rain.
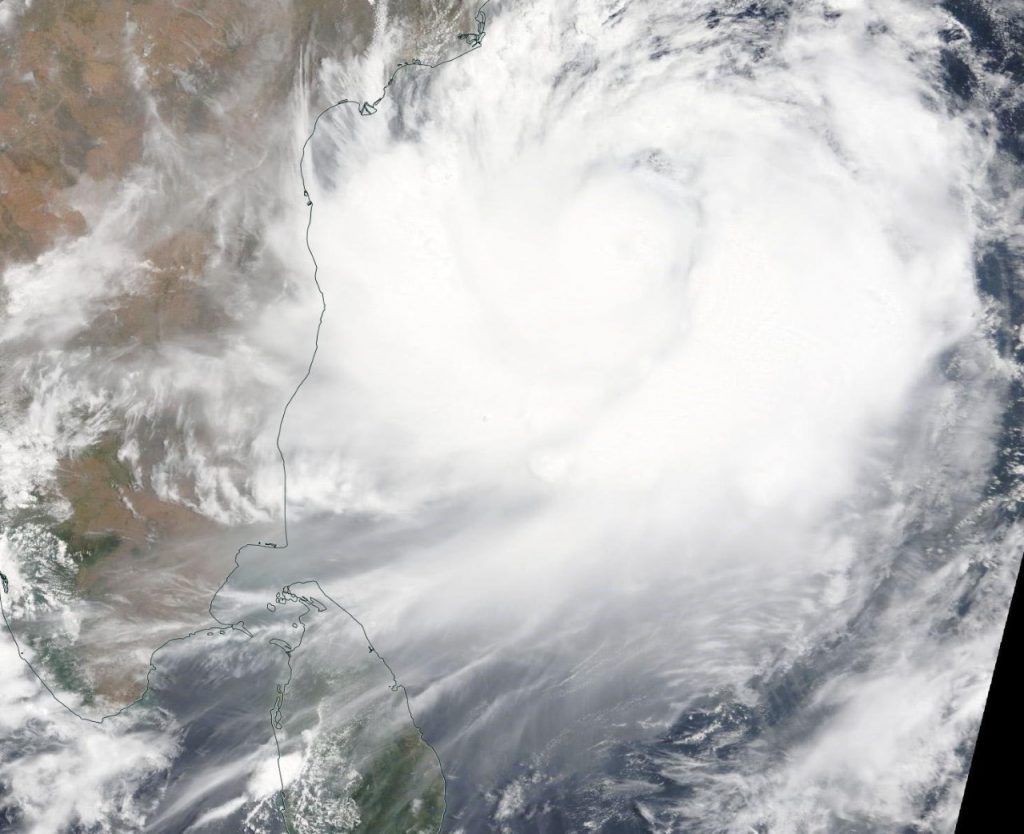
On May 1, 2019, the MODIS instrument aboard NASA’s Terra satellite provided a visible image of Tropical Cyclone Fani in the Northern Indian Ocean, off the coast southeastern India. Credit: NASA Worldview, Earth Observing System Data and Information System (EOSDIS)
On May 1, the Moderate Resolution Imaging Spectroradiometer or MODIS instrument aboard NASA’s Terra satellite provided a visible image of Fani. Fani’s center appeared to have an eye obscured by high clouds. Infrared imagery revealed that ragged eye and microwave imagery showed curved bands of thunderstorms wrapping into the eye.
Fani was located off the coast of southeastern India. It was affecting the Coramandal Coast that stretches from the southeastern tip of India to east-central India’s Andhra Coast to the north.
On May 1 at 11 a.m. EST (1500 UTC), the center of Tropical Cyclone Fani was located near latitude 15.2 degrees north and longitude 84.3 degrees east. That is about 520 nautical miles south-southwest of Kolkata, India. Fani was moving to the north and maximum sustained winds were near 105 knots (121 mph/194 kph).
The Joint Typhoon Warning Center expects Fani to continue moving north and intensify slightly as it moves over warm waters. Fani is forecast to move to the north-northeast. The India Meteorological Department forecasts Fani to make landfall along the Odisha coastline between Gopalpur and Chandbali on May 3 at hurricane-strength.
For local forecasts, visit the India Meteorological Department: www.imd.gov.in/
Apr. 30, 2019 – NASA’s Aqua Satellite Finds Tropical Cyclone Fani Stronger, More Organized
Visible imagery from NASA’s Aqua satellite showed Tropical Cyclone Fani appeared more organized than the previous day.
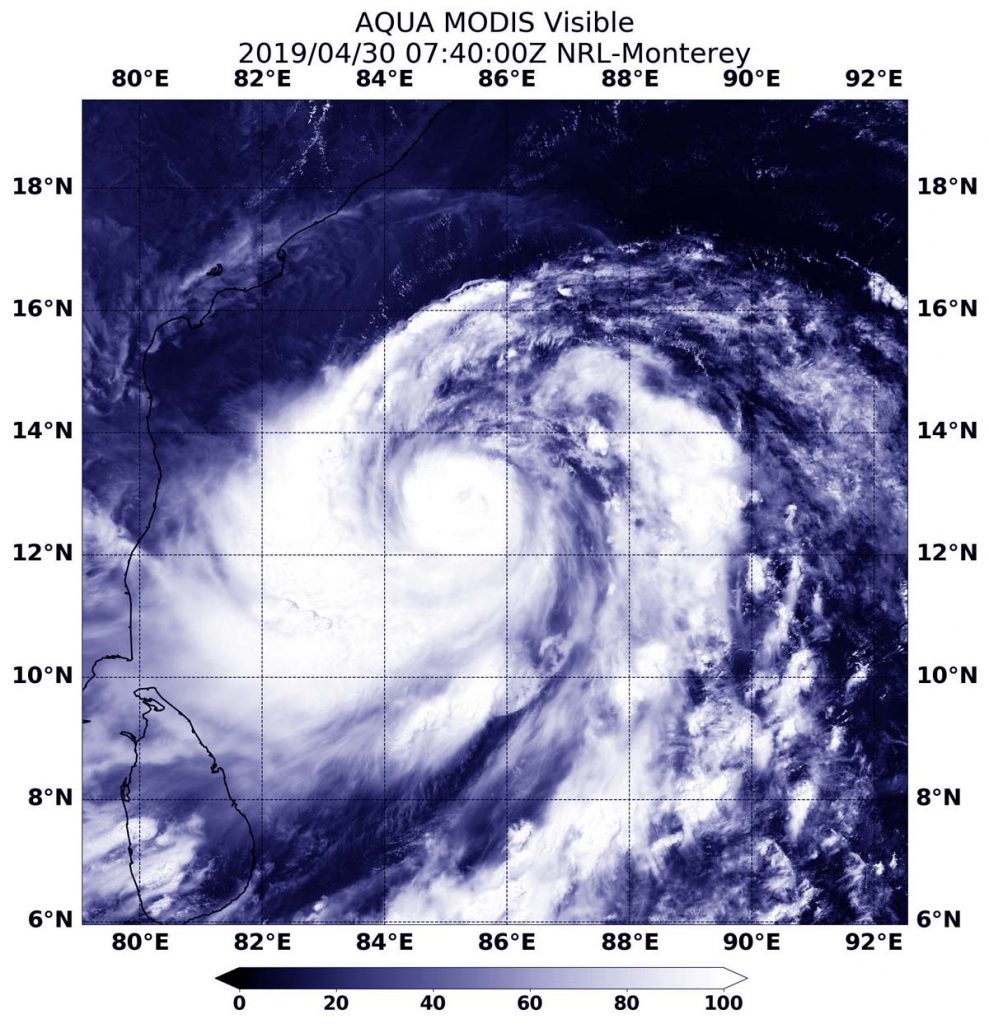
On April 30, at 3:40 a.m. EDT (0740 UTC) the MODIS instrument aboard NASA’s Aqua satellite provided a visible image of Tropical Cyclone Fani in the Northern Indian Ocean showing powerful thunderstorms around the center of circulation. Credit: NASA/NRL
On April 30, at 3:40 a.m. EDT (0740 UTC) the Moderate Resolution Imaging Spectroradiometer or MODIS instrument aboard NASA’s Aqua satellite provided a visible image of Fani. The image revealed a tight circular area of powerful thunderstorms around Fani’s small low-level center of circulation. A large, powerful and thick band of thunderstorms spiraled into the center from the west, and a large fragmented band circled the center from the east. There’s also the hint of a developing eye in the MODIS image.
At 11 a.m. EDT (1500 UTC), the Joint Typhoon Warning Center or JTWC noted that the maximum sustained winds had increased to 90 knots (104 mph/167 kph). That’s the equivalent of a Category 2 hurricane on the Saffir-Simpson Hurricane Wind Scale. Fani was centered near 12.9 degrees north latitude and 85.5 degrees east longitude, approximately 612 nautical miles south-southwest of Calcutta, India. Fani was moving to the northwest.
The JTWC forecast noted that Fani is in an area favorable for further intensification. It is moving through an area of warm sea surface temperatures, as warm as 31 degrees Celsius. Sea surface temperatures warmer than 80 degrees Fahrenheit (26.6 degrees Celsius) are needed to maintain a tropical cyclone, so the warmer waters will help the storm intensify. Fani is also moving through an area with low wind shear, so outside winds will not inhibit further development.
JTWC expects Fani to continue northward and turn northeast. Landfall is expected in about 84 hours or three and a half days on the Odisha coast. Odisha is one of the 29 states of India.
For updated forecasts from the India Meteorological Department, visit: http://www.imd.gov.in/
NASA’s Aqua satellite saw Tropical Cyclone Lorna was being torn apart by strong northwesterly wind shear in the Southern Indian Ocean.
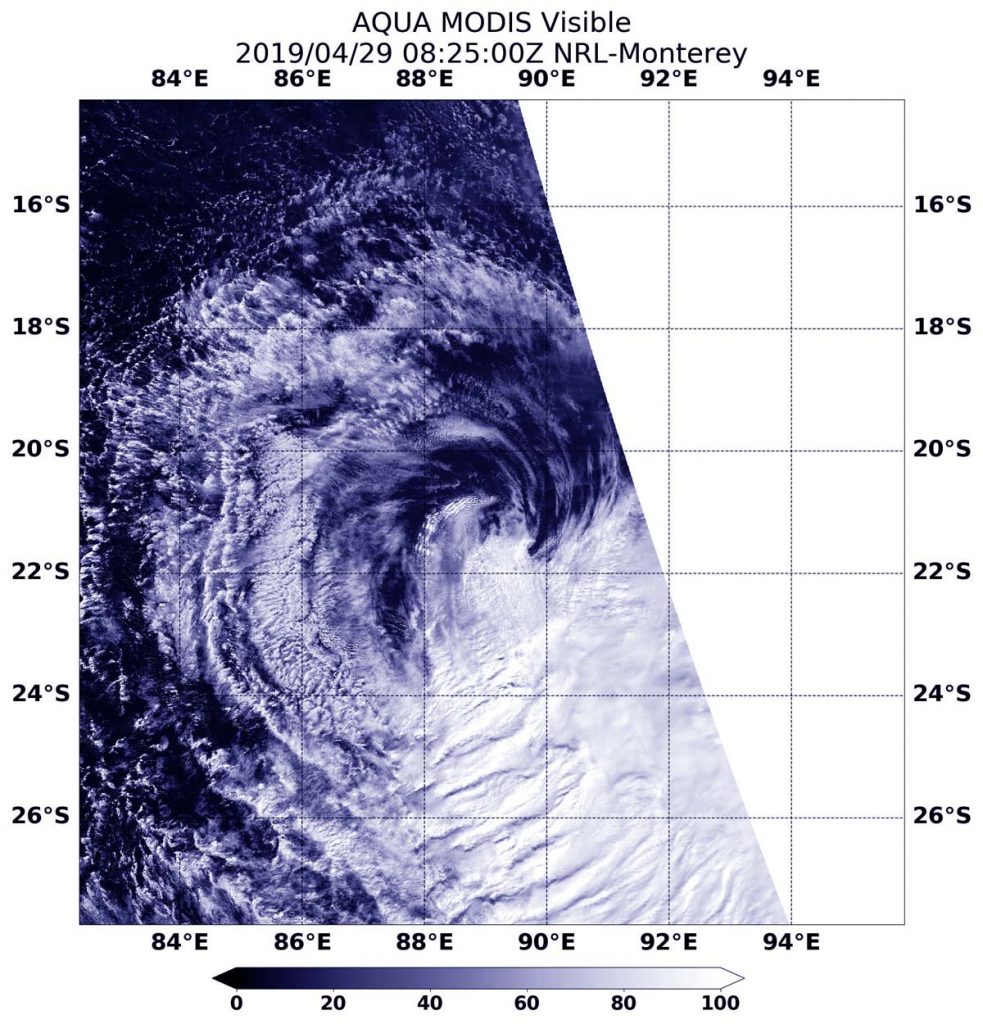
On April 29 at 4:29 a.m. EDT (0829 UTC), the MODIS instrument aboard NASA’s Aqua satellite provided a visible image of Tropical Cyclone Lorna in the Southern Indian Ocean. Credit: NASA/NRL
In general, wind shear is a measure of how the speed and direction of winds change with altitude. Tropical cyclones are like rotating cylinders of winds. Each level needs to be stacked on top each other vertically in order for the storm to maintain strength or intensify. Wind shear occurs when winds at different levels of the atmosphere push against the rotating cylinder of winds, weakening the rotation by pushing it apart at different levels.
On April 29 at 4:29 a.m. EDT (0829 UTC), the Moderate Resolution Imaging Spectroradiometer or MODIS instrument aboard NASA’s Aqua satellite provided a visible image of Lorna. Northwesterly winds were pushing the bulk of Lorna’s clouds far southeast of its center.
At 11 a.m. EDT (1500 UTC), the Joint Typhoon Warning Center or JTWC issued their final warning in Lorna. At that time, JTWC noted that Tropical Cyclone Lorna was located near 22.1 degrees south latitude and 88.8 degrees east longitude. That is 738 nautical miles southwest of Cocos Island. Lorna was moving to the south-southwest. Maximum sustained winds dropped to 35 knots (40 mph/65 kph) and the storm was getting weaker.
Lorna is rapidly weakening under adverse atmospheric conditions. The JTWC noted that the “environment is very hostile with extremely high (50 to 60 knot/57 to 69 mph/ /92 to 111 kph) vertical wind shear,” which is tearing the storm apart. Lorna is forecast to dissipate by April 30.
Apr. 29, 2019 – NASA Looks at Tropical Storm Fani’s Rainfall Rates
Tropical Storm Fani formed in the Northern Indian Ocean over the weekend of April 27 and 28. The Global Precipitation Measurement mission or GPM core satellite passed over the storm and measured rainfall occurring throughout the new storm.
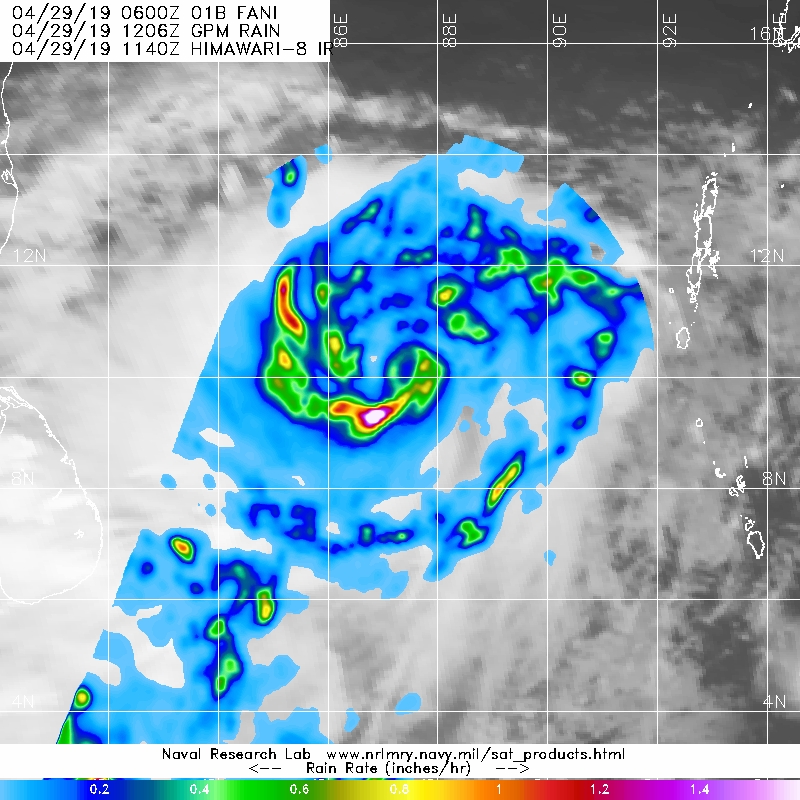
The GPM core satellite passed over Tropical Storm Fani at 8:06 a.m. EDT (1206 UTC) on April 29. GPM found the heaviest rainfall (pink) was in an area south of the center of circulation. There rain was falling at a rate of about 1.6 inches (40 mm) per hour. Rainfall was occurring at rate around 1 inch (25 mm) per hour in bands of thunderstorms circling the center. Credit: NASA/JAXA/NRL
GPM’s core satellite flew over Tropical Cyclone Fani at 8:06 a.m. EDT (1206 UTC) on April 29 and found the heaviest rainfall was in an area south of the center of circulation. There rain was falling at a rate of about 1.6 inches (40 mm) per hour. Rainfall was occurring at rate around 1 inch (25 mm) per hour in bands of thunderstorms circling the center. GPM is a joint mission between NASA and the Japan Aerospace Exploration Agency, JAXA.
The Joint Typhoon Warning Center noted, “Animated enhanced infrared satellite imagery reveals significant consolidation in the convective structure and a better idea of the location of the low level circulation center. There is high confidence in the initial position based on an eye feature in a microwave satellite image.”
At 11 a.m. EDT (1500 UTC), the center of Tropical Cyclone Fani had maximum sustained winds near 55 knots (63 mph/102 kph). Fani was located near latitude 10.5 degrees north and longitude 86.6 degrees east. That is about 420 nautical miles east-southeast of Chennai, India. Fani is moving to the northwest and is forecast to intensify to hurricane strength.
Fani is forecast to make landfall in northeastern India on May 3.
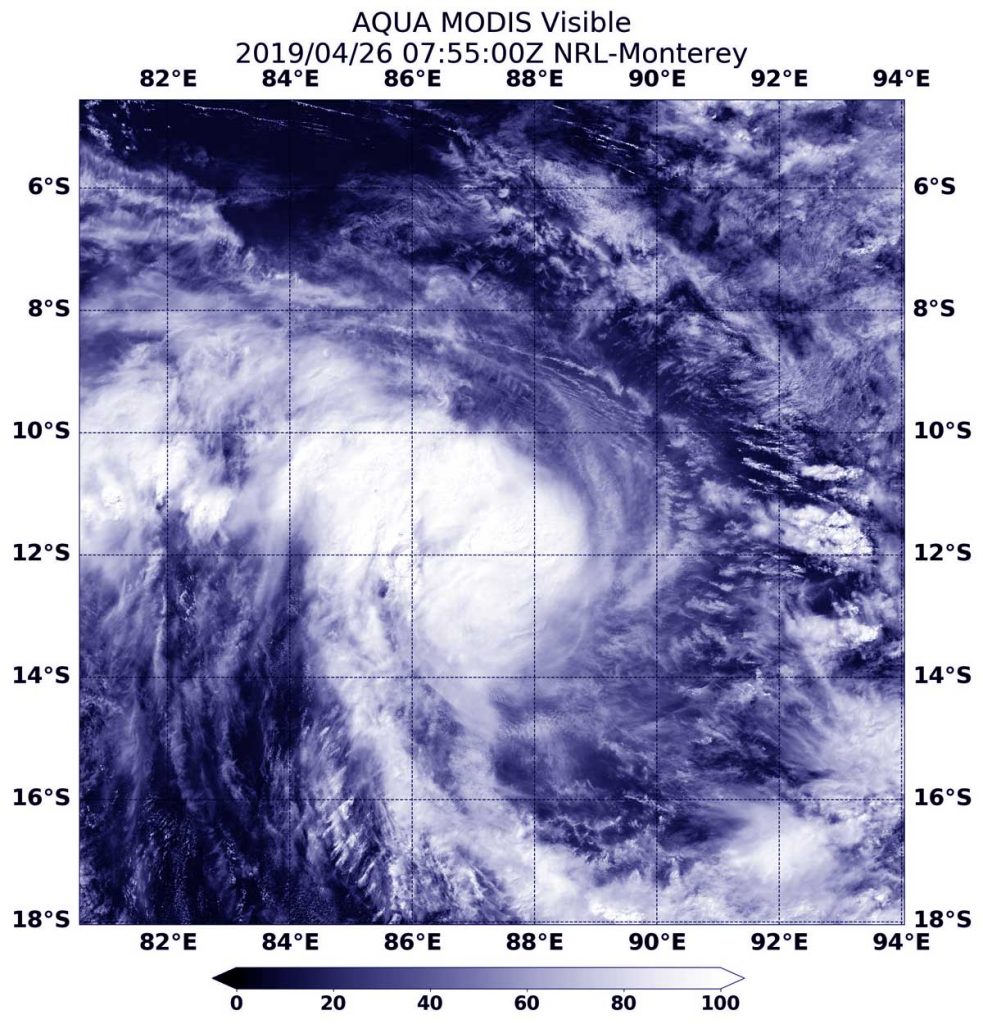
As Tropical Storm Lorna continued moving in a southerly direction in the Southeastern Indian Ocean, NASA’s Aqua satellite passed overhead and provided forecasters with a look at the storm.
At 3:55 a.m. EDT (0755 UTC) on April 26, the MODIS instrument aboard Aqua captured a visible image of Tropical Storm Lorna in the Southeastern Indian Ocean. Credit: NASA/NRL
At 3:55 a.m. EDT (0755 UTC) on April 26, the Moderate Resolution Imaging Spectroradiometer or MODIS instrument aboard Aqua captured a visible image of Lorna. Lorna does not appear symmetrical and the strongest thunderstorms appear over the western side of the storm. The Joint Typhoon Warning Center or JTWC forecasters also noted, “Animated enhanced infrared satellite imagery depicts a central dense overcast feature obscuring the low-level circulation center.”
By 11 a.m. EDT (1500 UTC) on April 26, Tropical Storm Lorna had maximum sustained winds near 60 knots (46 mph/74 kph). Lorna was centered near 13.0 degrees south latitude and 88.6 degrees east longitude, approximately 495 nautical miles west of Cocos Island. Lorna was moving to the east-southeast.
Lorna is forecast to strengthen to hurricane-strengthen and move in a southerly direction. Over the weekend of April 27 and 28, Lorna is expected to begin transitioning into an extra-tropical cyclone.
That means that a tropical cyclone has lost its “tropical” characteristics. The National Hurricane Center defines “extra-tropical” as a transition that implies both poleward displacement (meaning it moves toward the north or south pole) of the cyclone and the conversion of the cyclone’s primary energy source from the release of latent heat of condensation to baroclinic (the temperature contrast between warm and cold air masses) processes. It is important to note that cyclones can become extratropical and retain winds of hurricane or tropical storm force.