Feb. 19, 2019 – NASA-NOAA Satellite Sees Powerful Tropical Cyclone Oma Affecting New Caledonia
Tropical Cyclone Oma appeared well-organized on satellite imagery as it moved through the Southern Pacific Ocean, just northwest of New Caledonia.
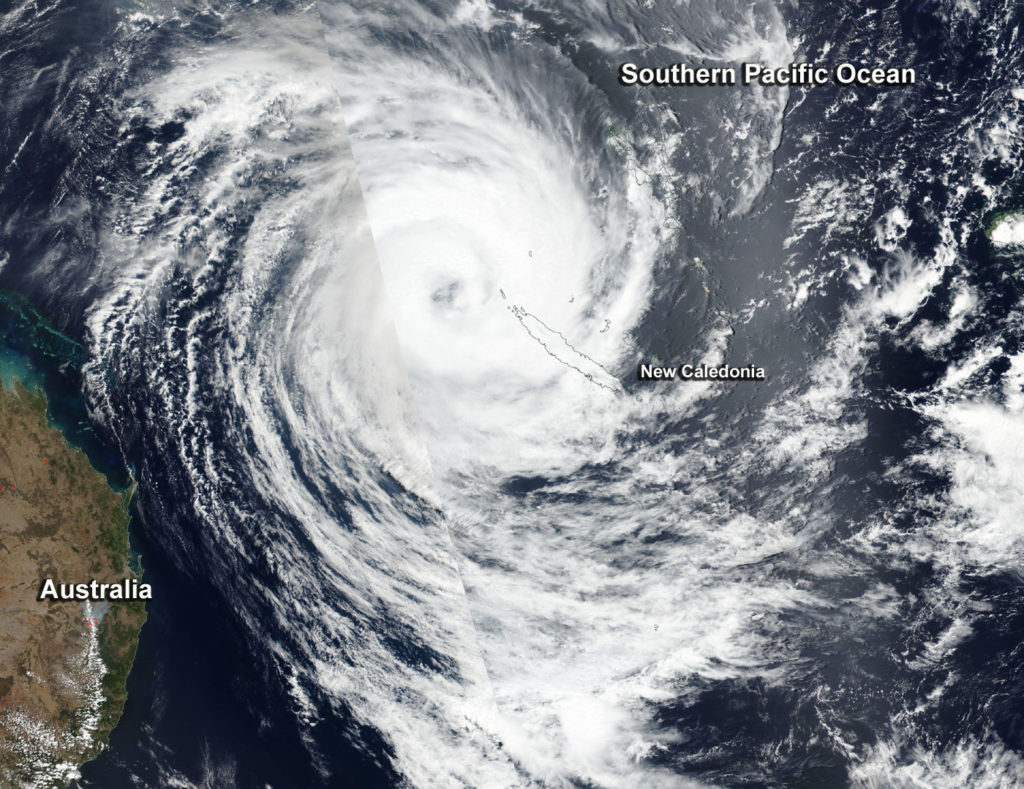
On Feb. 19, 2019, the VIIRS instrument aboard NASA-NOAA’s Suomi NPP satellite captured a visible image of Tropical Cyclone Oma near New Caledonia in the Southern Pacific Ocean. Credit: NASA Worldview, Earth Observing System Data and Information System (EOSDIS)
On February 19, New Caledonia posted a tropical cyclone alert level 2 for the communities of Belep, Hienghene, Kaala-Gomen, Koumac, Ouegoa, Ouebo and Poum. New Caledonia is a French territory that consists of dozens of islands in the South Pacific Ocean. It ls located about 750 miles (1,210 km) east of Australia.
On Feb.19, the Visible Infrared Imaging Radiometer Suite (VIIRS) instrument aboard NASA-NOAA’s Suomi NPP satellite provided a visible image of Tropical Cyclone Oma that revealed an eye surrounded by powerful thunderstorms. Oma’s southeastern quadrant covered New Caledonia. The northern tip of the island was close to Oma’s eyewall.
At 10 a.m. EDT (1500 UTC) Oma’s maximum sustained winds were near 75 knots (86 mph/139 kph). Oma’s eye was located approximately 246 nautical miles west-northwest of Noumea, New Caledonia, near 20.6 degrees south latitude and 162.0 east longitude. Oma was moving to the south.
Oma is moving south and the Joint Typhoon Warning Center forecast calls for the storm to strengthen to 85 knots (98 mph/157 kph). The storm will then become extra-tropical as it turns southeast
Tropical cyclones can become post-tropical before they dissipate, meaning they can become sub-tropical, extra-tropical or a remnant low pressure area. As Tropical Cyclone Gelena transitioned into a subtropical storm, NASA’s Aqua satellite provided a visible image of the storm.
On Feb 15 at 10 p.m. EDT (Feb. 16 at 0300 UTC), the MODIS instrument aboard NASA’s Aqua satellite provided a visible image of Gelena that showed the storm had transitioned into a post-tropical cyclone. Credit: NASA/NRL
On Feb 15 at 10 p.m. EDT (Feb. 16 at 0300 UTC), the Joint Typhoon Warning Center or JTWC noted that Gelena had already become subtropical. JTWC issued their final warning on Gelena. At that time, the storm had maximum sustained winds near 40 knots (46 mph/74 kph). It was centered near 29.8 degrees south latitude and 89.3 degrees east longitude. That’s 1,426 nautical miles east-southeast of Learmonth, Australia. Gelena was moving east-southeast.
What is a Post-tropical Storm?
A Post-Tropical Storm is a generic term for a former tropical cyclone that no longer possesses sufficient tropical characteristics to be considered a tropical cyclone. Former tropical cyclones that have become fully extratropical, subtropical, or remnant lows, are three classes of post-tropical cyclones. In any case, they no longer possesses sufficient tropical characteristics to be considered a tropical cyclone. However, post-tropical cyclones can continue carrying heavy rains and high winds.
What is a Sub-tropical Storm?
According to the National Oceanic and Atmospheric Administration, a sub-tropical storm is a low-pressure system that is not associated with a frontal system and has characteristics of both tropical and extratropical cyclones. Like tropical cyclones, they are non-frontal that originate over tropical or subtropical waters, and have a closed surface wind circulation about a well-defined center.
Unlike tropical cyclones, subtropical cyclones derive a significant proportion of their energy from baroclinic sources (atmospheric pressure), and are generally cold-core in the upper troposphere, often being associated with an upper-level low pressure area or an elongated area or trough of low pressure.
In comparison to tropical cyclones, these systems generally have a radius of maximum winds occurring relatively far from the center (usually greater than 60 nautical miles), and are generally less symmetric.
What is an Extra-tropical Storm?
Often, a tropical cyclone will transform into an extra-tropical cyclone as it recurves toward the poles (north or south, depending on the hemisphere the storm is located in). An extra-tropical cyclone is a storm system that primarily gets its energy from the horizontal temperature contrasts that exist in the atmosphere.
Tropical cyclones have their strongest winds near the earth’s surface, while extra-tropical cyclones have their strongest winds near the tropopause – about 8 miles (12 km) up. Tropical cyclones, in contrast, typically have little to no temperature differences across the storm at the surface and their winds are derived from the release of energy due to cloud/rain formation from the warm moist air of the tropics.
Visible NASA Imagery Shows the Transition
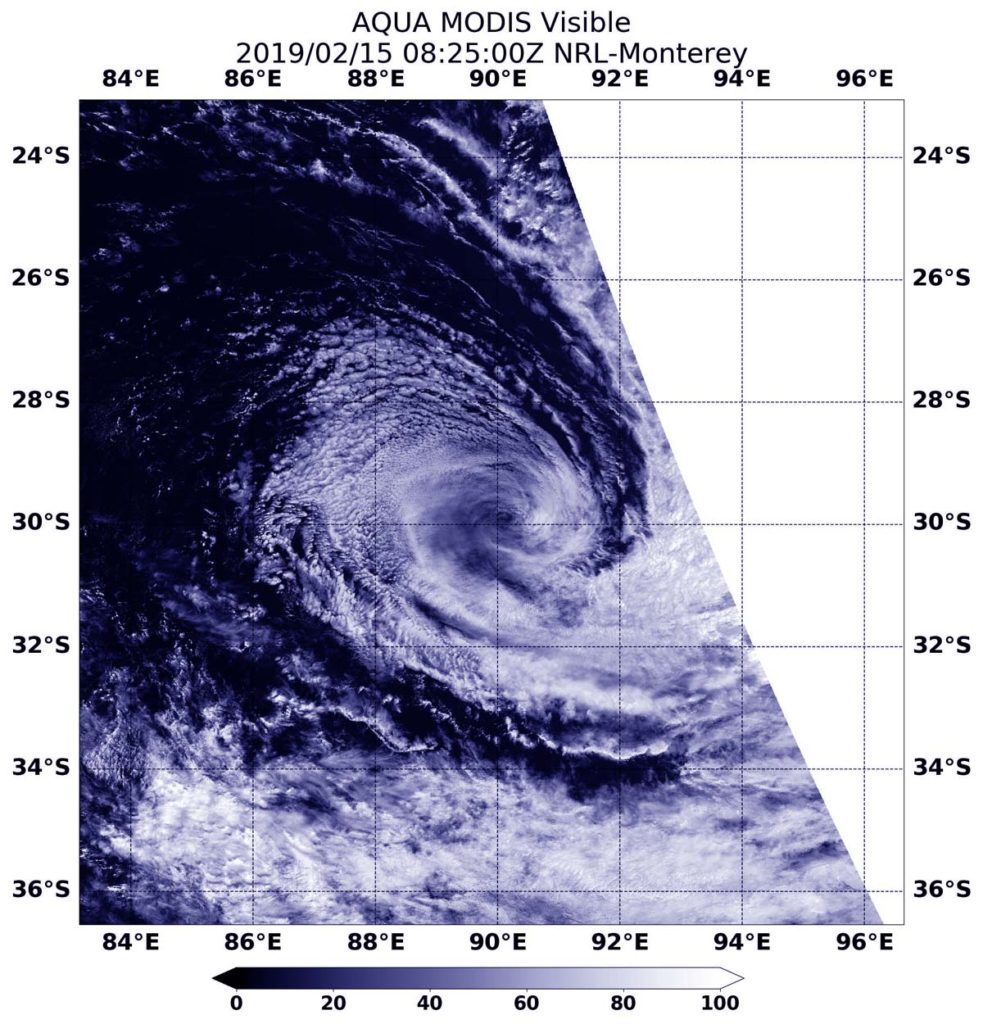
Visible imagery from NASA’s Aqua satellite revealed Gelena’s subtropical transition.
At 3:25 a.m. EDT (0825 UTC) on Feb. 15, 2019, the Moderate Resolution Imaging Spectroradiometer or MODIS instrument aboard NASA’s Aqua satellite provided a visible image of subtropical storm Gelena in the Southern Indian Ocean. The MODIS image showed Gelena had a closed surface wind circulation about a well-defined center, but the storm has become asymmetric (as subtropical storms do).
The Joint Typhoon Warning Center noted “animated multispectral satellite imagery shows cloud tops continuing to warm and convective structure continuing to unravel. [Another satellite] image showed remnant convective bands [of thunderstorms] sheared (pushed by winds) to the south and wrapping into an elongated partially exposed low level circulation center.”
Gelena is expected to continue moving through the Southern Indian Ocean over the next day until it dissipates.
Feb. 15, 2019 – NASA Tracks Tropical Cyclone Oma as Warnings Remain for Vanuatu
Tropical Cyclone Oma continued to stay just west of Vanuatu in the Southern Pacific Ocean as NASA-NOAA’s Suomi NPP satellite passed overhead and captured an image of the tropical storm.
NASA-NOAA’s Suomi NPP satellite passed over the Southern Pacific Ocean and captured a visible image of Tropical Cyclone Oma on Feb. 15 when it was passing west of Vanuatu. Credit: NASA Worldview, Earth Observing System Data and Information System (EOSDIS).
Tropical Cyclone Warning Number 26 was issued by the Vanuatu Meteorology and Geo-Hazards Department (VMGD), Port Vila at 3:05 a.m. VUT (local time) Saturday, February 16, 2019 (11 a.m. EDT, Feb. 15) for the Torba, Sanma and Malampa Provinces. The VMGD noted that: “Heavy rainfalls and flash flooding over low lying areas and areas close to the river banks, including coastal flooding will continue to affect Torba, Sanma and Malampa provinces tonight. Seas will remain very rough to phenomenal with heavy and phenomenal swells over the affected areas.”
Suomi NPP passed over Oma on Feb. 15 and the Visible Infrared Imaging Radiometer Suite (VIIRS) instrument provided a visible image of the storm. The VIIRS image showed a large area of thunderstorms wrapping into the center. Most of the convection (rising air that condenses and forms clouds and thunderstorms that make up a tropical cyclone) is north of the center. Oma was passing to the west of Vanuatu.
VMDG reported at 2 a.m. local time on Feb. 16 (10 a.m. EDT on Feb. 15), “Tropical Cyclone Oma was located at 15.5 degrees south and 164.3 degrees east. That is about 260 kilometers (161 miles) west southwest of Santo and 345 kilometers (214 miles) west northwest of Malekula. Expected sustained winds close to the center are estimated at 102 kph (63 mph/55 knots). Damaging gale force winds of 75 kph (46 mph/40 knots) with gusts up to 102 kph (63 mph/55 knots) will continue to affect the Torba, Sanma and Malampa provinces for the next 12 to 24 hours.”
For updated forecasts from the Vanuatu Meteorology and Geo-Hazards Department, visit: https://www.vmgd.gov.vu/
Tropical Cyclone Gelena is being battered by outside winds, and that’s weakening the storm. Visible imagery from NASA’s Aqua satellite revealed the bulk of clouds in Tropical Cyclone Gelena were pushed away from the center.
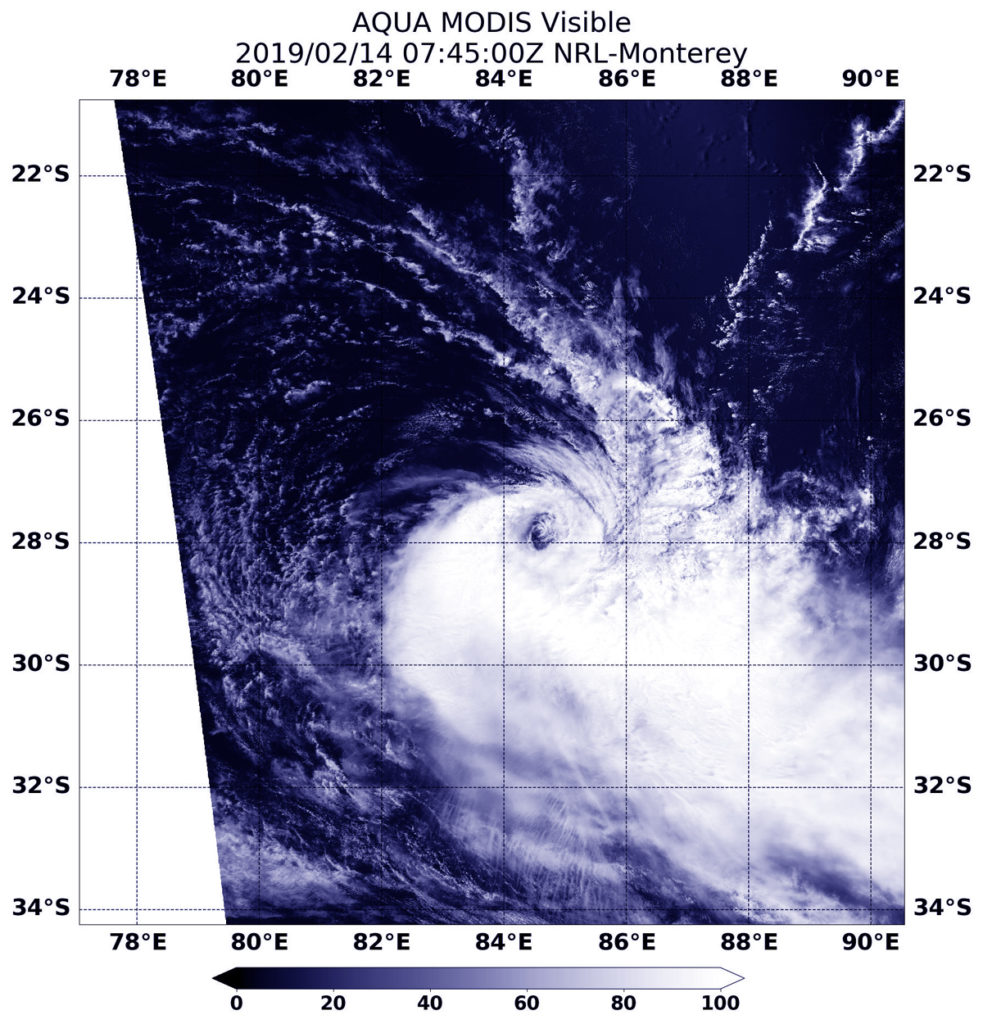
On Feb. 14, 2019 at 2:45 a.m. EDT (0745 UTC) the MODIS instrument aboard NASA’s Aqua satellite captured a visible light image of Tropical Cyclone Gelena being battered by wind shear in the Southern Indian Ocean. Credit: NASA/NRL
On Feb. 14, 2019 at 2:45 a.m. EDT (0745 UTC) the Moderate Resolution Imaging Spectroradiometer or MODIS instrument aboard NASA’s Aqua satellite captured a visible image of Tropical Cyclone Gelena in the Southern Indian Ocean. The image showed Gelena’s clear low level center of circulation, and the bulk of the tropical cyclone’s clouds pushed south of the center. That’s because of strong northerly wind shear.
In general, wind shear is a measure of how the speed and direction of winds change with altitude. Wind shear can tear a tropical cyclone apart or weaken it.
On Feb 14 at 10 a.m. EDT (1500 UTC), Gelena’s maximum sustained winds were near 40 knots (46 mph/74 kph). It was centered near 28.6 degrees south latitude and 86.6 east longitude. Tropical Cyclone Gelena is approximately 1,474 nautical miles south-southeast of Diego Garcia, and has tracked east-southeastward.
The Joint Typhoon Warning Center expects Gelena to dissipate in 24 hours as it continues to face strong vertical wind shear and moves into increasingly cooler sea surface temperatures.
Feb. 14, 2019 – NASA’s Aqua Satellite Eyes Tropical Cyclone Oma Near Vanuatu
Visible imagery from NASA’s Aqua satellite revealed the center of Tropical Cyclone Oma was just northwest of the island of Vanuatu in the South Pacific Ocean.
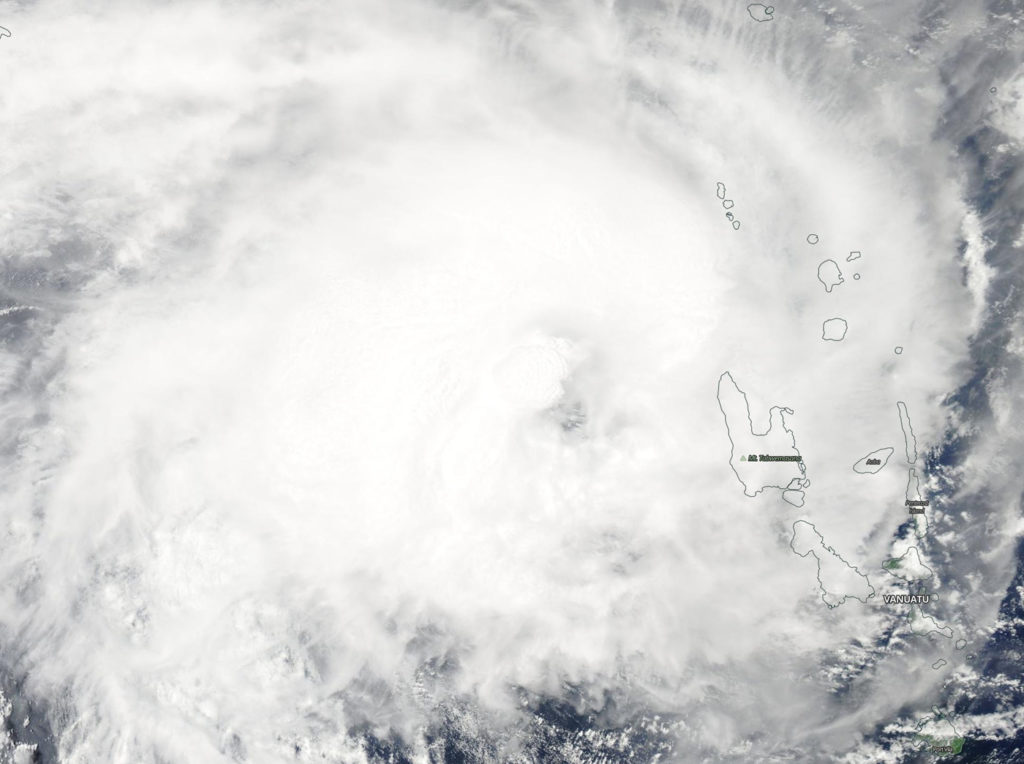
On Feb. 14, 2019, the MODIS instrument aboard NASA’s Aqua satellite captured a visible light image of Tropical Cyclone Oma in the Southern Pacific Ocean. Oma’s center is northwest of Vanuatu. Credit: NASA Worldview, Earth Observing System Data and Information System (EOSDIS)
Vanuatu consists of roughly 80 islands that stretch about 808 miles (1,300 kilometers).
The Vanuatu Meteorology and Geo-Hazards Department (VMGD) issued Tropical Cyclone Warning Number 18 for the Torba, Sanma, Penama and Malampa Provinces. Those provinces can expect heavy rainfall and flash flooding over low lying areas and areas close to the river banks. In addition, coastal flooding will continue.
The Vanuatu National Disaster Management Office (NDMO) noted that a red alert remains in force for Torba, Sanma, Penama and Malampa provinces, while yellow alert is in effect for the Shefa province.
On Feb. 14, 2019, the Moderate Resolution Imaging Spectroradiometer or MODIS instrument aboard NASA’s Aqua satellite captured a visible image of Tropical Cyclone Oma. The image showed Oma’s center northwest of Vanuatu. The image revealed a large area of bands of powerful thunderstorms wrapping into the low level circulation center, with most convection (rising air that forms the clouds and thunderstorms that make up the tropical cyclone) displaced to the north of the low-level center.
The VMGD noted “At 2:00 a.m. local time (Vanuatu) on Feb. 15 (9 a.m. EDT on Feb 14), Tropical Cyclone Oma was located at 16.0 degrees south and 164.7 degrees east. This is about 240 kilometers (149 miles) west southwest of Santo and 370 kilometers (230 miles) southwest of Banks. Tropical Cyclone Oma has moved in a south southwesterly direction at 16 kph (10 mph/9 knots). The central pressure of the system is estimated at 984hPa. Sustained winds close to the center are estimated at 95 kph (59 mph/50 knots). Gale force winds of 75 kph (46 mph/40 knots) will continue to affect Torba, Sanma, Penama and Malampa Provinces tonight.”
The Joint Typhoon Warning Center expects Oma to continue to move away from Vanuatu in a southwesterly direction.
Feb. 13, 2019 – NASA Finds Tropical Cyclone Gelena in the Middle of the Southern Indian Ocean
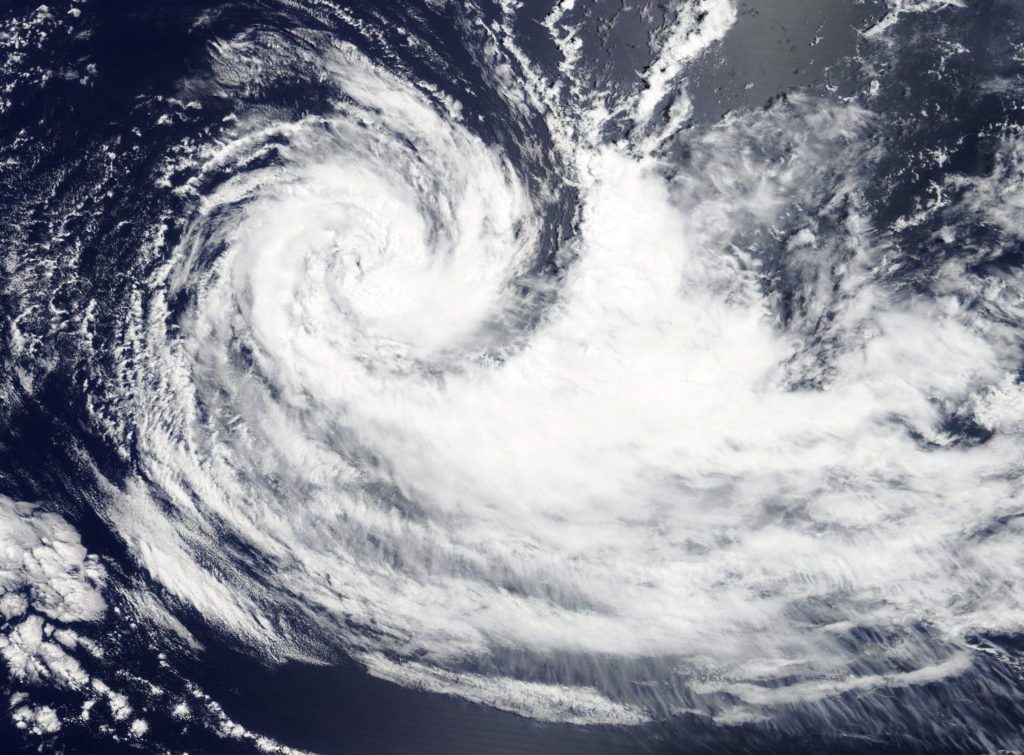
Visible imagery from NASA’s Terra satellite showed a weaker Tropical Storm Gelena far from land areas, and in the middle of the Southern Indian Ocean.
On Feb. 13, 2019 the MODIS instrument aboard NASA’s Terra satellite provided a visible image of Tropical Cyclone Gelena in the Southern Indian Ocean that showed bands of thunderstorms spiraling into the center. Credit: NASA Worldview, EARTH Observing System Data and Information System (EOSDIS).
On Feb. 13, the Moderate Resolution Imaging Spectroradiometer or MODIS instrument aboard NASA’s Terra satellite provided a visible image of Gelena. The image showed bands of thunderstorms spiraling into a cloud-filled, but defined low level circulation with the bulk of its associated convection and clouds pushed eastward from westerly winds.
At 10 a.m. EDT (1500 UTC) on Feb. 13, the Joint Typhoon Warning Center or JTWC noted that Oma had maximum sustained winds near 55 knots (63 mph/102 kph). It was centered near 26.0 degrees north latitude and 79.2 degrees east longitude. That’s 1,193 nautical miles east-southeast of Port Louis, Mauritius. Omi was moving east-southeast.
JTWC has forecast Gelena to continue moving southeastward and weakening to dissipation in two days.
Feb. 13, 2019 – Tropical Cyclone Oma Threatens Vanuatu, Seen by NASA-NOAA’s Suomi NPP Satellite
Tropical Cyclone Oma continued to move southeast in the Southern Pacific Ocean, and continue affecting Vanuatu. NASA-NOAA’s Suomi NPP satellite provided a visible image of the storm.
NASA-NOAA’s Suomi NPP satellite passed over the Southern Pacific Ocean and captured a visible image of Tropical Cyclone Oma on Feb. 13 as it approached Vanuatu. Credit: NASA Worldview, EARTH Observing System Data and Information System (EOSDIS).
Suomi NPP passed over Oma on Feb. 13 and the Visible Infrared Imaging Radiometer Suite (VIIRS) instrument provided a visible image of the storm. The VIIRS image showed a circular center of thunderstorms with a large, wide band of thunderstorms wrapping into the center from the northwest. That’s because the storm is experiencing easterly winds that are pushing clouds west and away from the center. The image also showed the southeastern quadrant already over Espiritu Santu, Vanuatu.
The Joint Typhoon Warning Center (JTWC) noted on Feb. 13 at 4 a.m. EDT (0900 UTC) that Oma was near 14.6 degrees south latitude and 165.2 east longitude, about 262 nautical miles northwest of Port Vila, Vanuatu. Maximum sustained winds were near 45 knots (52 mph/83 kph). Oma was moving to the west-southwest.
On Feb. 13, Tropical Cyclone Warning Number 9 was issued by the Vanuatu Meteorology and Geo-Hazards Department (VMGD), in Port Vila, Vanuatu for Torba, Sanma and Malampa provinces. Gale force winds are expected to affect those provinces today, Feb. 13. VMGD’s warning noted “Heavy rainfalls and flash flooding over low lying areas and areas close to the river banks, including coastal flooding will continue to affect Torba, Sanma and Malampa provinces tonight. Seas will be very rough to phenomenal with heavy and phenomenal swells expected.”
Forecasters at the Joint Typhoon Warning Center noted that Oma is expected to strengthen over the next day as it begins curving to the south. By February 15, as Oma takes more of a southwesterly turn and heads away from Vanuatu and toward northern New Caledonia, increasing wind shear and movement over cooler waters will weaken the storm.
Feb. 12, 2019 – NASA’s Aqua Satellite Catches Development of Tropical Cyclone Oma
NASA’s Aqua satellite passed over the Southern Pacific Ocean and captured a visible image of Tropical Cyclone Oma. Oma formed northwest of Vanuatu.
On Feb. 12 at 0305 UTC (Feb 11 at 10:05 p.m. EDT) the MODIS instrument aboard NASA’s Aqua satellite captured a visible image of newly formed Tropical Cyclone Oma in the Southern Pacific Ocean. Oma was located northwest of Vanuatu. Credit: NASA/NRL
On Feb. 12 at 0305 UTC (Feb 11 at 10:05 p.m. EDT) the Moderate Resolution Imaging Spectroradiometer or MODIS instrument aboard NASA’s Aqua satellite provided a visible image of Tropical Cyclone Oma. Satellite imagery showed Oma’s center between the Solomon Islands to the northwest and Vanuatu to the southeast. The bulk of Oma’s clouds were west of the center of circulation.
At 10 a.m. EDT (1500 UTC) the center of Oma was located near latitude 13.8 degrees south and longitude 165.6 degrees east. That’s about 289 nautical miles northwest of Port Vila, Vanuatu. Oma was moving to the east. Maximum sustained winds were near 45 knots (52 mph/83 kph) and Oma is forecast to strengthen slightly over the next two days before weakening.
The Vanuatu Meteorology & Geo-Hazard Department (VMGD) noted “Damaging gale force winds of 75 kph (40 knots) are expected to affect Torba and Sanma today and for the next 12 to 24 hours.” In addition damaging gale force winds and very rough seas with heavy swells will affect Torba and Sanma. VMGD also noted “Heavy rainfall and flash flooding over low lying areas and areas close to river banks, including coastal flooding will continue to affect these provinces. The marine strong wind warning and a high seas warning is current for northern and central waters.”
For updated forecasts from the Vanuatu Meteorology & Geo-Hazard Department, visit: https://www.vmgd.gov.vu/
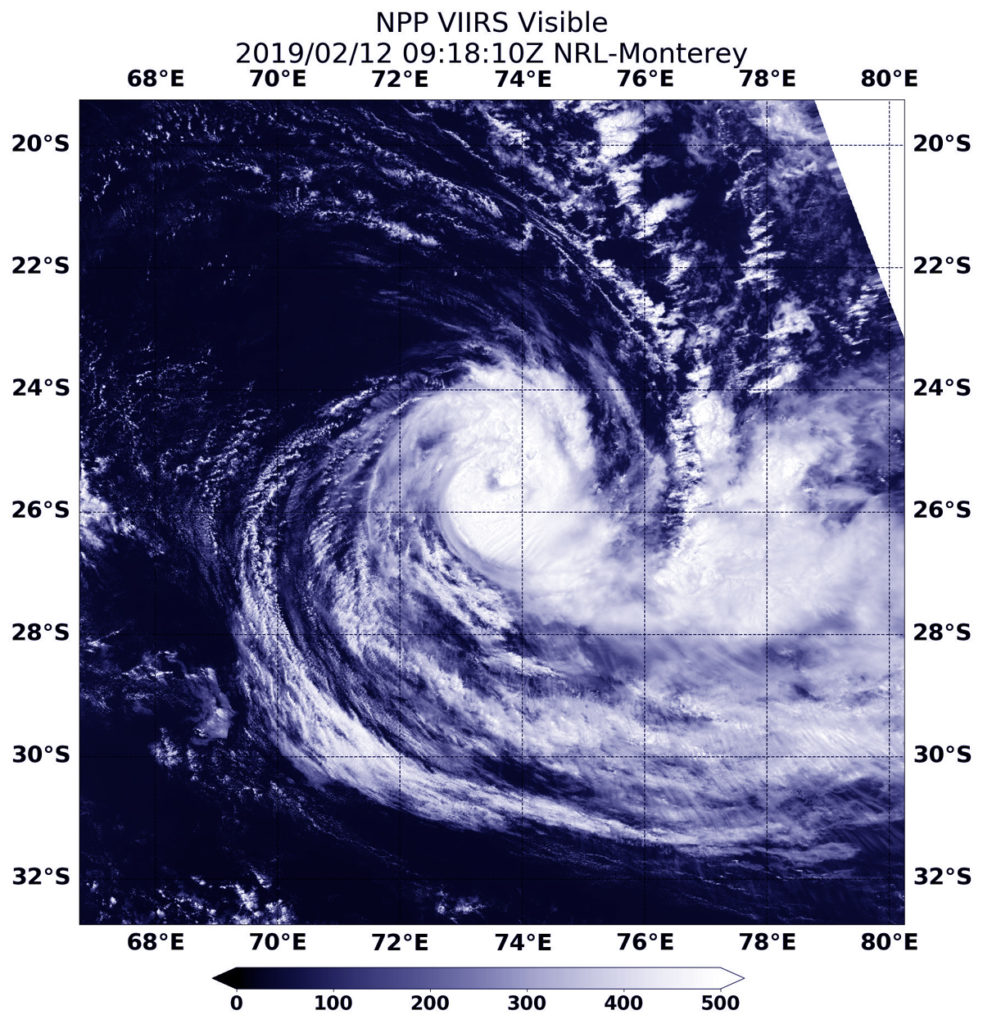
Wind shear can push tropical cyclones apart and satellite imagery from NASA-NOAA’s Suomi NPP satellite revealed that is what is happening to Tropical Cyclone Gelena in the Southern Indian Ocean.
On Feb. 12 at 4:18 a.m. EDT (0918 UTC) the VIIRS instrument aboard NASA-NOAA’s Suomi NPP satellite captured a visible image of Tropical Cyclone Gelena moving through the Southern Indian Ocean. Credit: NASA/NOAA/NRL
In general, wind shear is a measure of how the speed and direction of winds change with altitude. Winds at different levels of the atmosphere pushed against the cylindrical circulation center and skewed it, weakening the rotation.
On Feb. 12 at 4:18 a.m. EDT (0918 UTC) the Visible Infrared Imaging Radiometer Suite (VIIRS) instrument aboard NASA-NOAA’s Suomi NPP satellite captured a visible image of Tropical Cyclone Gelena moving through the Southern Indian Ocean. The Joint Typhoon Warning Center noted that: “Animated multispectral satellite imagery shows a system with a mostly exposed low level circulation and its associated convection sheared eastward.” The clouds are being pushed eastward by strong westerly winds.
On Feb. 12 at 10 a.m. EDT (1500 UTC) Gelena’s maximum sustained winds were near 50 knots (57 mph/92 kph) and weakening. Gelena was located approximately 961 nautical miles east-southeast of Port Louis, Mauritius. The tropical storm is moving to the east-southeast. Because Gelena is expected to move over cooler sea surface temperatures and the wind shear is expected to persist, the storm is forecast to dissipate in two days.
Feb. 11, 2019 – NASA Catches the 1-Day Life of Tropical Cyclone Neil
Tropical Cyclone Neil had a short life in the Southwestern Pacific Ocean. It developed on February 9 and dissipated on February 10. NASA’s Aqua satellite captured an image of the storm that developed even while battling wind shear.
This visible image of short-lived Tropical Cyclone Neil was taken from NASA’s Aqua satellite on Feb. 9. The image shows that northwesterly vertical wind shear was affecting the storm and pushing the bulk of clouds to the southeastern quadrant. Credit: NASA Worldview, Earth Observing System Data and Information System (EOSDIS)
Neil developed around 4 p.m. EDT (2100 UTC) on February 9 about 302 nautical miles west-southwest of Niue with maximum sustained winds near 35 knots (40 mph/65 kph). Niue is a small island nation in the South Pacific Ocean. According to the official website of Niue tourism, Niue is one of the smallest countries and one of the largest raised coral atolls on Earth.
On Feb. 10, Tropical cyclone no longer qualified as a tropical cyclone. At 4 a.m. EDT (0900 UTC) Neil was dissipating near 24.0 degrees south latitude and 173.9 east longitude, about 369 miles southwest of Niue. Neil’s maximum sustained winds had already dropped to 30 knots (34.5 mph/55.5 kph) and continued weakening.
A visible image of short-lived Tropical Cyclone Neil was taken from NASA’s Aqua satellite on Feb. 9. The image showed that northwesterly vertical wind shear was affecting the storm and pushing the bulk of clouds to the southeastern quadrant.
In general, wind shear is a measure of how the speed and direction of winds change with altitude. In order to understand how it affects a tropical cyclone or hurricane, think of a tropical cyclone as a vertical rotating cylinder. The different levels of rotating winds in the center of Tropical cyclones need to be stacked on top each other for the storm to strengthen. If there are outside winds pushing against the cylinder near the top, it affects the balance of the entire cylinder and that’s what happens when vertical wind shear pushes against a storm. It pushes the center and weakens (or wobbles) the rotation of the entire cylinder (storm).
On Feb. 9, the Joint Typhoon Warning Center noted that the final warning was issued on Neil .