Sep. 14, 2018 – NASA-NOAA Satellite Finds Winds Tearing Tropical Depression Isaac Apart
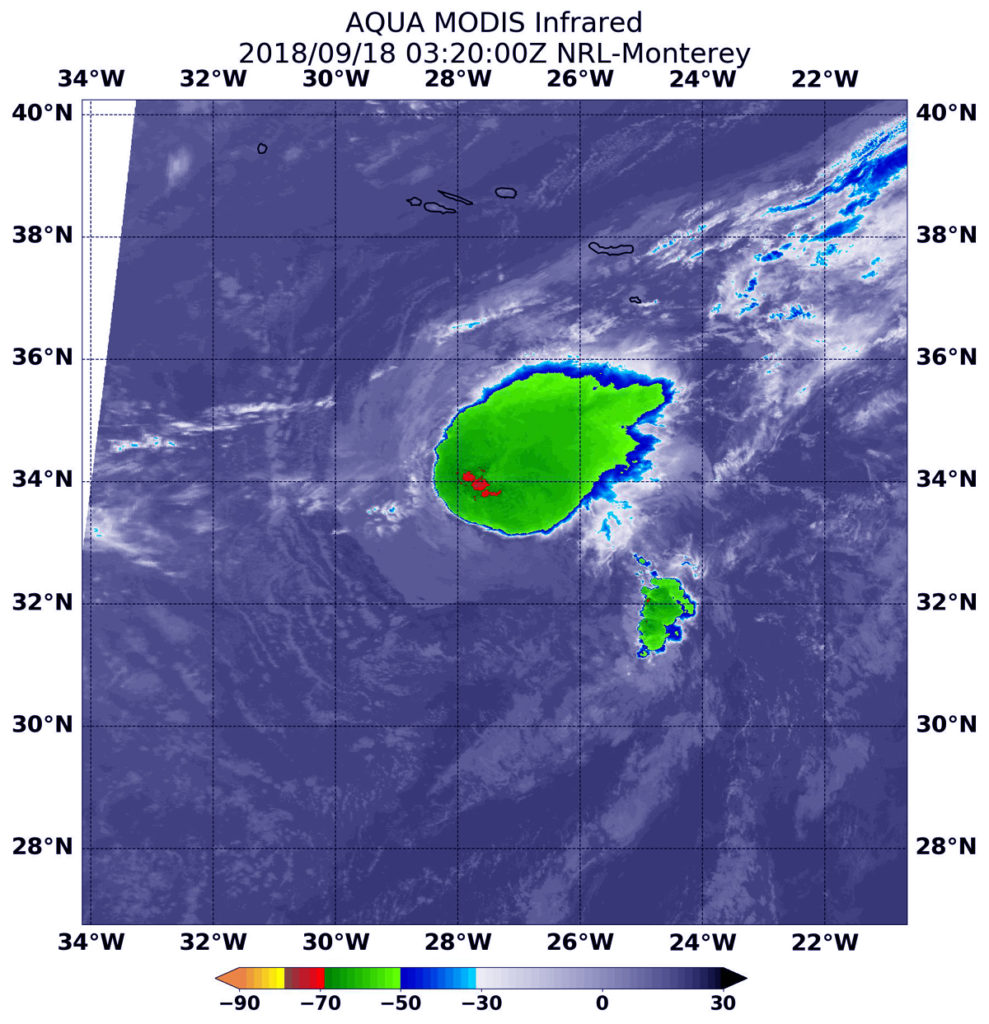
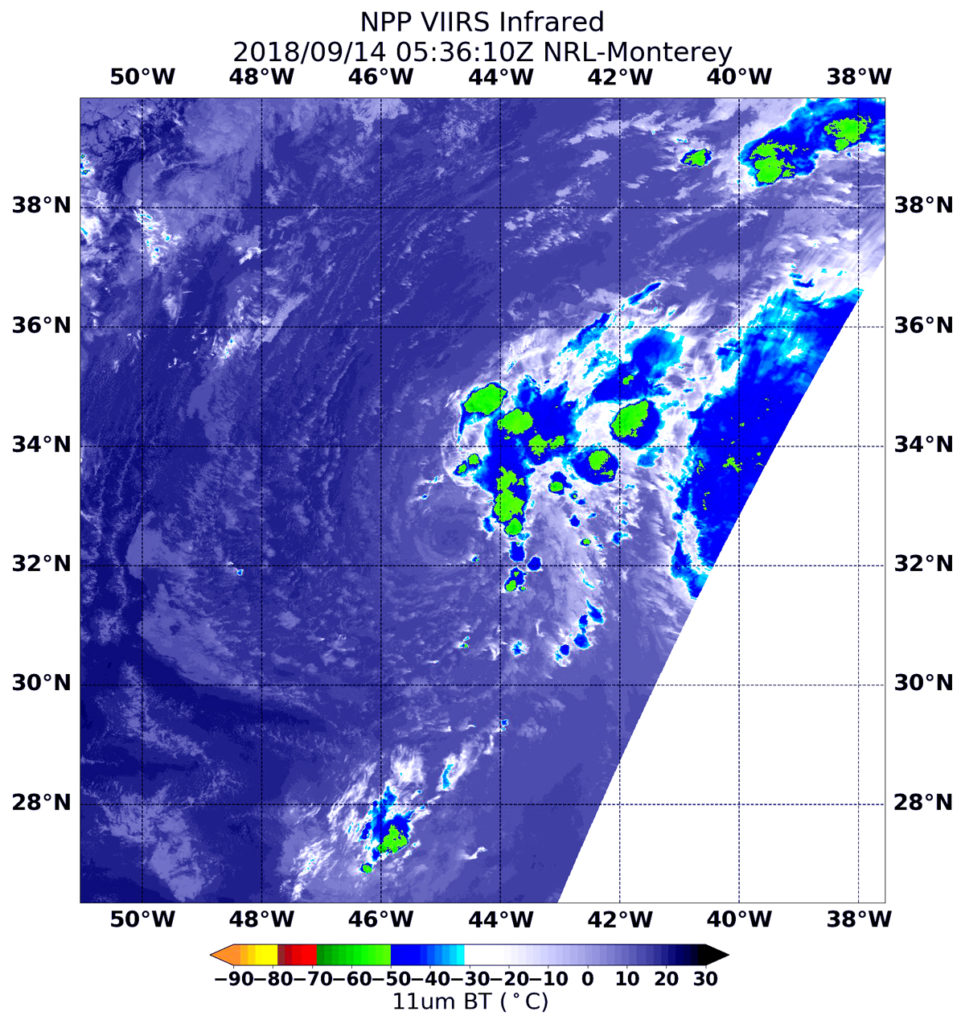
NASA-NOAA’s Suomi NPP satellite passed over tropical cyclone Isaac in the eastern Caribbean Sea and it has weakened to a depression as a result of being hammered by vertical wind shear.

Northwesterly shear continues to take a toll on Isaac. In general, wind shear is a measure of how the speed and direction of winds change with altitude. Winds at different levels of the atmosphere pushed against the cylindrical circulation center and skewed it, weakening the rotation.
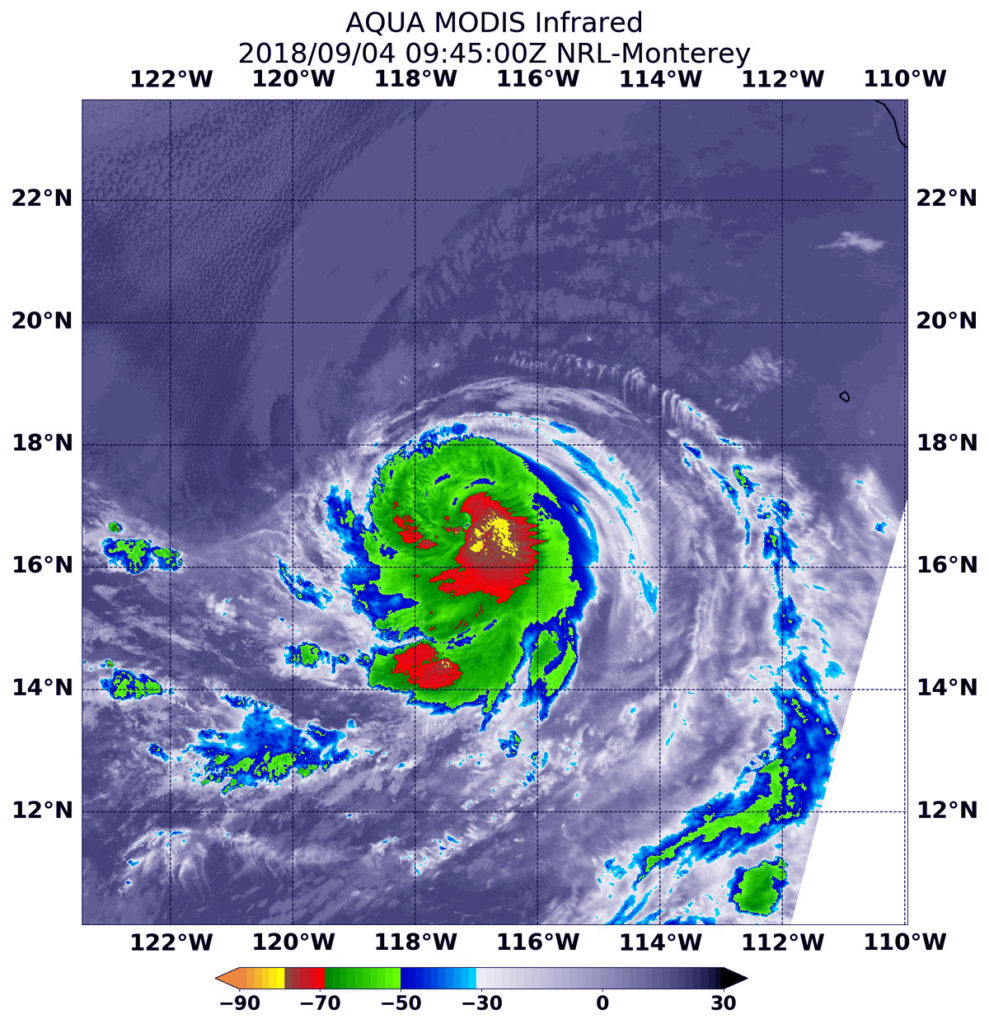
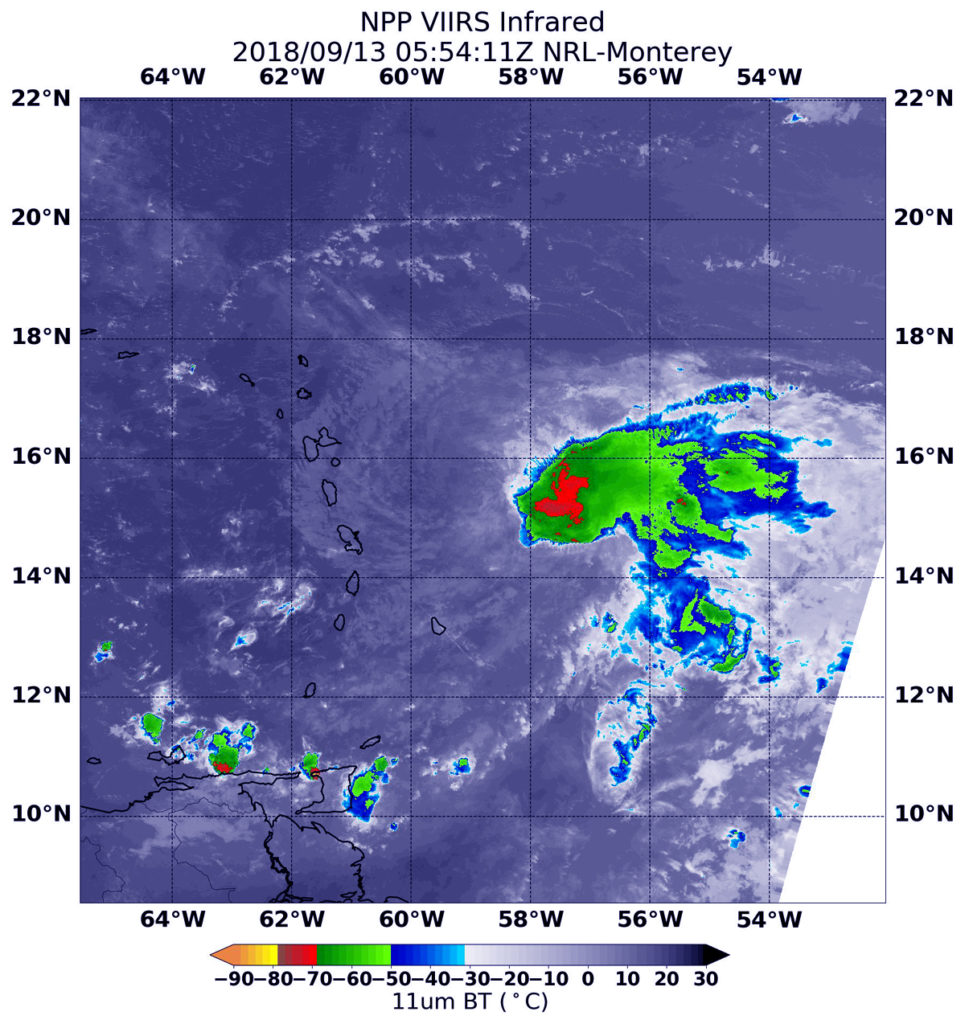
On Sept. 14 at 1:36 a.m. EDT (0536 UTC) the Visible Infrared Imaging Radiometer Suite (VIIRS) instrument aboard NASA-NOAA’s Suomi NPP satellite captured an infrared image of Tropical Depression Isaac in the eastern Caribbean Sea. VIIRS showed wind shear was tearing the storm apart. The coldest cloud top temperatures of strongest thunderstorms were as cold as minus 70 degrees Fahrenheit/minus 56.6 degrees Celsius and were limited to one area of the storm.
The National Hurricane Center or NHC said “Although the system is still producing areas of deep convection, [satellite imagery] indicated that the circulation had become even less defined.
Moderate to strong northwesterly shear and dry mid-level air are likely to cause additional weakening, and Isaac is forecast to degenerate into an open wave within the next several days, but this could occur much sooner if the current trends continue.”
At 5 a.m. EDT (0900 UTC), the center of Tropical Depression Isaac was located near latitude 15.0 degrees north and longitude 65.5 degrees west. That’s about 190 miles (310 km) south-southwest of St. Croix. The depression is moving toward the west near 15 mph (24 kph), and this general motion with some decrease in forward speed is expected over the next few days. Maximum sustained winds have decreased to near 35 mph (55 kph) with higher gusts. Isaac is forecast to gradually weaken over the next few days, and could degenerate into a tropical wave at any time.
On the forecast track, Isaac will move over the eastern and central Caribbean Sea during the next few days.
For updated forecasts, visit: www.nhc.noaa.gov
By Rob Gutro (with information from NHC)
NASA’s Goddard Space Flight Center
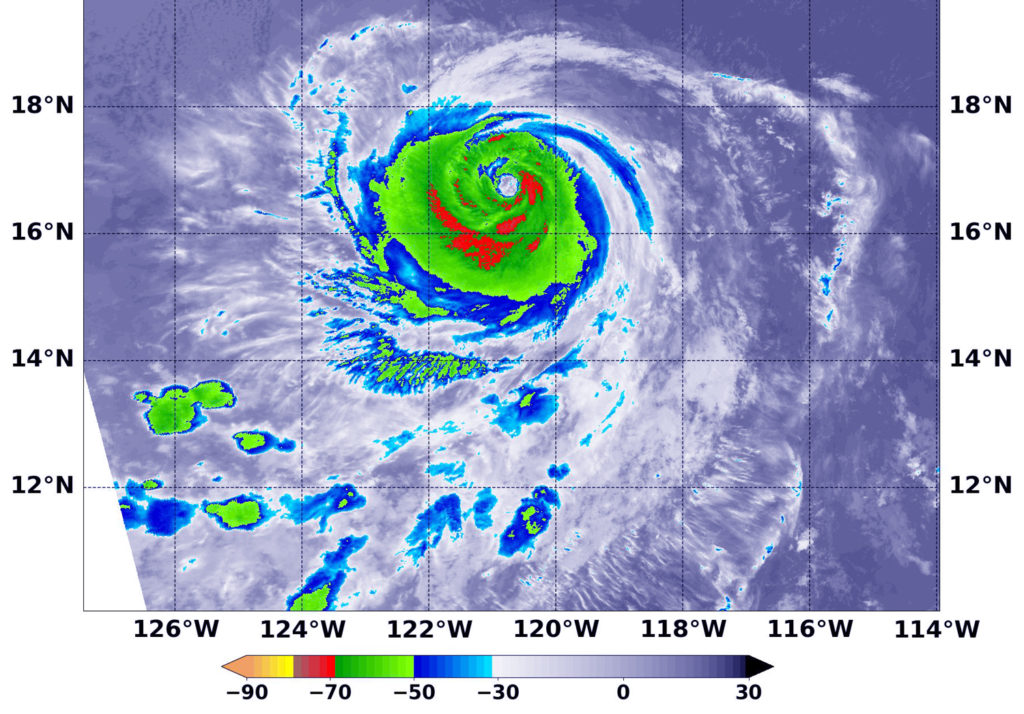
Sep. 13, 2018 – NASA-NOAA Satellite Finds Wind Shear Pushing on Tropical Storm Isaac’s Center
Wind shear seems to be affecting several storms in the Atlantic Ocean today, Sept. 13, 2018. Wind shear is affecting Hurricane Helene in the Eastern Atlantic and in the Western Atlantic, Hurricane Florence and even Tropical Storm Isaac are feeling its effects.
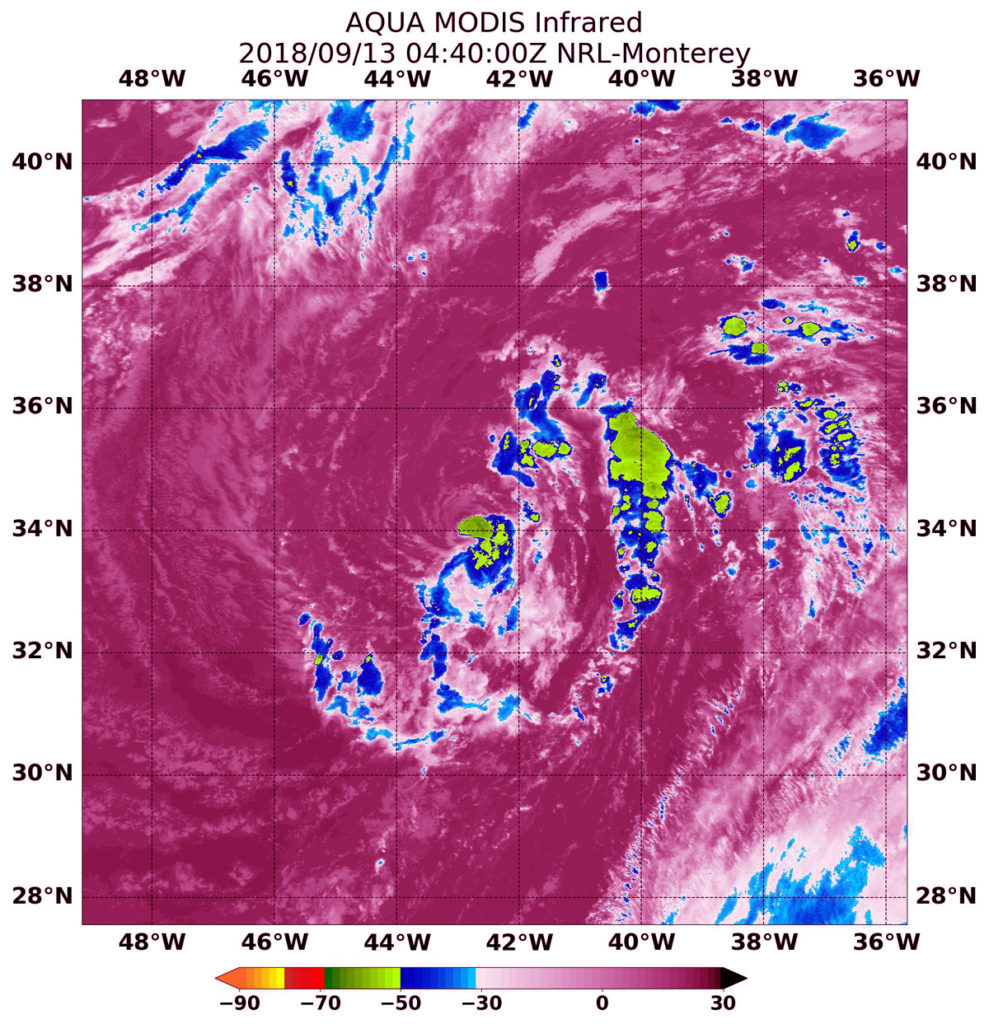
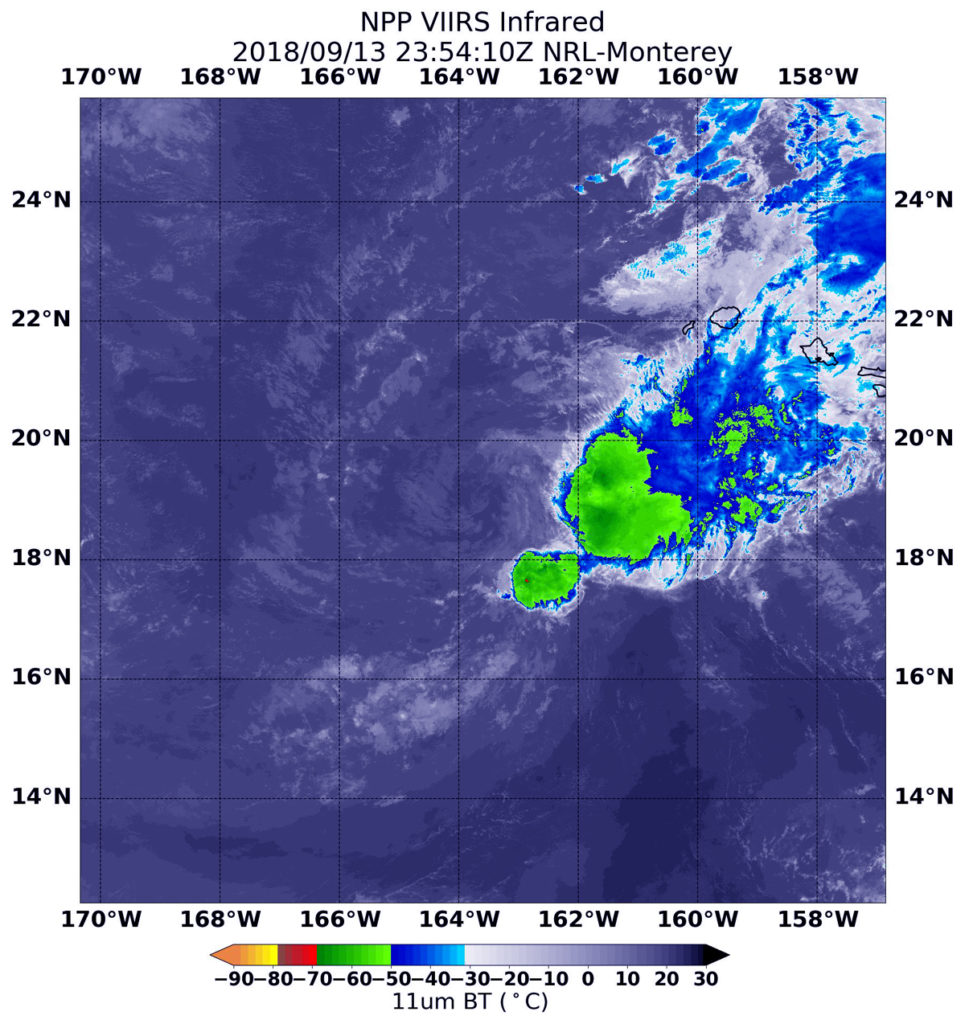
NASA-NOAA’s Suomi NPP satellite provided an infrared look at Tropical Storm Isaac that revealed its circulation center was displaced from the bulk of clouds and precipitation. That’s an indication that wind shear is affecting the storm.
What is Vertical Wind Shear?
In general, wind shear is a measure of how the speed and direction of winds change with altitude. In order to understand how it affects a tropical cyclone or hurricane, think of a tropical cyclone as a series of vertically stacked tires, all rotating. As you go up from the ground, each tire represents the rotation of the storm’s center at a higher level in the atmosphere. The different levels of rotating winds in the center of tropical cyclones need to be stacked on top each other to strengthen. If there are winds higher up that push some of the tires askew near the top, it affects the balance and rotation of the tires below. That’s what happens when vertical wind shear pushes against a storm. It pushes the center and weakens (or wobbles) the rotation of all of the tires.
The Satellite Data Reveal
The National Hurricane Center or NHC noted “Satellite imagery indicate that Isaac remains a poorly organized tropical cyclone, with the low-level center mostly exposed during the early morning hours.” Isaac is being battered by strong vertical wind shear.
At 1:54 a.m. EDT (0554 UTC) on Sept. 13, the Visible Infrared Imaging Radiometer Suite (VIIRS) instrument aboard NASA-NOAA’s Suomi NPP satellite analyzed Tropical Storm Isaac in infrared light. VIIRS found a small area of coldest cloud top temperatures off-center were as cold as or colder than minus 70 degrees Fahrenheit (minus 56.6 degrees Celsius).
NASA research has found that cloud top temperatures as cold as or colder than the 70F/56.6C threshold have the capability to generate heavy rainfall.
At 8 a.m. EDT (1200 UTC) radiosonde data from the eastern Caribbean and NOAA Hurricane Hunter aircraft data indicate that the circulation of Isaac is fairly shallow and small. It is entirely possible that Isaac will degenerate into a tropical wave during the next day or two due to the continued effects of strong wind shear.
Warnings and Watches on Sept. 13
A Tropical Storm Warning is in effect for Martinique, Dominica and Guadeloupe. Tropical Storm Watch is in effect for Antigua, Barbuda, Montserrat, St. Kitts and Nevis, Saba and St. Eustatius, St. Martin and St. Maarten.
Isaac’s Stats on September 13, 2018
At 8 a.m. EDT (1200 UTC), the center of Tropical Storm Isaac was located near latitude 15.2 degrees north and longitude 60.9 degrees west. Isaac is moving faster toward the west near 21 mph (33 km/h). This general motion is forecast to continue today with a decrease in forward speed over the Caribbean Sea. Maximum sustained winds remain near 45 mph (75 kph) with higher gusts. Little change in strength is expected over the next several hours as Isaac moves through the Leeward Islands. Gradual weakening is forecast after that as Isaac moves through the eastern Caribbean.
Rainfall Anticipated in Leeward and Windward Islands
NHC said Tropical Storm Isaac is expected to produce total rainfall accumulations of 2 to 4 inches with isolated amounts up to 6 inches across Martinique, Dominica, and Guadeloupe, especially over elevated terrain. Rainfall of 0.5 to 1.5 inches with isolated amounts to 3 inches are forecast across Puerto Rico and the southern United States Virgin Islands, with up to an inch anticipated across the remaining Windward and Leeward Islands. This rainfall may cause dangerous flash flooding.
Isaac’s Forecast Path
NHC said on the forecast track, Isaac should move across the central Lesser Antilles and into the eastern Caribbean Sea later today, and then move across the eastern and central Caribbean Sea through the weekend.
For updated forecasts, visit: www.nhc.noaa.gov
By Rob Gutro
NASA Goddard Space Flight Center
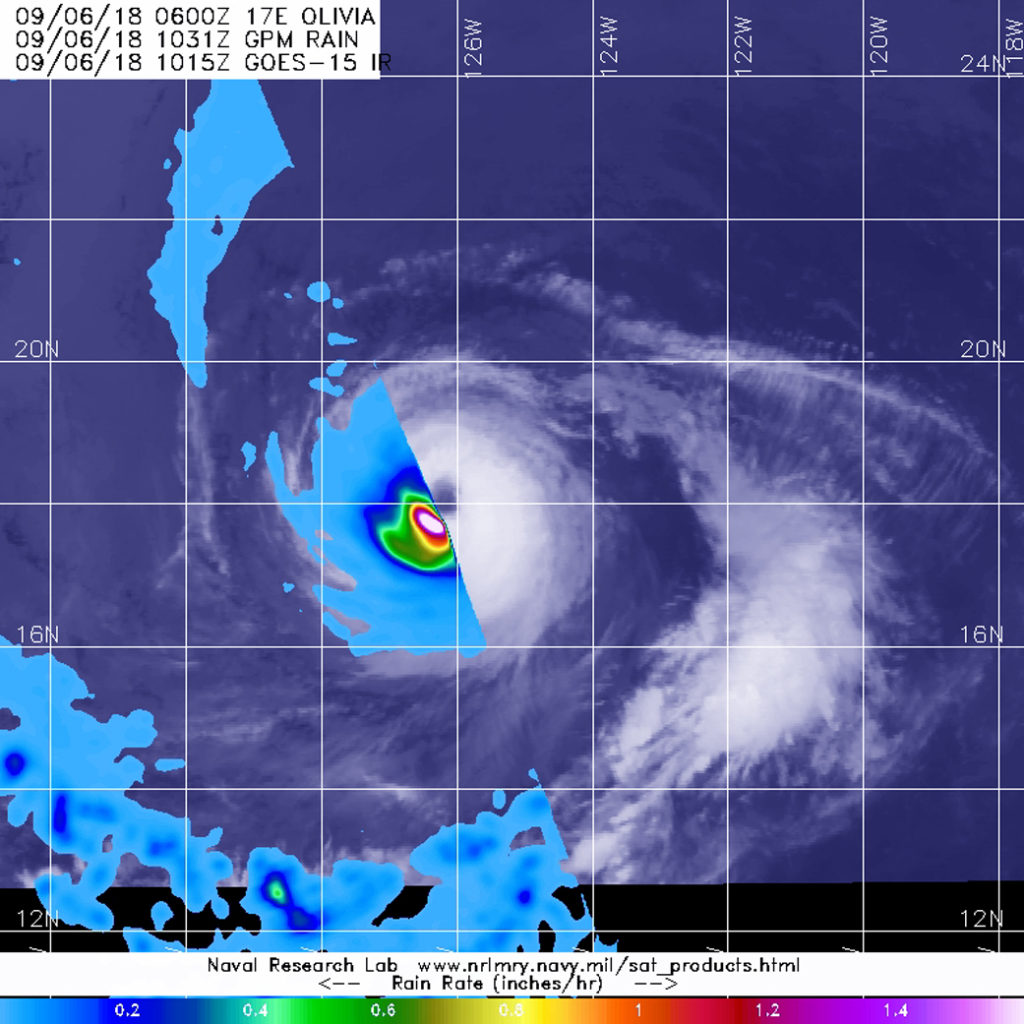
Sep. 12, 2018 – NASA/JAXA Satellite Finds Heavy Rainfall in Tropical Storm Isaac
Tropical Cyclones generate a lot of rainfall and the Global Precipitation Measurement mission or GPM satellite and constellation of satellites gather that data and share it with forecasters. GPM recently passed over Tropical Storm Isaac and analyzed its rainfall.
That rainfall is expected to affect the warning areas. The National Hurricane Center posted A Tropical Storm Warning is in effect for Martinique, Dominica and Guadeloupe. A Tropical Storm Watch is in effect for Antigua, Montserrat, St. Kitts and Nevis, and Saba and St. Eustatius.
GPM is an example of NASA’s partnerships with other agencies around the world. GPM is a joint mission between NASA and the Japan Aerospace Exploration Agency or JAXA and the GPM core observatory satellite had an excellent view of tropical storm Isaac on Sept. 11, 2018 at 11:53 p.m. EDT (Sept. 12, 2018 at 0353 UTC).

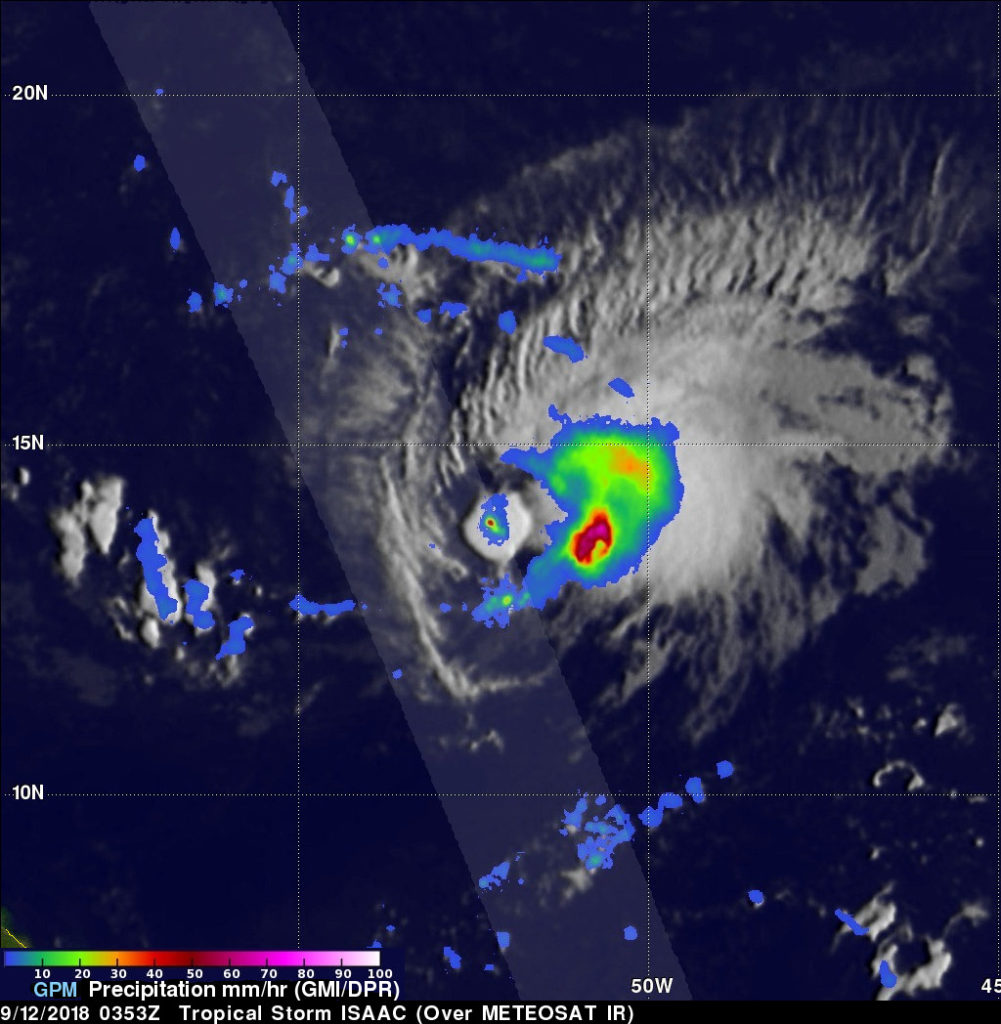
The satellite revealed that, although expected to weaken, Isaac still contained some powerful convective storms. The GPM satellite’s Microwave Imager (GMI) and Dual-Frequency Precipitation Radar (DPR) instruments collected data that were used in an analysis of Isaac’s rainfall. Those data showed that the heaviest rainfall within the tropical storm was located to the southeast of Isaac’s center of circulation. GPM’s radar (DPR Ku Band) measured rain falling at a rate of over 140 mm (5.5 inches) per hour when it sliced through an isolated convective burst southwest of Isaac’s center.
GPM’s radar (DPR ku Band) data were used in at NASA’s Goddard Space Flight Center in Greenbelt, Md. to create a 3D view from the north-northeast to show the 3D structure of precipitation within the convective burst southwest of ISAAC’s center of circulation. DPR found that heavy downpours there. Storm tops were found by GPM’s radar to reach heights above 16.2 km (10.0 km) in this area of convection.
At 11 a.m. (1500 UTC), the center of Tropical Storm Isaac was located by a NOAA Hurricane Hunter aircraft near latitude 15.0 degrees north and longitude 54.7 degrees west. Isaac is moving toward the west near 17 mph (28 kph), and this general motion with some decrease in forward is expected to continue through the weekend. Aircraft data indicate that maximum sustained winds remain near 60 mph (95 kph) with higher gusts. Gradual weakening is forecast during the next 72 hours.
On Sept. 11, 2018 at 11:53 p.m. EDT the GPM core observatory satellite found heaviest rainfall within Isaac was located to the southeast of the center. GPM found rain falling at a rate of over 140 mm (5.5 inches) per hour when it sliced through an isolated storm southwest of Isaac’s center. The 3D view showed heavy downpours there. Storm tops were found by GPM’s radar to reach heights above 16.2 km (10.0 km) in this area. Credit: NASA/JAXA, Hal Pierce
Hurricane Florence, tropical storm Isaac and Hurricane Helene are currently active in the Atlantic Ocean.
Tropical storm Isaac is the next tropical cyclone to affect the western Atlantic. It is moving westward toward the Leeward and Windward Islands.
The National Hurricane Center (NHC) predicts that Isaac will pass through the Leeward and Windward Islands and move into the Caribbean Sea over the next few days. The NHC predicts that Isaac will weaken as it encounters moderate vertical shear and nearby dry air.
For updated forecasts, visit: www.nhc.noaa.gov
By Harold F. Pierce / Rob Gutro
NASA’s Goddard Space Flight Center
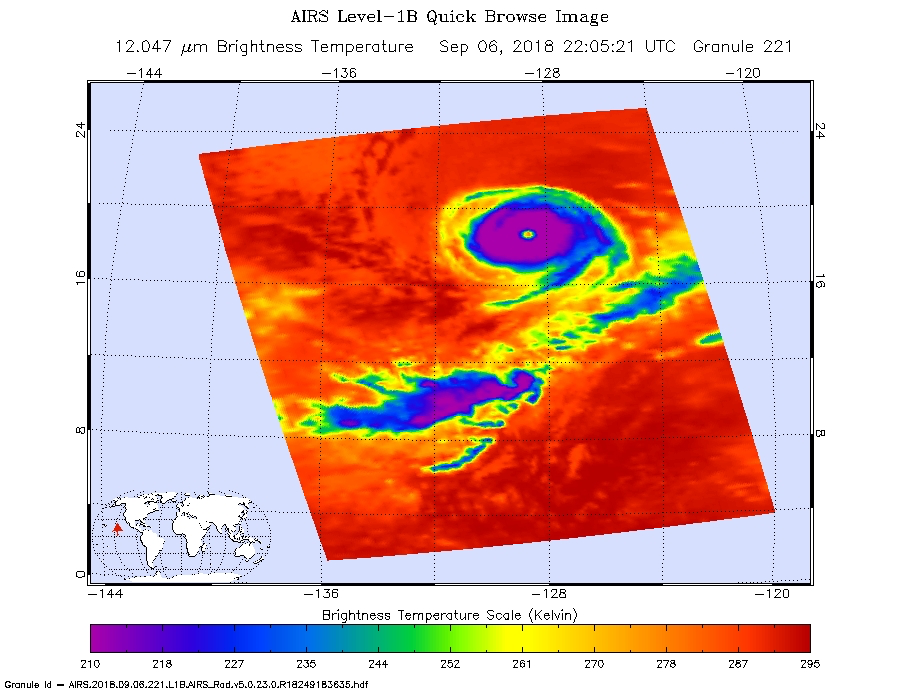
Sep. 11, 2018 – NASA Finds Wind Shear Pushing on Tropical Storm Isaac’s Center
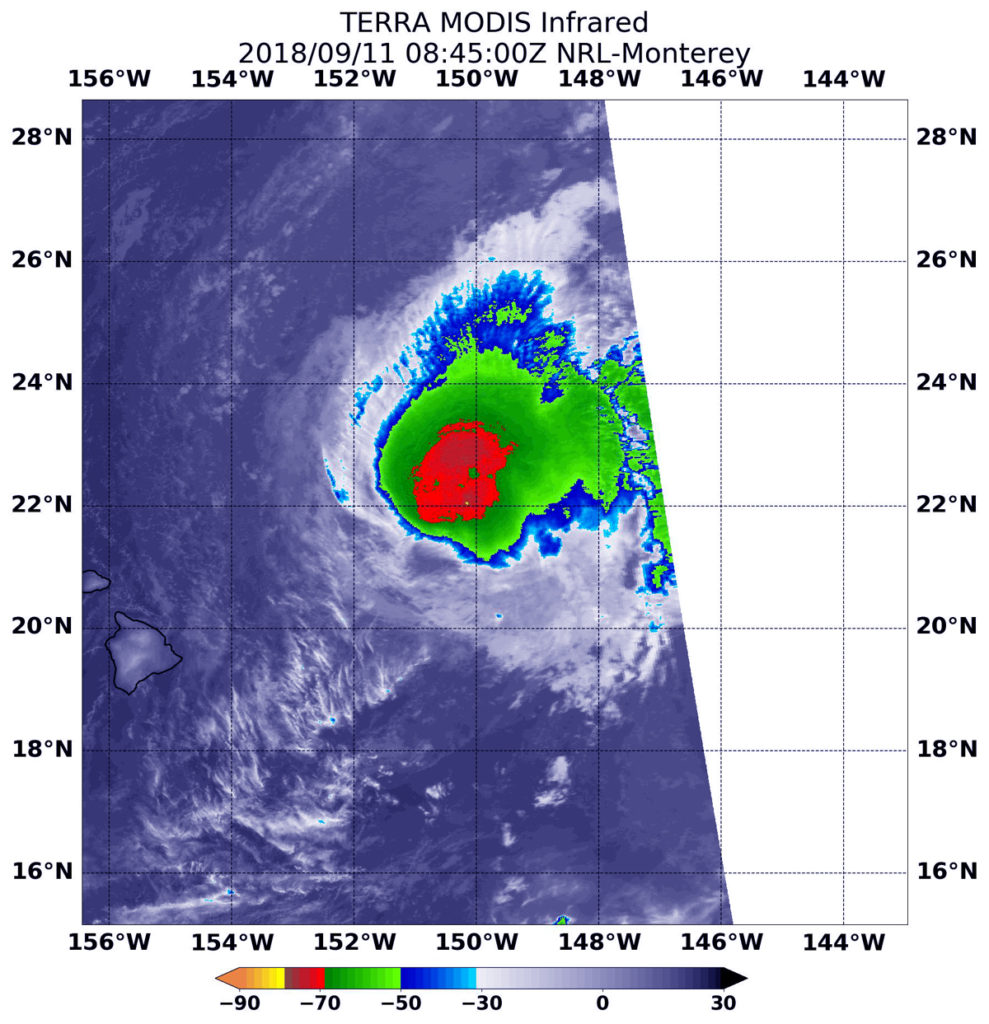
NASA’s Aqua satellite provided an infrared look at Tropical Storm Isaac that revealed its circulation center was displaced from the bulk of clouds and precipitation. That’s an indication that wind shear is affecting the storm.

What is Vertical Wind Shear?
In general, wind shear is a measure of how the speed and direction of winds change with altitude. In order to understand how it affects a tropical cyclone or hurricane, think of a tropical cyclone as a series of vertically stacked tires, all rotating. As you go up from the ground, each tire represents the rotation of the storm’s center at a higher level in the atmosphere. The different levels of rotating winds in the center of Tropical cyclones need to be stacked on top each other to strengthen. If there are winds higher up that push some of the tires askew near the top, it affects the balance and rotation of the tires below. That’s what happens when vertical wind shear pushes against a storm. It pushes the center and weakens (or wobbles) the rotation of all of the tires.
The Satellite Data Reveal
The National Hurricane Center or NHC noted “Satellite images indicate that the strong tropical storm still has a central dense overcast pattern and a limited amount of outer bands [of thunderstorms]. Earlier microwave data indicated that the center was not located in the middle of the convection, however, likely due to some westerly [wind] shear.”
At 2:30 a.m. EDT (0630 UTC) on Sept. 11, the Moderate Resolution Imaging Spectroradiometer or MODIS instrument aboard NASA’s Aqua satellite analyzed Tropical Storm Isaac in infrared light. MODIS found coldest cloud top temperatures off-center were as cold as or colder than minus 80 degrees Fahrenheit (minus 112 degrees Celsius). Those most powerful storms were embedded in strong storms with cloud tops as cold as or colder than minus 70 degrees Fahrenheit (minus 56.6 degrees Celsius).
NASA research has found that cloud top temperatures as cold as or colder than the 70F/56.6C threshold have the capability to generate heavy rainfall.
Isaac’s Stats on September 11, 2018
At 5 a.m. EDT (0900 UTC), the center of Tropical Storm Isaac was located near latitude 14.6 degrees north and longitude 48.1 degrees west. That’s about 880 miles (1,420 km) east of the Lesser Antilles.
Isaac is moving toward the west near 14 mph (22 kph). This general motion is expected to continue through the end of the week. Maximum sustained winds remain near 70 mph (110 kph) with higher gusts. Little change in strength is forecast during the next few days, but Isaac is forecast to be at or near hurricane strength as it approaches the Lesser Antilles.
Rainfall Anticipated in Leeward and Windward Islands
NHC said that Isaac is expected to produce total rainfall accumulations of 2 to 4 inches with isolated amounts near 6 inches across the Leeward Islands late this week, with 1 to 2 inches anticipated across the Windward Islands.
Isaac’s Forecast Path
On the forecast track, Isaac should move across the Lesser Antilles and into the eastern Caribbean Sea on Thursday.
For updated forecasts, visit: www.nhc.noaa.gov
By Rob Gutro
NASA’ Goddard Space Flight Center
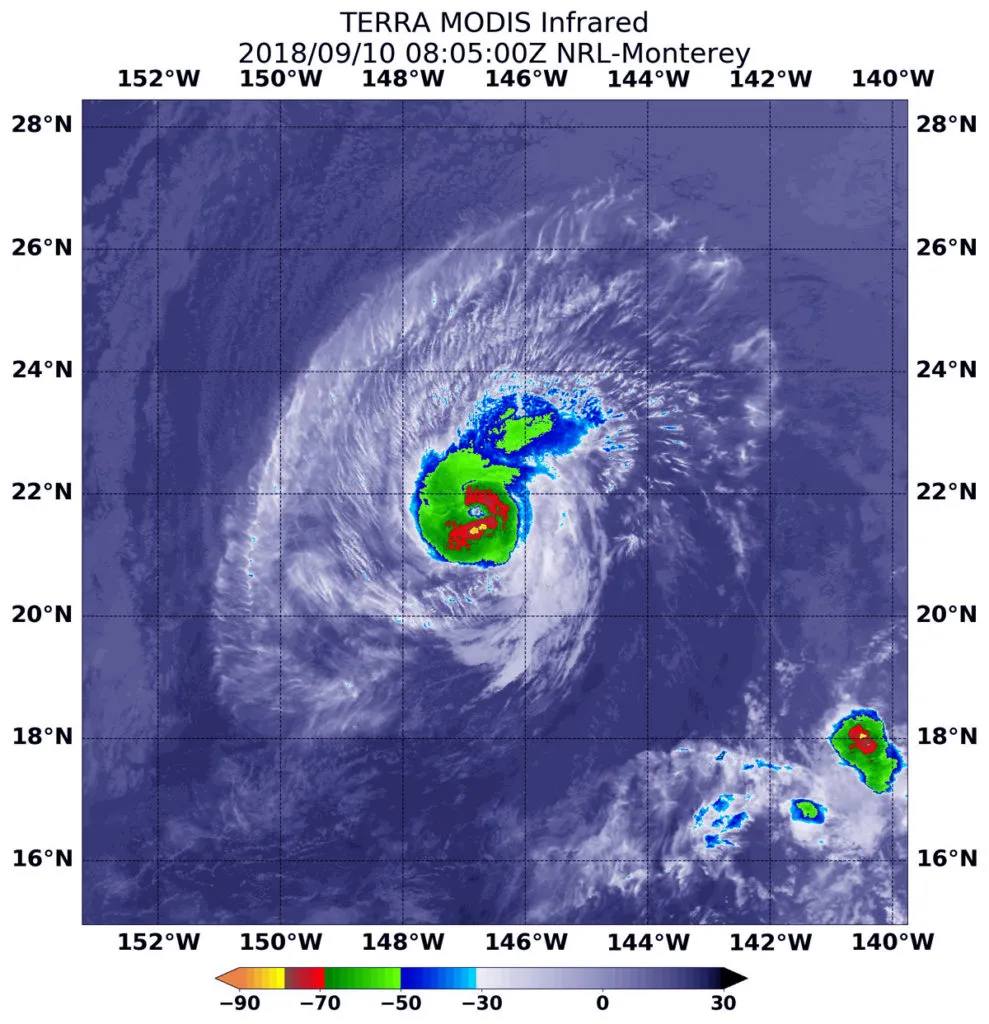
Sep. 10, 2018 – NASA Covers Hurricane Isaac’s Ragged Center
NASA’s Aqua satellite found a thick ring of powerful storms around Hurricane Isaac’s ragged eye and southwest of center on Sept. 10.
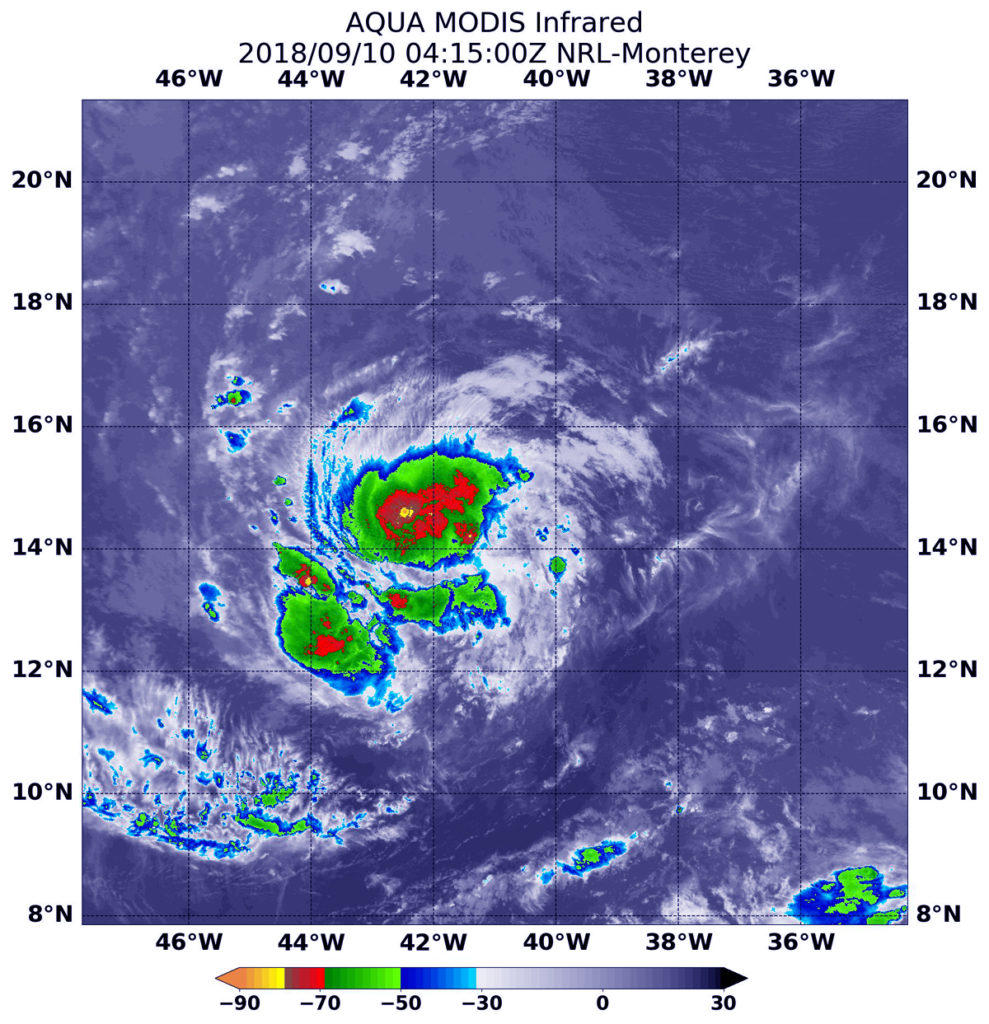
Infrared satellite data at 12:15 a.m. EDT (0415 UTC) on Sept. 10 from the Moderate Resolution Imaging Spectroradiometer or MODIS instrument aboard NASA’s Aqua satellite revealed powerful storms circling Isaac’s center and in fragmented bands southwest of the center. In those areas, MODIS found coldest cloud tops had temperatures near minus 70 degrees Fahrenheit (minus 56.6 degrees Celsius). NASA research has found that cloud top temperatures that cold have the capability to generate heavy rainfall.
The National Hurricane Center observed “Isaac’s cloud pattern is currently a bit ragged-looking, with an irregular central dense overcast and limited convective banding [of thunderstorms].”
At 11 a.m. EDT (1500 UTC), the National Hurricane Center or NHC noted the center of Hurricane Isaac was located near latitude 14.7 North, longitude 43.9 West. That’s about 1,150 miles (1,855 km) east of the Windward Islands. Isaac is moving toward the west near 14 mph (22 kph). A westward motion with a slight increase in forward speed is expected through the end of the week.
Maximum sustained winds are near 75 mph (120 kph) with higher gusts. Additional strengthening is expected over the next day or two. Weakening is forecast to begin by the middle of the week as Isaac approaches the Lesser Antilles.
On the forecast track, Isaac should move across the Lesser Antilles and into the eastern Caribbean Sea on Thursday.
For updates on Isaac, visit: www.nhc.noaa.gov