Alvin (Eastern Pacific Ocean)

June 28, 2019 – NASA Satellite Takes Tropical Storm Alvin’s Temperature    

Cloud top temperatures are an indication of strength of tropical cyclones. The colder the cloud tops, the higher they extend in the troposphere, and colder temperatures typically indicate stronger storms. NASA’s Aqua satellite peered into Tropical Storm Alvin with infrared light to determine if the storm was intensifying.
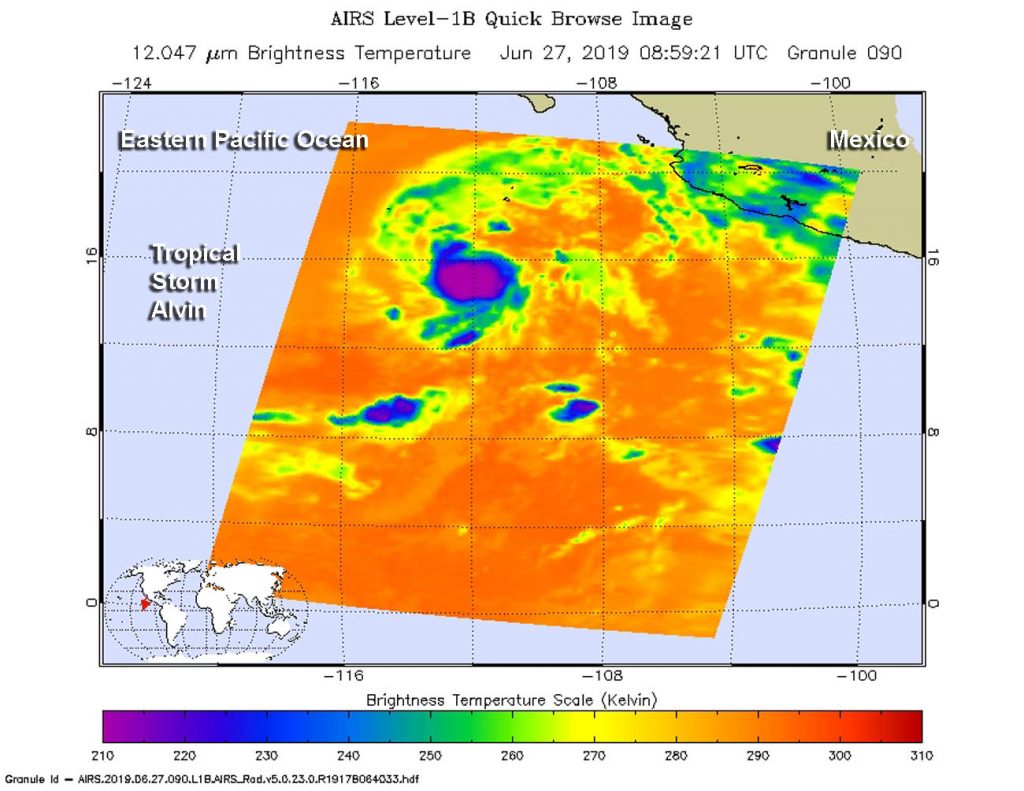
NASA’s Aqua satellite provided an infrared picture of Tropical Storm Alvin’s cloud top temperatures on June 27 at 4:59 a.m. EDT (0859 UTC). Strongest storms with coldest cloud tops appear in purple and have temperatures as cold as or colder than minus 63 Fahrenheit (minus 53 Celsius). Credit: NASA JPL, Heidar Thrastarson

The Atmospheric Infrared Sounder or AIRS instrument aboard NASA’s Aqua satellite passed over Tropical Storm Alvin and analyzed the storm in infrared light. Infrared light provides scientists with temperature data and that is important when trying to understand the strength of the thunderstorms that make up a tropical cyclone. The higher the cloud tops, the colder and the stronger they are. So infrared light as that gathered by the AIRS instrument can identify the strongest sides of a tropical cyclone.

NASA’s Aqua satellite flew over Alvin on June 27 at 4:59 a.m. EDT (0859 UTC). AIRS detected strongest storms around the center with cloud top temperatures as cold as minus 63 degrees Fahrenheit (minus 53 degrees Celsius). Infrared data showed cloud top temperatures were getting colder, indicating stronger uplift of air, pushing those storms higher in the troposphere. Storms with cloud top temperatures that cold have the capability to produce heavy rainfall. The storm intensified over June 27 to early June 28 as winds increased from 60 to 70 mph (97 to 110 kph).

On June 28, NOAA’s National Hurricane Center forecaster Daniel Brown said, “Alvin’s satellite presentation has begun to degrade overnight with the overall cloud pattern becoming elongated from southwest to northeast. Southwesterly shear has caused the system to become less symmetric.”

Current Status of Alvin

At 5 a.m. EDT (0900 UTC) on Friday, June 28, 2019 the center of Tropical Storm Alvin was located near latitude 18.0 degrees north and longitude 116.3 degrees west. That puts the center of Alvin about 535 miles (860 km) southwest of the southern tip of Baja California, Mexico. Maximum sustained winds are near 70 mph (110 kph) with higher gusts.

Alvin is moving toward the northwest near 15 mph (24 kph), and a gradual turn toward the west-northwest with a decrease in forward speed is expected over the next couple of days. Alvin is expected to move into an area of cooler waters and where the southwesterly wind shear is forecast to increase. Those two factors are expected to cause rapid weakening during the next 24 to 36 hours.  Because Alvin is a small cyclone, it is likely to suffer from the effects of the hostile environment more quickly.

The National Hurricane Center expects Alvin to weaken over the next day or two, and Alvin is forecast to become a remnant low on Saturday and should dissipate soon thereafter.

For forecast updates on Tropical Storm Alvin, visit: www.nhc.noaa.gov

More information about AIRS can be found at: http://airs.jpl.nasa.gov

Rob Gutro
NASA’s Goddard Space Flight Center, Greenbelt, Md.

Alvin (Eastern Pacific Ocean)

June 27, 2019 – NASA’s Terra Satellite Eyes Tropical Storm Alvin

Visible imagery from NASA’s Terra satellite showed Tropical Storm Alvin had organized and strengthened into a strong tropical storm, just over 500 miles from Mexico’s Baja California peninsula.

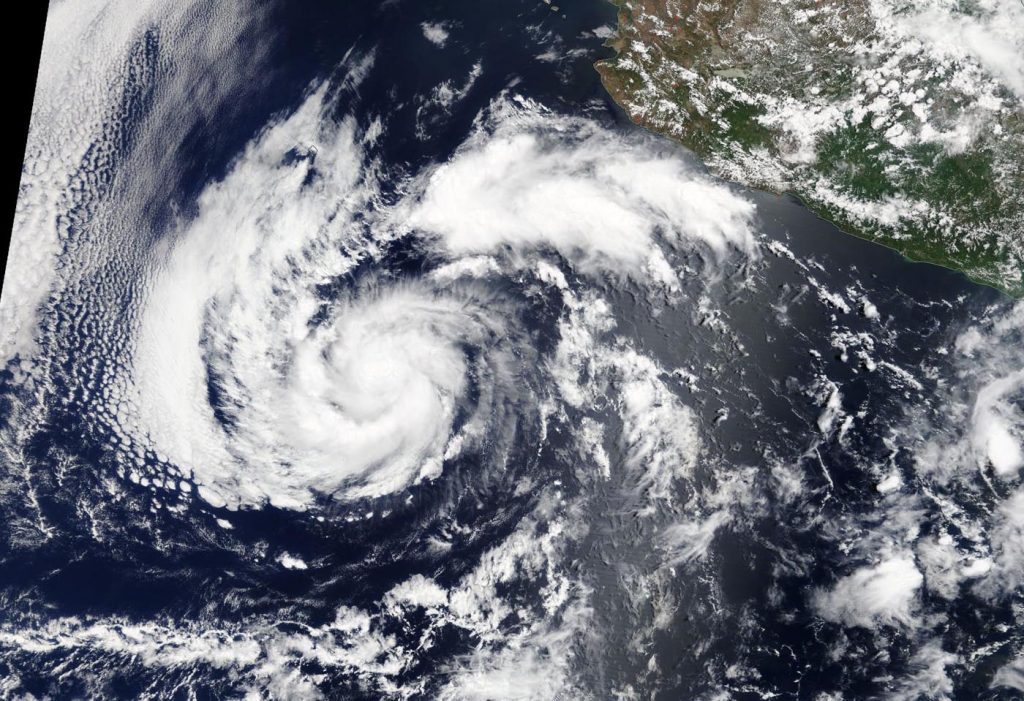
On June 27, the Moderate Resolution Imaging Spectroradiometer or MODIS instrument aboard NASA’s Terra satellite provided a visible image of Alvin. Satellite imagery revealed that Alvin’s clouds appeared more organized than they did the previous day.

satellite image of Alvin
On June 27, 2019, the MODIS instrument aboard NASA’s Terra satellite provided a visible image of Tropical Cyclone Alvin, located over 500 miles west of Baja California, Mexico. Credit: NASA Worldview, Earth Observing System Data and Information System (EOSDIS)

Recent microwave imagery also showed that Alvin’s “convective structure,” or the development and organization of thunderstorms around the low-level center) has improved during the morning of June 27. AT 6:57 a.m. EDT (1057 UTC). The Special Sensor Microwave/Imager (SSM/I) instrument aboard Defense Meteorological Satellite Program satellite showed a closed ring of convection (clouds and storms) around the mid-level center of the small tropical storm. Infrared satellite imagery revealed that Alvin has not changed significantly.

NOAA’s National Hurricane Center (NHC) reported at 11 a.m. EDT (1500 UTC), the center of Tropical Storm Alvin was located near latitude 15.8 degrees north and longitude 113.1 degrees west. That’s about 535 miles (855 km) south-southwest of the southern tip of Baja California.

Maximum sustained winds are near 60 mph (95 kph) with higher gusts. Alvin is moving toward the west-northwest near 14 mph (22 kph), and this general motion is expected to continue for the next day or so. The estimated minimum central pressure is 999 millibars (29.50 inches).

Some strengthening is possible during the next 24 hours before Alvin reaches cooler waters.  Weakening is the expected to begin on Friday and the NHC said Alvin is forecast to become a remnant low on Saturday.

For updated forecasts, visit: www.nhc.noaa.gov

Rob Gutro
NASA’s Goddard Space Flight Center, Greenbelt, Md.
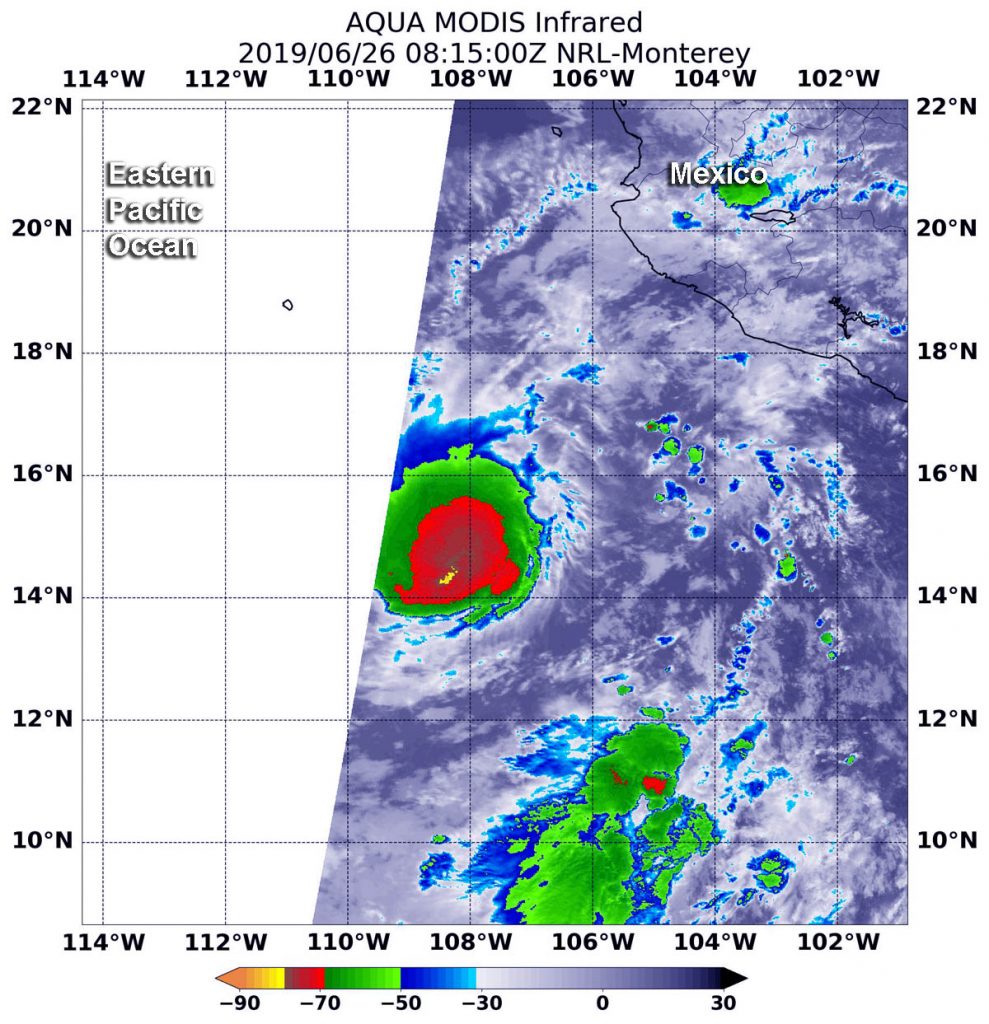
Alvin – Eastern Pacific Ocean

June 26, 2019 – NASA Analyzes Alvin, the First Eastern Pacific Tropical Storm

The Eastern Pacific Ocean has spawned its first tropical storm of the 2019 hurricane season, and NASA’s Aqua satellite measured the cloud top temperatures within to gauge its strength.

infrared image of Alvin
On June 26 at 4:15 a.m. EDT (0815 UTC), NASA’s Aqua satellite revealed cloud top temperatures in strongest storms were near Tropical Storm Alvin’s center of circulation. Those temperatures were as cold as or colder than minus 70 degrees (red) Fahrenheit (minus 56.6 degrees Celsius). Credit: NASA/NRL

Infrared satellite imagery provides temperature data, and when NASA’s Aqua satellite passed over the system it was still a depression, but showing powerful thunderstorm development. Cloud top temperatures determine strength of the thunderstorms that make up a tropical cyclone. The colder the cloud tops, the stronger the uplift in the storms that help thunderstorm development. Infrared data helps determine where the most powerful storms are within a tropical cyclone.

The Moderate Resolution Imaging Spectroradiometer or MODIS instrument aboard Aqua provided that infrared data on June 26 at 4:15 a.m. EDT (0815 UTC). The MODIS data showed the strongest thunderstorms were near the center of circulation. They were as cold as or colder than minus 70 degrees Fahrenheit (minus 56.6 degrees Celsius). NASA research indicates very cold cloud tops with the potential to generate very heavy rainfall.

Tropical Depression One-E strengthened into a tropical storm and named Alvin at 11 a.m. EDT (1500 UTC) on Wednesday, June 26, 2019. At that time, NOAA’s National Hurricane Center noted that the center of Tropical Storm Alvin was located near latitude 14.7 degrees north and longitude 109.4 degrees west. That puts Alvin far from land areas and about 450 miles (725 km) southwest of Manzanillo, Mexico. Alvin is also about 565 miles (915 km) south of the southern tip of Baja California. As a result, there are no coastal watches or warnings in effect.
Alvin is moving toward the west near 14 mph (22 kph) and the NHC expects a westward to west-northwestward motion with some decrease in forward speed over the next few days. Maximum sustained winds have increased to near 40 mph (65 kph) with higher gusts.

Some additional strengthening is forecast during the next day or so. Weakening is forecast to begin on Friday, and Alvin is expected to become a remnant low on Saturday.

For updated forecasts, visit: www.nhc.noaa.gov.

By Rob Gutro
NASA’s Goddard Space Flight Center, Greenbelt, Md.