Oct. 09, 2020 – NASA Shows Heaviest Rainfall Displaced in Typhoon Chan-hom
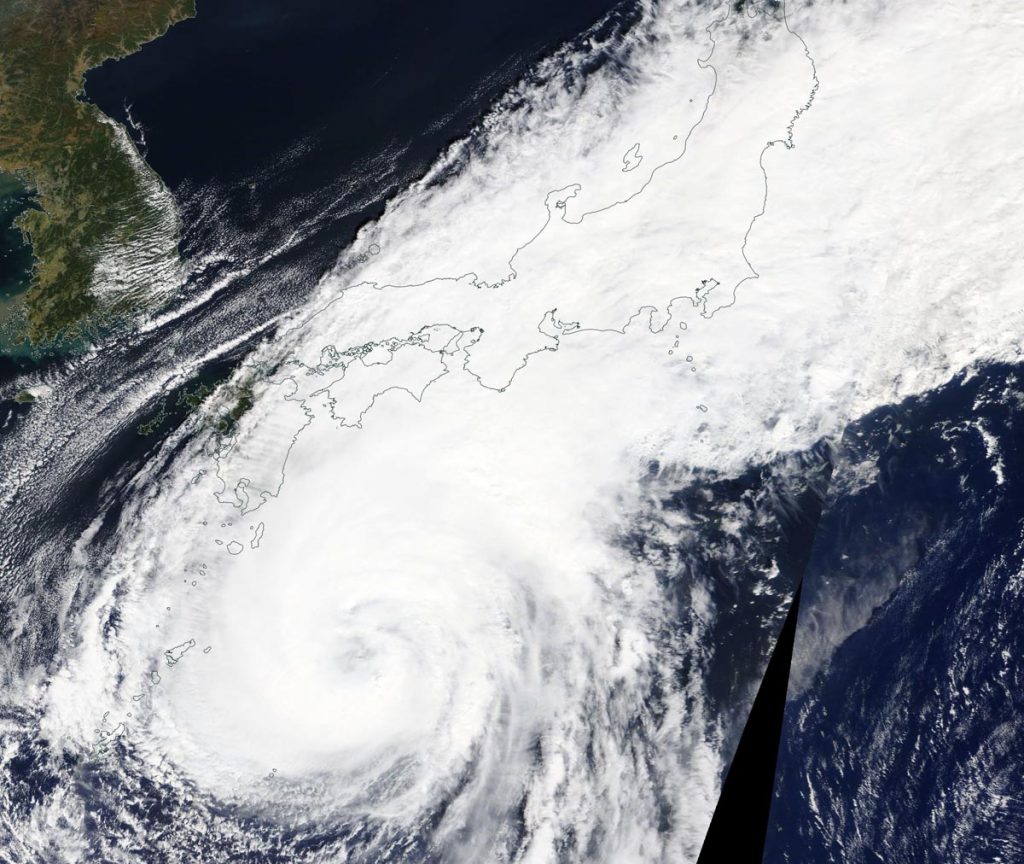
Typhoon Chan-hom was still moving parallel to Japan’s east coast as NASA’s satellite rainfall product, that incorporates data from satellites and observations, showed its heaviest rainfall was pushed northeast of center.
At 5 a.m. EDT (0900 UTC), the center of Chan-hom was located near latitude 30.9 degrees north and longitude 133.9 degrees east. That is approximately 413 nautical miles southwest of Yokosuka, Japan. Chan-hom was moving to the north-northeast. Maximum sustained winds are near 70 knots (81 mph/130 kph).
Estimating Chan-hom’s Rainfall Rates from Space
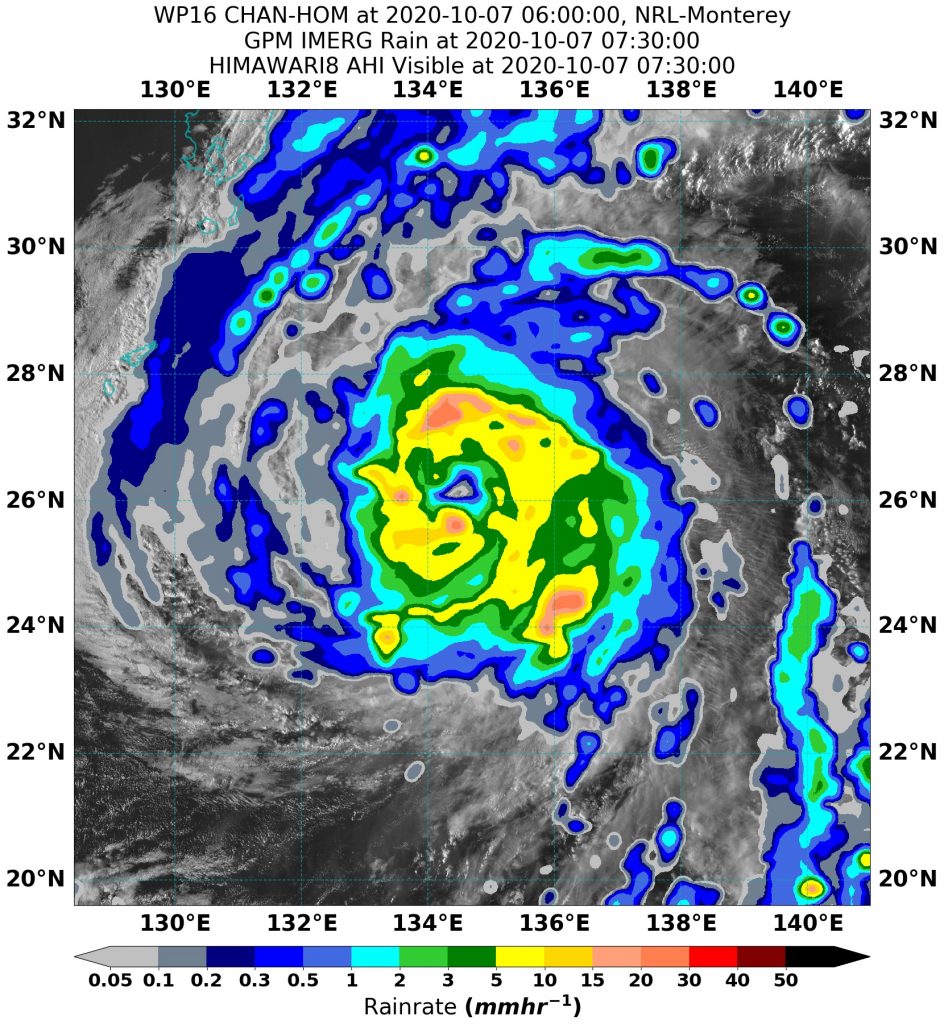
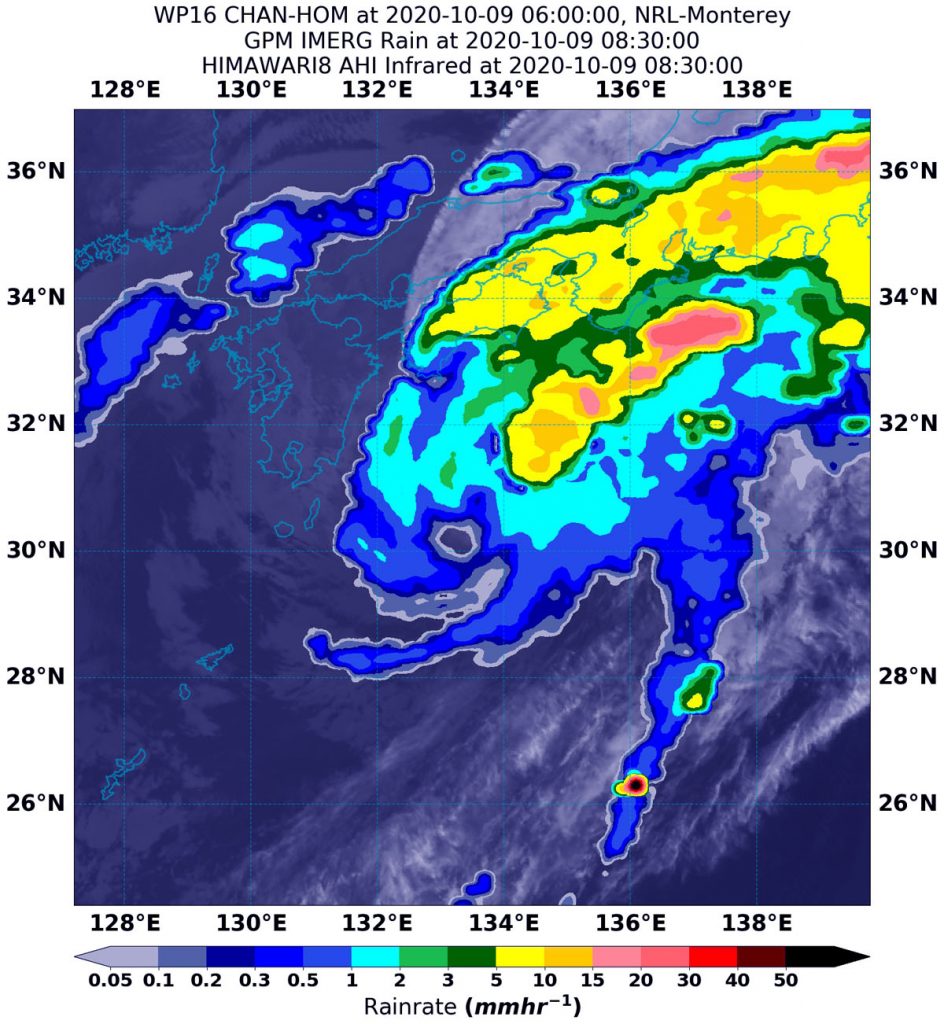
NASA’s Integrated Multi-satellitE Retrievals for GPM or IMERG, which is a NASA satellite rainfall product, estimated Chan-hom’s rainfall rates on Oct. 9 at 4:30 a.m. EDT (0830 UTC).
Wind shear, outside winds at different speeds and directions that can adversely affect a tropical cyclone, were pushing Chan-hom’s heaviest rainfall northeast of the center. Chan-hom was generating as much as 30 mm (1.18 inches) of rain per hour just northeast of the center of circulation. Rainfall rates in storms surrounding those areas of heaviest rainfall were estimated as falling at a rate between 5 and 15 mm (0.2 to 0.6 inches) per hour. On the southwestern side of the center, rainfall rates were occurring between 0.1 and 1 mm (0.003 and 0.03 inches) per hour.
Forecasters at the Joint Typhoon Warning Center noted, “Chan-hom is tracking along the western periphery of a subtropical ridge (elongated area of high pressure) positioned to the east and through an overall unfavorable environment with moderate to high (25 knots/29 mph/46 kph) vertical wind shear.”
At the U.S. Naval Laboratory in Washington, D.C., the IMERG rainfall data was overlaid on infrared imagery from NOAA’s GOES-16 satellite to provide a full extent of the storm.
What Does IMERG Do?
This near-real time rainfall estimate comes from the NASA’s IMERG, which combines observations from a fleet of satellites, in near-real time, to provide near-global estimates of precipitation every 30 minutes. By combining NASA precipitation estimates with other data sources, we can gain a greater understanding of major storms that affect our planet.
What the IMERG does is “morph” high-quality satellite observations along the direction of the steering winds to deliver information about rain at times and places where such satellite overflights did not occur. Information morphing is particularly important over the majority of the world’s surface that lacks ground-radar coverage. IMERG fills in the blanks between weather observation stations.
Chan-hom’s Fate
Chan-hom will gradually weaken as it tracks generally east northeastward over the next day. In three days, the system is expected to become fully embedded in the westerly wind flow aloft. It is expected to complete extra-tropical transitioning becoming a cold core low-pressure area as it moves northeast and away from Japan.
NASA Researches Tropical Cyclones
Hurricanes/tropical cyclones are the most powerful weather events on Earth. NASA’s expertise in space and scientific exploration contributes to essential services provided to the American people by other federal agencies, such as hurricane weather forecasting.
For more than five decades, NASA has used the vantage point of space to understand and explore our home planet, improve lives and safeguard our future. NASA brings together technology, science, and unique global Earth observations to provide societal benefits and strengthen our nation. Advancing knowledge of our home planet contributes directly to America’s leadership in space and scientific exploration.
For more information about NASA’s IMERG, visit: https://pmm.nasa.gov/gpm/imerg-global-image
By Rob Gutro
NASA’s Goddard Space Flight Center