Karen – Atlantic Ocean

Sep. 27, 2019 – NASA Satellite Finds Karen Holding onto Tropical Storm Status through Cloud Heights, Temperatures

NASA’s Terra Satellite provides a variety of data on tropical cyclones including cloud heights and cloud top temperatures. Terra examined those factors in Tropical Storm Karen in the North Atlantic Ocean and data showed Karen holding onto tropical storm status.
Terra image of Karen
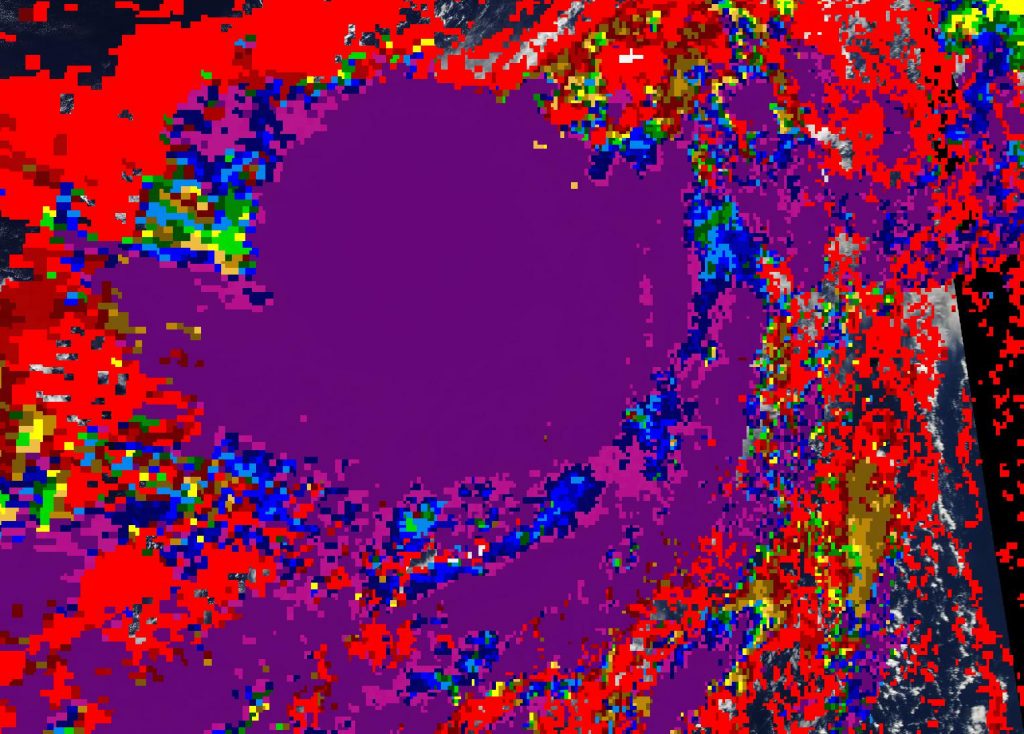
On Sept. 26, the MODIS instrument that flies aboard NASA’s Terra provided an image of cloud top temperatures and heights of Tropical Storm Karen. Purple indicates the highest cloud tops with the coldest temperatures. Credit: NASA Worldview, Earth Observing System Data and Information System (EOSDIS).

Tropical cyclones are made up of hundreds of thunderstorms. By analyzing the heights of thunderstorms and their cloud top temperatures, forecasters can tell if a storm is strengthening or weakening. The higher the cloud tops, the stronger the uplift in a storm. That rising air helps thunderstorms develop.  As storms go higher, it is an indication that the storm is strengthening. Conversely, if over a period of time, satellite data shows cloud tops falling and warming, it is an indication the storm is weakening because there’s not as strong an uplift or rising air in the storm.

On Sept. 26, the Moderate Imaging Spectroradiometer or MODIS instrument that flies aboard NASA’s Terra satellite measured clouds heights and temperatures. The imagery showed the highest cloud tops, higher than 12,000 meters (7.65 miles) were located around the center of circulation.

Terra data also found that cloud top temperatures were as cold as or colder than 200 Kelvin (minus 99.6 degrees Fahrenheit/minus 73.1 degrees Celsius) in those storms. NASA research has shown that cloud top temperatures that cold have the capability to generate heavy rainfall.

NOAA’s National Hurricane Center or NHC said at 5 a.m. EDT (0900 UTC), the center of Tropical Storm Karen was located near latitude 28.3 degrees north and longitude 61.2 degrees west. Karen is moving toward the northeast at near 8 mph (13 kph). This general motion is forecast to continue this morning, but Karen is forecast to become nearly stationary by tonight or early Saturday. A westward motion is then anticipated by the end of the weekend. Maximum sustained winds are near 40 mph (65 kph) with higher gusts.

Karen is forecast to degenerate into a remnant low by Saturday.

The Terra satellite cloud height and temperature data was provided by NASA’s Worldview product at NASA’s Goddard Space Flight Center, Greenbelt, Md.

Hurricanes are the most powerful weather event on Earth. NASA’s expertise in space and scientific exploration contributes to essential services provided to the American people by other federal agencies, such as hurricane weather forecasting.

For updated forecasts, visit: www.nhc.noaa.gov

By Rob Gutro
NASA’s Goddard Space Flight Center

Karen – Atlantic Ocean

Sep. 26, 2019 – NASA Finds Tropical Storm Karen’s Strength on Western Side

NASA’s Terra satellite captured an image of Tropical Storm Karen on Sept. 26 and found the strongest thunderstorms west of center.

Terra image of Karen
On Sept. 26 at 1:30 p.m. EDT, the MODIS instrument that flies aboard NASA’s Terra satellite captured this visible image of Karen, that showed a cluster of storms west of center and the storm appeared somewhat elongated. Credit: NASA Worldview

On Sept. 26 at 1:30 p.m. EDT on Sept. 26, the Moderate Imaging Spectroradiometer or MODIS instrument that flies aboard NASA’s Terra satellite provided a visible image of Karen. The image showed the Karen has been maintaining a cluster of developing thunderstorms and convection to the west of center. NOAA’s National Hurricane Center noted that visible satellite images, such as the one from NASA’s Terra satellite and wind data from NOAA buoy 40149 to the northeast, suggest that the low-level circulation is becoming elongated. When a storm becomes elongated, it’s a sign of weakening.

The shape of the storm is a clue to forecasters that a storm is either strengthening or weakening. If a storm takes on a more rounded shape it is getting more organized and strengthening. Conversely, if it becomes less rounded or elongated, like Karen, it is a sign the storm is weakening.

At 11 a.m. EDT (1500 UTC), the center of Tropical Storm Karen was located near latitude 26.6 degrees north and longitude 63.3 degrees west. Karen was centered about 405 miles (650 km) south-southeast of Bermuda. Karen is moving toward the north-northeast near 14 mph (22 kph), and this motion is expected to continue with a decrease in forward speed through this evening.  Karen is then forecast to make a slow clockwise loop, ultimately moving westward by early Sunday.

Satellite-derived wind data indicate that maximum sustained winds are near 45 mph (75 kph) with higher gusts. The estimated minimum central pressure is 1004 millibars.

Weakening is forecast by the weekend, and Karen is expected to become a remnant low by Sunday, Sept. 29.

Hurricanes are the most powerful weather event on Earth. NASA’s expertise in space and scientific exploration contributes to essential services provided to the American people by other federal agencies, such as hurricane weather forecasting.

For updated forecasts, visit: https://www.nhc.noaa.gov

By Rob Gutro
NASA’s Goddard Space Flight Center

Karen – Atlantic Ocean

Sep. 25, 2019 – NASA Finds Tropical Storm Karen Bringing Heavy Rain to Puerto Rico

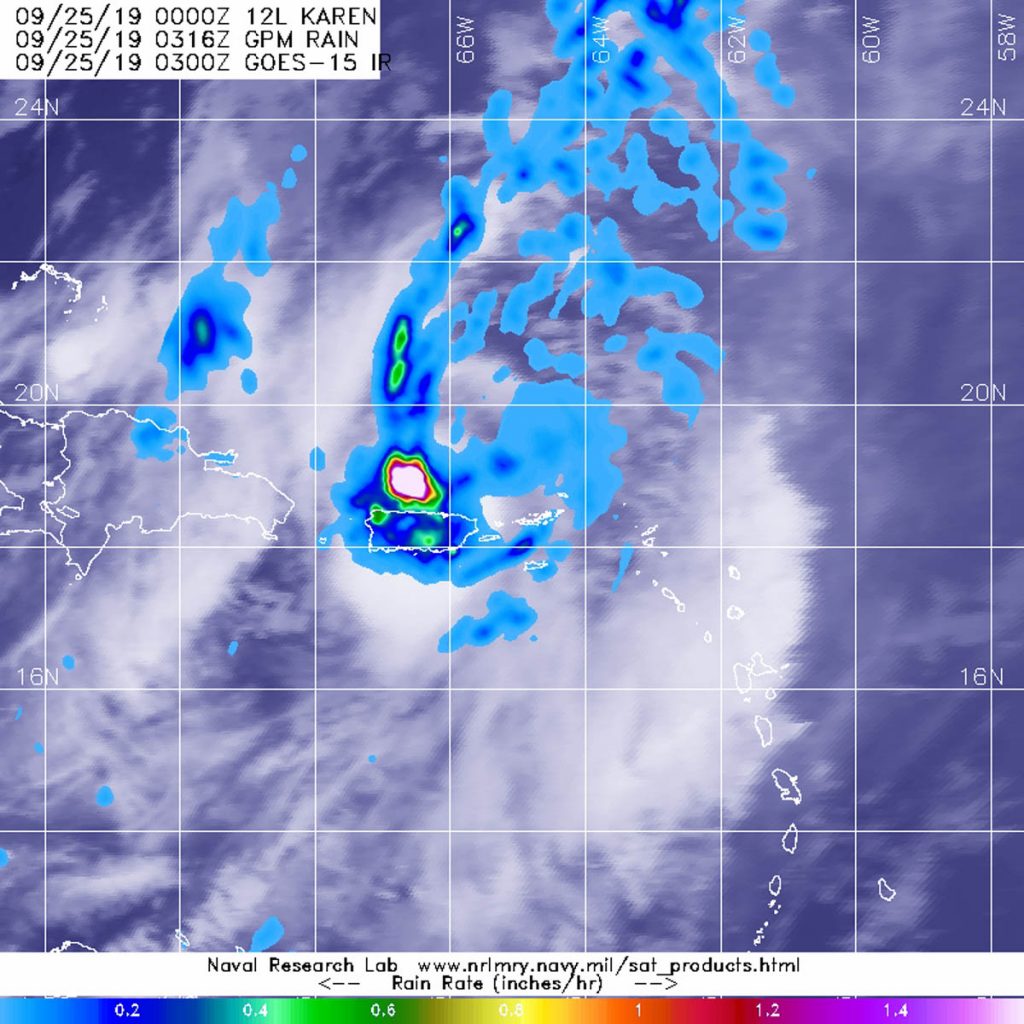
Tropical Storm Karen has crossed over Puerto Rico and into the western Atlantic Ocean. Early on Sept. 25 when Global Precipitation Measurement mission or GPM core satellite passed overhead, the satellite found heavy rain occurring over the territory.

GPM image of Karen
The GPM’s core satellite passed over Tropical Storm Karen on Sept. 25 at 0316 UTC (Sept. 24 at 11:16 p.m. EDT ). GPM found heavy rain falling at a rate of greater than 1.6 inches (40 millimeters) southwest of Karen’s center over the Atlantic Ocean and just north of central Puerto Rico. Heavy rain was also (dark blue and orange) falling a more than 1 inch (25 mm) per hour over Puerto Rico and extended far to the north of Karen’s center into the Atlantic. Credit: NASA/NRL

The GPM’s core satellite passed over Tropical Storm Karen on Sept. 25 at 0316 UTC (Sept. 24 at 11:16 p.m. EDT). GPM found heavy rain falling at a rate greater than 1.6 inches (40 millimeters) southwest of Karen’s center over the Atlantic Ocean and just north of central Puerto Rico. Heavy rain was also falling at more than 1 inch (25 mm) per hour over much of Puerto Rico and extended far to the north of Karen’s center into the Atlantic.

Forecasters at NOAA’s National Hurricane Center or NHC incorporate the rainfall data into their forecasts. At 11 a.m. EDT (1500 UTC), NHC noted “Karen is expected to produce additional rainfall accumulations of 1 to 2 inches across Puerto Rico and the Virgin Islands, with isolated storm totals of 8 inches.”

The center of Tropical Storm Karen was located near latitude 21.7 degrees north and longitude 64.9 degrees west. Karen’s center had moved further away from Puerto Rico since the GPM image was collected and was located about 240 miles (385 km) north-northwest of San Juan, Puerto Rico.

Karen was moving toward the north near 15 mph (24 kph). Maximum sustained winds are near 45 mph (75 kph) with higher gusts. Some strengthening is forecast during the next couple of days. Tropical-storm-force winds extend outward up to 70 miles (110 km) from the center. The estimated minimum central pressure is 1003 millibars.

NHC said, “A north-northeastward to northeastward motion with a decrease in forward speed is expected through early Friday.  Karen is then expected to slow down and make a clockwise loop over the southwestern Atlantic into the weekend.”

Hurricanes are the most powerful weather event on Earth. NASA’s expertise in space and scientific exploration contributes to essential services provided to the American people by other federal agencies, such as hurricane weather forecasting.

GPM is a joint mission between NASA and the Japan Aerospace Exploration Agency, JAXA.

For updated forecasts on Karen from NHC, Visit: www.nhc.noaa.gov

For local forecasts from the National Weather Service in Puerto Rico, Visit: https://www.weather.gov/sju/

By Rob Gutro
NASA’s Goddard Space Flight Center

Karen – Atlantic Ocean

Sep. 24, 2019 – NASA Sees Karen Regain Tropical Storm Status

NASA-NOAA’s Suomi NPP satellite passed over the Caribbean Sea and used infrared light to obtain temperature information about Karen’s cloud tops. Data showed powerful thunderstorms re-developed in around the storm’s center as it strengthened back into a tropical storm.

Suomi NPP image of Karen
NASA-NOAA’s Suomi NPP satellite passed over Tropical Storm Karen and the VIIRS instrument aboard captured this image of the storm on Sept. 24 at 2:48 a.m. EDT (0648 UTC). Suomi NPP found that the strongest thunderstorms around the center had cloud top temperatures as cold as minus 80 degrees Fahrenheit (minus 62.2 degrees Celsius) appearing in yellow. Those storms were surrounded by strong storms with cloud top temperatures as cold as (red) minus 70 degrees Fahrenheit (minus 56.6 Celsius). Credit: NASA/NOAA/NRL

NASA-NOAA’s Suomi NPP satellite used infrared light to analyze the strength of storms within the structure of what was Tropical Depression Karen. Infrared data provides temperature information, and the strongest thunderstorms that reach high into the atmosphere have the coldest cloud top temperatures. This data is helpful to forecasters because storms are not uniform around tropical cyclones and it helps pinpoint where the strongest storms are located.

On Sept. 24 at 2:48 a.m. EDT (0648 UTC), the Visible Infrared Imaging Radiometer Suite (VIIRS) instrument aboard the Suomi NPP satellite found that the strongest thunderstorms around Karen’s center had cloud top temperatures as cold as minus 80 degrees Fahrenheit (minus 62.2 degrees Celsius) appearing in yellow. Those storms were surrounded by strong storms with cloud top temperatures as cold as minus 70 degrees Fahrenheit (minus 56.6 Celsius).

NASA research has shown that storms with cloud top temperatures as cold as or colder than minus 63 degrees Fahrenheit (minus 53 degrees Celsius) have the ability to produce heavy rainfall. Karen has a large area of storms around the center with temperatures colder than that threshold.

At 8 a.m. EDT (1200 UTC) those heavy rains were already lashing Virgin Islands, Culebra, and Vieques.

A Tropical Storm Warning is in effect for U.S. Virgin Islands, Puerto Rico, including Vieques and Culebra, and the British Virgin Islands. NOAA’s National Hurricane Center (NHC) said Karen is expected to produce the following rainfall accumulations through Wednesday:  Puerto Rico and the Virgin Islands are forecast to get from 2 to 4 inches of rain with isolated totals to 8 inches. The Leeward Islands are expected to receive between 1 to 3 inches, with isolated totals to 5 inches.

At 8 a.m. EDT (1200 UTC), the center of Tropical Storm Karen was located by an Air Force Reserve Hurricane Hunter aircraft near latitude 17.2 degrees north and longitude 65.8 degrees west. That is about 85 miles (120 km) south of San Juan, Puerto Rico. Karen is moving toward the north at near 7 mph (11 kph), and this general motion is expected to continue today. Maximum sustained winds are near 40 mph (65 kph) with higher gusts. The minimum central pressure just reported by the Hurricane Hunter aircraft is 1006 millibars.

NHC said that strengthening is forecast during the next 48 hours. A north-northeastward motion is forecast tonight through Wednesday night. On the forecast track, the center of Karen will pass near or over Puerto Rico and the Virgin Islands today, and then move over the western Atlantic tonight and Wednesday.

Hurricanes are the most powerful weather event on Earth. NASA’s expertise in space and scientific exploration contributes to essential services provided to the American people by other federal agencies, such as hurricane weather forecasting.

By Rob Gutro
NASA’s Goddard Space Flight Center

Karen – Atlantic Ocean

Sep. 23, 2019 – NASA Satellite Identified a Less-Organized Caribbean Tropical Storm Karen

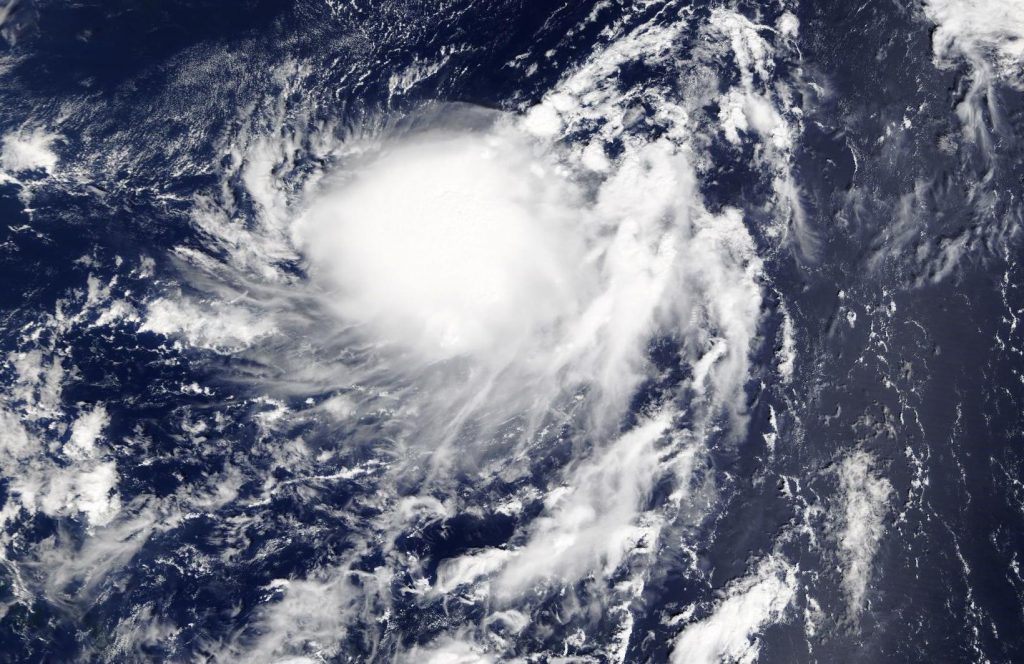
Satellite imagery can be used to peer inside a storm as well as assess the storm’s outside shape to give forecasters understanding of what’s happening to it. NASA-NOAA’s Suomi NPP satellite provided forecasters with a visible image of a less-organized Karen after it moved into the Caribbean Sea and encountered wind shear.

Suomi NPP image of Karen
NASA-NOAA’s Suomi NPP satellite passed over Tropical Storm Karen in the Caribbean Sea. Credit: NASA Worldview, Earth Observing System Data and Information System (EOSDIS)

On Sunday, Sept. 22 at 5 a.m. EDT, NOAA’s National Hurricane Center said that Tropical Storm Karen formed just east of the Windward Islands. Twelve hours later, it had moved into the Caribbean Sea.

The shape of a tropical cyclone provides forecasters with an idea of its organization and strength. Imagery from Suomi NPP showed Karen had become less organized after it moved west from the Atlantic Ocean into the southeastern Caribbean Sea.

When outside winds batter a storm, it can change the shape of it and push much of the associated clouds and rain to one side of it. That’s what wind shear does. Karen encountered northeasterly wind shear when it moved into the Caribbean Sea and those winds continued to affect Karen on Sept. 23.

In general, wind shear is a measure of how the speed and direction of winds change with altitude. Tropical cyclones are like rotating cylinders of winds. Each level needs to be stacked on top each other vertically in order for the storm to maintain strength or intensify. Wind shear occurs when winds at different levels of the atmosphere push against the rotating cylinder of winds, weakening the rotation by pushing it apart at different levels.

The Visible Infrared Imaging Radiometer Suite (VIIRS) instrument aboard Suomi NPP provided a visible image of Karen on Sept. 22. The Suomi NPP image revealed that the structure of Karen’s thunderstorms continued to lose organization during the afternoon hours and that the center become exposed to the north and northwest of the band of thunderstorms.

NOAA’s National Hurricane Center or NHC noted on Sept. 23 that despite Karen’s disorganized appearance, it is expected to bring heavy rains and gusty winds to Puerto Rico and the Virgin Islands. A Tropical Storm Warning is in effect for the U.S. Virgin Islands, Puerto Rico, including Vieques and Culebra, and British Virgin Islands.

At 11 a.m. EDT (1500 UTC), the center of Tropical Storm Karen was located near latitude 14.9 degrees north, and longitude 64.8 degrees west. Karen was about 255 miles (415 km) south-southeast of San Juan, Puerto Rico. Karen is moving toward the north-northwest near 12 mph (19 km/h), and this general motion is forecast to continue today.  A turn toward the north is expected by Tuesday. Maximum sustained winds are near 40 mph (65 kph) with higher gusts. Little overall change in strength is forecast during the next 48 hours. Tropical-storm-force winds extend outward up to 105 miles (165 km) from the center. The estimated minimum central pressure is 1007 millibars.

On the forecast track, the center of Karen will pass near or over Puerto Rico and the Virgin Islands Tuesday morning, Sept. 24.  Karen will move over the western Atlantic to the north of Puerto Rico on Tuesday night and Wednesday.

Hurricanes are the most powerful weather event on Earth. NASA’s expertise in space and scientific exploration contributes to essential services provided to the American people by other federal agencies, such as hurricane weather forecasting.

For updated forecasts. visit: www.nhc.noaa.gov

By Rob Gutro 
NASA’s Goddard Space Flight Center