Marie – Eastern Pacific Ocean

Oct. 06, 2020 – NASA Catches Development of Tropical Storm Norbert as Marie Declines

NASA-NOAA’s Suomi NPP satellite passed over the Eastern Pacific Ocean and captured the birth of a depression that became Tropical Storm Norbert while Marie continued weakening while headed toward the Central Pacific.

Suomi NPP image of Norbert
NASA-NOAA’s Suomi NPP satellite captured a visible image of the development of Tropical Storm Norbert near the coast of southwestern Mexico on Oct. 5 at 5:55 p.m. EDT (2155 UTC). Meanwhile, (top left), Tropical Storm Marie continues tracking toward the Central Pacific Ocean. Credit: NASA Worldview, Earth Observing System Data and Information System (EOSDIS).

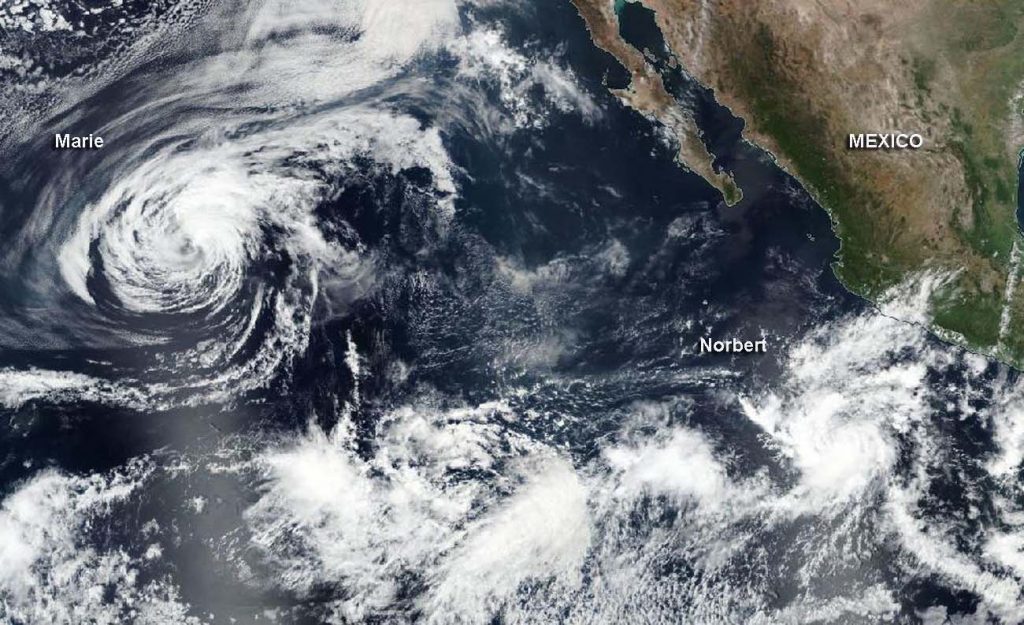
The same VIIRS visible image (above) besides capturing Norbert also caught a weakening Tropical Storm Marie as it continued toward the Central Pacific Ocean. The Suomi NPP image showed that deep convection and building thunderstorms associated with Marie had all but dissipated and what was left of it was located over 120 nautical miles away from the exposed low-level center of the cyclone (as a result of wind shear).

By 5 a.m. EDT on Oct. 6, Tropical Depression 19E strengthened into a tropical storm and was re-dubbed Norbert. At 11 a.m. EDT, Marie was barely hanging onto tropical storm status and fading quickly.

At 11 a.m. EDT (1500 UTC), the center of Tropical Storm Marie was located near latitude 22.1 degrees north and longitude 135.1 degrees west. Marie is moving toward the west-northwest near 9 mph (15 kph), and this general motion with some decrease in forward speed is expected during the next day or so, followed by a turn toward the west late Wednesday or early Thursday.

Maximum sustained winds have decreased to near 45 mph (75 kph) with higher gusts.  Gradual weakening is forecast during the next 48 hours, and Marie is forecast to become a remnant low-pressure area by tonight and a trough of low pressure in a few days.

By Rob Gutro
NASA’s Goddard Space Flight Center


Oct. 05, 2020 – NASA Infrared Imagery Reveals Wind Shear Displacing Marie’s Strongest Storms

NASA’s Aqua satellite provided an infrared view of Tropical Storm Marie that revealed the effects of outside winds battering the storm.

Aqua image of Marie
On Oct.5 at 6:20 a.m. EDT (1020 UTC), the MODIS instrument that flies aboard NASA’s Aqua satellite gathered infrared data on Marie that confirmed wind shear was adversely affecting the storm. Persistent westerly vertical wind shear showed strongest storms (yellow) pushed east of the center where cloud top temperatures were as cold as minus 50 degrees Fahrenheit (minus 45.5 Celsius). Credit: NASA/NRL

Wind shear occurs when winds at different levels of the atmosphere push against the rotating cylinder of winds, weakening the rotation by pushing it apart at different levels.

NASA’s Aqua Satellite Reveals Effects of Wind Shear 

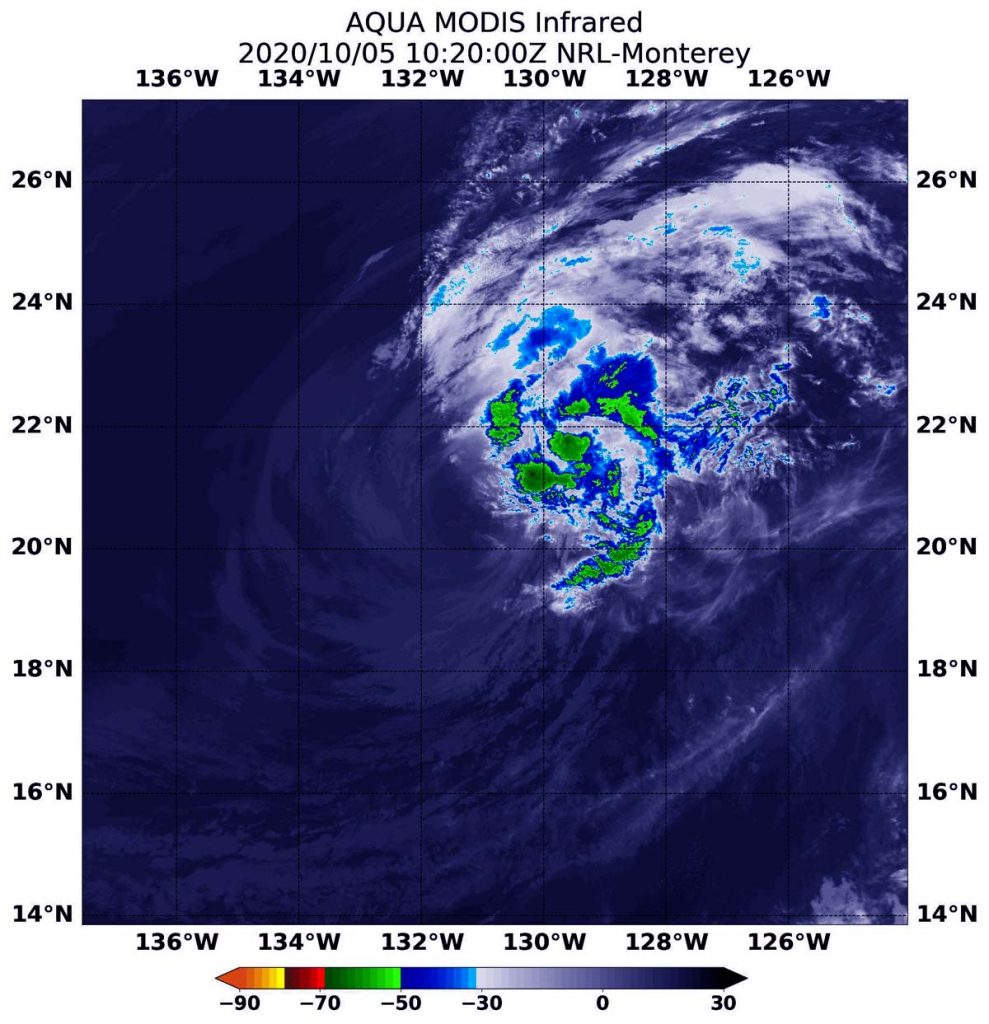
Infrared light is a tool used to analyze the strength of storms in tropical cyclones by providing temperature information about a system’s clouds. The strongest thunderstorms that reach highest into the atmosphere have the coldest cloud top temperatures. This temperature information can also tell forecasters if the strongest storms in a tropical cyclone are being pushed away from the center, indicating wind shear.

On Oct.5 at 6:20 a.m. EDT (1020 UTC), the Moderate Resolution Imaging Spectroradiometer or MODIS instrument that flies aboard NASA’s Aqua satellite gathered infrared data on Marie that confirmed wind shear was adversely affecting the storm. Westerly vertical wind shear has pushed strongest storms east of the center where cloud top temperatures are as cold as minus 50 degrees Fahrenheit (minus 45.5 Celsius). The remains of the deep convection associated with Marie continues to get further displaced from the exposed low-level center due strong upper-level westerly winds, with the gap now over 100 nautical miles between those two features.

Status of Tropical Storm Marie  

At 11 a.m. EDT (1500 UTC), the center of Tropical Storm Marie was located near latitude 21.1 degrees north and longitude 131.9 degrees west. Marie is moving toward the west-northwest near 9 mph (15 km/h), and this general motion, with a decrease in forward speed, is anticipated during the next couple of days followed by a turn to the west. Maximum sustained winds are near 60 mph (95 kph) with higher gusts.

Forecast for Marie

Continued weakening is expected and Marie is forecast to degenerate into a remnant low by Tuesday night.

NASA Researches Tropical Cyclones

Hurricanes/tropical cyclones are the most powerful weather events on Earth. NASA’s expertise in space and scientific exploration contributes to essential services provided to the American people by other federal agencies, such as hurricane weather forecasting.

For more than five decades, NASA has used the vantage point of space to understand and explore our home planet, improve lives and safeguard our future. NASA brings together technology, science, and unique global Earth observations to provide societal benefits and strengthen our nation. Advancing knowledge of our home planet contributes directly to America’s leadership in space and scientific exploration.

For updated forecasts. visit: www.nhc.noaa.gov

By Rob Gutro
NASA’s Goddard Space Flight Center

Marie – Eastern Pacific Ocean

Oct. 02, 2020 – NASA Finds Heavy Rainfall Ringing Major Hurricane Maria’s Eye

Imagine being able to look down at a storm from orbit in space, and provide data that lets scientists calculate the rate in which rain is falling throughout it. That is what a NASA satellite rainfall product does as it incorporates data from satellites and observations. NASA found very heavy rainfall ringing around the compact eye of Major Hurricane Marie.

IMERG data from Marie
On Oct. 2 at 4:30 a.m. EDT (0830 UTC), NASA’s IMERG estimated Hurricane Maria was generating as much as 50 mm (2 inches of rain/dark red) around the center of circulation. Rainfall throughout most of the storm was occurring between 3 and 20 mm (0.1 to 0.8 inches/yellow, green and pink colors) per hour. The rainfall data was overlaid on infrared imagery from NOAA’s GOES-16 satellite. Credit: NASA/NOAA/NRL

Maria’s Status on Oct. 2

At 5 a.m. EDT (0900 UTC), NOAA’s National Hurricane Center (NHC) reported Hurricane Marie was a Category 4 storm on the Saffir-Simpson Hurricane Wind Scale. The center of Hurricane Marie was located near latitude 16.2 degrees north and longitude 123.2 degrees west. Fortunately, Marie is far from land areas. It is centered about 980 miles (1,580 km) west-southwest of the southern tip of Baja California, Mexico.

Marie was moving toward the west-northwest near 15 mph (24 kph). Maximum sustained winds have increased to near 130 mph (215 kph) with higher gusts. Hurricane-force winds extend outward up to 25 miles (35 km) from the center and tropical-storm-force winds extend outward up to 125 miles (205 km). The estimated minimum central pressure is 947 millibars.

Estimating Maria’s Rainfall Rates from Space

NASA’s Integrated Multi-satellitE Retrievals for GPM or IMERG, which is a NASA satellite rainfall product, estimated on Oct. 2 at 4:30 a.m. EDT (0830 UTC), Hurricane Maria was generating as much as 50 mm (2 inches) of rain in the eyewall, ringing around the eye. Rainfall throughout most of the storm was occurring between 3 and 20 mm (0.1 to 0.8 inches) per hour.

At the U.S. Naval Laboratory in Washington, D.C., the IMERG rainfall data was overlaid on infrared imagery from NOAA’s GOES-16 satellite to provide a full picture of the storm.

What Does IMERG Do?

This near-real time rainfall estimate comes from the NASA’s IMERG, which combines observations from a fleet of satellites, in near-real time, to provide near-global estimates of precipitation every 30 minutes. By combining NASA precipitation estimates with other data sources, we can gain a greater understanding of major storms that affect our planet.

Instead, what the IMERG does is “morph” high-quality satellite observations along the direction of the steering winds to deliver information about rain at times and places where such satellite overflights did not occur. Information morphing is particularly important over the majority of the world’s surface that lacks ground-radar coverage. Basically, IMERG fills in the blanks between weather observation stations.

Marie’s Future

Additional strengthening is expected today, with weakening forecast to begin on Saturday, Oct. 3. A motion toward the west-northwest or northwest with a gradual decrease in forward speed is expected during the next several days.

NASA Researches Tropical Cyclones

Hurricanes/tropical cyclones are the most powerful weather events on Earth. NASA’s expertise in space and scientific exploration contributes to essential services provided to the American people by other federal agencies, such as hurricane weather forecasting.

For more than five decades, NASA has used the vantage point of space to understand and explore our home planet, improve lives and safeguard our future. NASA brings together technology, science, and unique global Earth observations to provide societal benefits and strengthen our nation. Advancing knowledge of our home planet contributes directly to America’s leadership in space and scientific exploration.

For more information about NASA’s IMERG, visit: https://pmm.nasa.gov/gpm/imerg-global-image

For forecast updates on hurricanes, visit: www.hurricanes.gov

By Rob Gutro
NASA’s Goddard Space Flight Center

Marie – Eastern Pacific Ocean

Oct. 01, 2020 – NASA Finds Hurricane Marie Rapidly Intensifying

NASA infrared imagery revealed that Hurricane Marie is rapidly growing stronger and more powerful. Infrared imagery revealed that powerful thunderstorms circled the eye of the hurricane as it moved through the Eastern Pacific Ocean.

Aqua image of Marie
On Oct. 1 at 4:10 a.m. EDT (0910 UTC) NASA’s Aqua satellite analyzed Hurricane Marie’s cloud top temperatures and found strongest storms (yellow) were around Marie’s center of circulation. Temperatures in those areas were as cold as minus 80 degrees Fahrenheit (minus 62.2 Celsius). Strong storms with cloud top temperatures as cold as minus 70 degrees (red) Fahrenheit (minus 56.6. degrees Celsius) surrounded the center. Credit: NASA/NRL

NOAA’s National Hurricane Center (NHC) expects Marie to become a major hurricane late on Oct. 1.  

Infrared Imagery Reveals a More Powerful Marie

One of the ways NASA researches tropical cyclones is using infrared data that provides temperature information. Cloud top temperatures identify where the strongest storms are located. The stronger the storms, the higher they extend into the troposphere, and the colder the cloud top temperatures.

On Oct. 1 at 4:10 a.m. EDT (0910 UTC) NASA’s Aqua satellite analyzed the storm using the Moderate Resolution Imaging Spectroradiometer or MODIS instrument. Hurricane Marie’s cloud top temperatures and found strongest storms were around Marie’s center of circulation. Temperatures in those areas were as cold as minus 80 degrees Fahrenheit (minus 62.2 Celsius). Strong storms with cloud top temperatures as cold as minus 70 degrees Fahrenheit (minus 56.6. degrees Celsius) surrounded the center.

NASA research has shown that cloud top temperatures that cold indicate strong storms that have the capability to create heavy rain.

At 5 a.m. EDT on Oct 1, NHC Hurricane Specialist Andrew Latto noted, “Recent microwave data and satellite images indicate that Marie has become much better organized over the past several hours, with a nearly completely closed eye noted in a (12:51 a.m. EDT) 0451Z AMSU composite microwave overpass.”

NASA then provides data to tropical cyclone meteorologists so they can incorporate it in their forecasts.

Marie’s Status on Oct. 1

At 5 a.m. EDT (0900 UTC), the center of Hurricane Marie was located near latitude 14.8 degrees north and longitude 118.1 degrees west. It is about 775 miles (1,245 km) southwest of the southern tip of Baja California, Mexico. Marie is moving toward the west near 17 mph (28 kph), and this general motion is expected to continue through tonight, followed by a gradual turn toward the west-northwest with decreasing forward speed.

Maximum sustained winds are near 90 mph (150 kph) with higher gusts. Hurricane-force winds extend outward up to 15 miles (30 km) from the center and tropical-storm-force winds extend outward up to 70 miles (110 km). The estimated minimum central pressure is 983 millibars.

Marie’s Forecast

Rapid strengthening is forecast by the National Hurricane Center. Marie is expected to become a major hurricane by tonight with some additional strengthening possible through Friday. Marie is then forecast to begin weakening this weekend.

NASA Researches Earth from Space

For more than five decades, NASA has used the vantage point of space to understand and explore our home planet, improve lives and safeguard our future. NASA brings together technology, science, and unique global Earth observations to provide societal benefits and strengthen our nation. Advancing knowledge of our home planet contributes directly to America’s leadership in space and scientific exploration.

For updated forecasts, visit: www.hurricanes.gov

By Rob Gutro 
NASA’s Goddard Space Flight Center

Marie – Eastern Pacific Ocean

Sep. 30, 2020 – NASA Confirms, Heavy Rainfall, Strengthening of Tropical Storm Marie

Tropical Storm Marie has formed in the Eastern Pacific Ocean and NASA satellite data helped confirm the strengthening of the storm. In addition, using a NASA satellite rainfall product that incorporates data from satellites and observations, NASA estimated Marie’s rainfall rates the provided more clues about intensification.

GPM image of Marie
On Sept. 30 at 5:30 a.m. EDT (0930 UTC), NASA’s IMERG estimated Tropical Storm Marie was generating as much as 30 to 40 mm (1.2 to 1.6 inches of rain/dark pink/red) around the center of circulation. Rainfall throughout most of the storm and in bands of thunderstorms west of the center, was occurring between 2 and 15 mm (0.08 to 0.6 inches/yellow and green colors) per hour. The rainfall data was overlaid on infrared imagery from NOAA’s GOES-16 satellite. Credit: NASA/NOAA/NRL

Tropical Depression 18E formed on Sept. 29 by 5 p.m. EDT well southwest of the southwestern coast of Mexico. Twelve hours later the depression strengthened into a tropical storm and renamed Marie.

Marie’s Status on Sept. 30

At 11 a.m. EDT (1500 UTC), the center of Tropical Storm Marie was located near latitude 14.2 degrees north and longitude 113.8 degrees west. Marie is located about 655 miles (1,050 km) south-southwest of the southern tip of Baja California, Mexico and is moving toward the west near 16 mph (26 kph).

A westward to west-northwestward motion is expected through Friday. Maximum sustained winds have increased to near 65 mph (100 kph) with higher gusts. The estimated minimum central pressure is 997 millibars.

Estimating Marie’s Rainfall Rates from Space

NASA’s Integrated Multi-satellitE Retrievals for GPM or IMERG, which is a NASA satellite rainfall product, estimated on Sept. 30 at 5:30 a.m. EDT (0930 UTC) that Tropical Storm Marie was generating as much as 30 to 40 mm (1.2 to 1.6 inches) of rain around the center of circulation. That heavy rainfall near the center is suggestive of hot towering thunderstorms.

A “hot tower” is a tall cumulonimbus cloud that reaches at least to the top of the troposphere, the lowest layer of the atmosphere. It extends approximately 9 miles/14.5 km high in the tropics. These towers are called “hot” because they rise to such altitude due to the large amount of latent heat. Water vapor releases this latent heat as it condenses into liquid. Those towering thunderstorms have the potential for heavy rain. NASA research shows that a tropical cyclone with a hot tower in its eyewall was twice as likely to intensify within six or more hours, than a cyclone that lacks a hot tower.

Rainfall throughout most of the storm and in bands of thunderstorms west of the center was occurring at a rate of between 2 and 15 mm (0.08 to 0.6 inches) per hour.

At the U.S. Naval Laboratory in Washington, D.C., the IMERG rainfall data was overlaid on infrared imagery from NOAA’s GOES-16 satellite to provide the full extent of the storm.

NASA satellite imagery has shown that Marie’s structure has been gradually improving. The National Hurricane Center (NHC) noted that Marie’s center is embedded beneath a central dense overcast feature, and the band of thunderstorms in the western quadrant of the storm has become more pronounced and continuous.  In addition, a mid-level eye has begun to form, as observed in microwave satellite data.

What Does IMERG Do?

This near-real time rainfall estimate comes from the NASA’s IMERG, which combines observations from a fleet of satellites, in near-real time, to provide near-global estimates of precipitation every 30 minutes. By combining NASA precipitation estimates with other data sources, we can gain a greater understanding of major storms that affect our planet.

What IMERG does is “morph” high-quality satellite observations along the direction of the steering winds to deliver information about rain at times and places where such satellite overflights did not occur. Information morphing is particularly important over the majority of the world’s surface that lacks ground-radar coverage. Basically, IMERG fills in the blanks between weather observation stations.

How Other NASA Satellites Help Forecasters

Infrared and water vapor data from NASA’s Aqua, Terra and NASA-NOAA’s Suomi NPP satellite were used to help forecasters assess the environment where Marie was headed. Infrared imagery provides temperature information about cloud tops and sea surface environments. Colder cloud tops indicate stronger storms. Sea surface temperature data are also critical for forecasters because tropical cyclones require ocean temperatures of at least 26.6 degrees Celsius (80 degrees Fahrenheit) to maintain intensity. Warmer waters can help with tropical cyclone intensification, while cooler waters can weaken tropical cyclones.

Water vapor analysis of tropical cyclones tells forecasters how much potential a storm has to develop. Water vapor releases latent heat as it condenses into liquid. That liquid becomes clouds and thunderstorms that make up a tropical cyclone. Temperature is important when trying to understand how strong storms can be. The higher the cloud tops, the colder and the stronger the storms.

Marie’s Forecast

NHC Hurricane Specialist Robbie Berg noted, “The stage appears set for Marie to rapidly intensify during the next couple of days.  Water vapor imagery indicates that the easterly [wind] shear over the cyclone has continued to decrease and should be generally low for the next 3 days, and upper-level divergence will also be in place during that period to help ventilate the storm.  The thermodynamics are also favorable for fast strengthening, highlighted by sea surface temperatures of 28-29 degrees Celsius and plenty of moisture in the surrounding environment.  Due to these conditions, the NHC forecast explicitly shows rapid intensification during the next couple of days, with a peak intensity likely occurring sometime between 48 and 60 hours.”

The National Hurricane Center expects rapid strengthening and Marie is expected to become a hurricane this evening or tonight. Marie could then become a major hurricane by late Thursday, Oct. 1.

NASA Researches Tropical Cyclones

Hurricanes/tropical cyclones are the most powerful weather events on Earth. NASA’s expertise in space and scientific exploration contributes to essential services provided to the American people by other federal agencies, such as hurricane weather forecasting.

For more than five decades, NASA has used the vantage point of space to understand and explore our home planet, improve lives and safeguard our future. NASA brings together technology, science, and unique global Earth observations to provide societal benefits and strengthen our nation. Advancing knowledge of our home planet contributes directly to America’s leadership in space and scientific exploration.

For more information about NASA’s IMERG, visit: https://pmm.nasa.gov/gpm/imerg-global-image

For forecast updates on hurricanes, visit: www.hurricanes.gov

By Rob Gutro
NASA’s Goddard Space Flight Center