Norbert – Eastern Pacific Ocean

Oct. 14, 2020 – NASA Rainfall Imagery Reveals Norbert Regains Tropical Storm Status

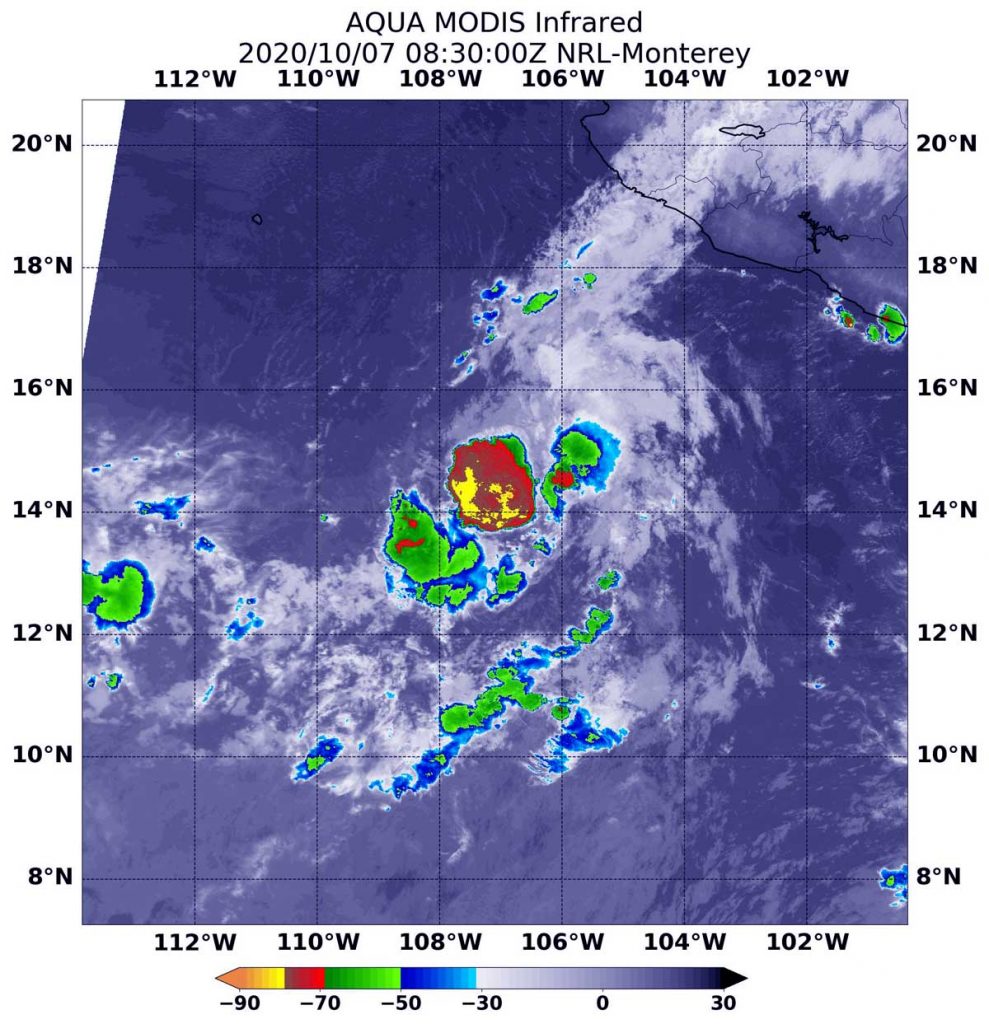
Norbert has been meandering around in the Eastern Pacific Ocean for several days as a tropical depression. A NASA satellite rainfall product that incorporates data from satellites and observations revealed that Norbert has regained tropical storm status after showing increased organization and deep convection.

IMERG data on Norbert
On Oct. 14 at 4:30 a.m. EDT (0830 UTC), NASA’s IMERG estimated Tropical Storm Norbert was generating as much as 30 mm(1.18 inches of rain [dark pink]) near the center of circulation. Rainfall throughout most of the storm was occurring between 5 and 15 mm (0.2 to 0.6 inches/yellow and green colors) per hour. The rainfall data was overlaid on infrared imagery from NOAA’s GOES-16 satellite. Credit: NASA/NOAA/NRL
At 11 p.m. EDT on Oct.13, Norbert regained tropical storm strength. At that time, the National Hurricane Center noted that Norbert had increased in organization during the evening hours and satellite data showed a tightly curved band of convection wrapping about halfway around the low-level center.

Norbert’s Status on Oct. 14

At 5 a.m. EDT (0900 UTC), the center of Tropical Storm Norbert was located near latitude 22.1 degrees north and longitude 113.3 degrees west. Norbert is moving toward the northwest near 15 mph (24 kph).  A northwestward motion with a gradual decrease in forward speed is expected through tonight. Maximum sustained winds remain near 40 mph (65 kph) with higher gusts.  Little change in strength is expected this morning, but the tropical storm is forecast to begin weakening by later today. Norbert is forecast to become a remnant low tonight or early Thursday, and dissipate by Thursday night.

Estimating Norbert’s Rainfall Rates from Space

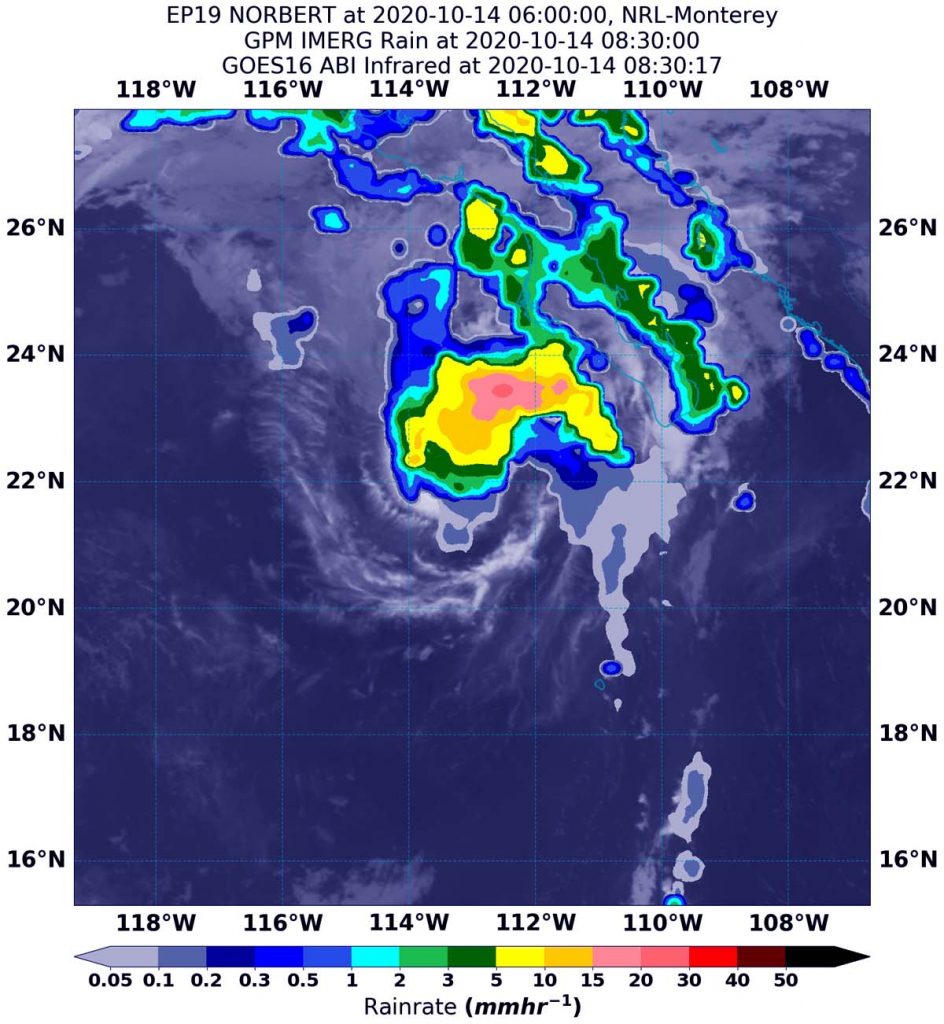
NASA’s Integrated Multi-satellitE Retrievals for GPM or IMERG, which is a NASA satellite rainfall product, estimated on Oct. 14 at 4:30 a.m. EDT (0830 UTC), Norbert was generating as much as 30 mm (1.18 inches) of rain per hour near the center of circulation. The National Hurricane Center noted that the exact location has been difficult to pinpoint in the area of deep convection.

Rainfall throughout most of the storm was estimated as falling at a rate between 5 and 15 mm (0.2 to 0.6 inches) per hour. At the U.S. Naval Laboratory in Washington, D.C., the IMERG rainfall data was overlaid on infrared imagery from NOAA’s GOES-16 satellite to provide a full extent of the storm.

What Does IMERG Do?

This near-real time rainfall estimate comes from the NASA’s IMERG, which combines observations from a fleet of satellites, in near-real time, to provide near-global estimates of precipitation every 30 minutes. By combining NASA precipitation estimates with other data sources, we can gain a greater understanding of major storms that affect our planet.

What the IMERG does is “morph” high-quality satellite observations along the direction of the steering winds to deliver information about rain at times and places where such satellite overflights did not occur. Information morphing is particularly important over the majority of the world’s surface that lacks ground-radar coverage. Basically, IMERG fills in the blanks between weather observation stations.

NASA Researches Tropical Cyclones

Hurricanes/tropical cyclones are the most powerful weather events on Earth. NASA’s expertise in space and scientific exploration contributes to essential services provided to the American people by other federal agencies, such as hurricane weather forecasting.

For more than five decades, NASA has used the vantage point of space to understand and explore our home planet, improve lives and safeguard our future. NASA brings together technology, science, and unique global Earth observations to provide societal benefits and strengthen our nation. Advancing knowledge of our home planet contributes directly to America’s leadership in space and scientific exploration.

For more information about NASA’s IMERG, visit: https://pmm.nasa.gov/gpm/imerg-global-image

For forecast updates on hurricanes, visit: www.hurricanes.gov

By Rob Gutro
NASA’s Goddard Space Flight Center

Norbert – Eastern Pacific Ocean

Oct. 07, 2020 – NASA Finds Dry Air Sapping Tropical Storm Norbert’s Strength

Infrared imagery from NASA’s Aqua satellite revealed that dry air is eroding Tropical Storm Norbert, located off the coast of southwestern Mexico.

Aqua image of Norbert
On Oct. 7 at 4:30 a.m. EDT (0830 UTC), the MODIS instrument aboard NASA’s Aqua satellite gathered temperature information about Norbert’s cloud tops. MODIS found a limited area of powerful thunderstorms (red) around the center where temperatures were as cold as or colder than minus 70 degrees Fahrenheit (minus 56.6 Celsius). Dry air around it was sapping other thunderstorms from developing. Credit: NASA/NRL

Infrared Data Reveals Dry Air Effects

On Oct. 7 at 4:30 a.m. EDT (0830 UTC), the Moderate Resolution Imaging Spectroradiometer or MODIS instrument aboard NASA’s Aqua satellite gathered temperature information about Norbert’s cloud tops. Infrared data provides temperature information, and the strongest thunderstorms that reach high into the atmosphere have the coldest cloud top temperatures.

Dry air suppresses the development of thunderstorms that need warm, moist air to form. Dry air saps the moisture. Tropical cyclones consist of hundreds of thunderstorms. When their development is limited by environmental factors, they have difficulty strengthening and often weaken. The MODIS image showed fragmentation of thunderstorms around Norbert’s center as dry air affected development.

MODIS found that Norbert has weakened as entrainment of dry air has disrupted the compact system. The National Hurricane Center reported that Norbert’s center was partially exposed overnight, but recent infrared imagery shows a new burst of deep convection near the center. MODIS identified that burst of strong thunderstorms in infrared light, where temperatures were as cold as or colder than minus 70 degrees Fahrenheit (minus 56.6 Celsius). Cloud top temperatures that cold indicate strong storms with the potential to generate heavy rainfall.

Norbert’s Status on Oct. 7

At 5 a.m. EDT (0900 UTC), the center of Tropical Storm Norbert was located near latitude 14.0 degrees north and longitude 107.1 degrees west. Norbert is drifting toward the southwest near 1 mph (2 kph). The storm is forecast to meander or remain nearly stationary over the next couple of days.

Satellite-derived wind data indicate that maximum sustained winds have decreased to near 40 mph (65 kph) with higher gusts. Some fluctuations in strength will be possible during the next few days. The estimated minimum central pressure is 1005 millibars.

Norbert’s Future

Forecasters at the National Hurricane Center noted the forecast for Norbert over the next couple of days is challenging. “The intensity forecast for Norbert remains tricky given its small circulation and the presence of dry air in the surrounding environment. Sea-surface temperatures are more than sufficient for at least modest strengthening, but the question will be whether Norbert can survive the increased southeasterly shear that the SHIPS [computer forecast model] guidance calls for during the next 24-48 hours.”

NASA Researches Tropical Cyclones

For more than five decades, NASA has used the vantage point of space to understand and explore our home planet, improve lives and safeguard our future. NASA brings together technology, science, and unique global Earth observations to provide societal benefits and strengthen our nation. Advancing knowledge of our home planet contributes directly to America’s leadership in space and scientific exploration.

For updated forecasts, visit: www.nhc.noaa.gov

By Rob Gutro
NASA’s Goddard Space Flight Center

Norbert – Eastern Pacific Ocean

Oct. 06,  2020 – NASA Catches Development of Tropical Storm Norbert as Marie Declines

NASA-NOAA’s Suomi NPP satellite passed over the Eastern Pacific Ocean and captured the birth of a depression that became Tropical Storm Norbert while Marie continued weakening while headed toward the Central Pacific.

Suomi NPP image of Norbert
NASA-NOAA’s Suomi NPP satellite captured a visible image of the development of Tropical Storm Norbert near the coast of southwestern Mexico on Oct. 5 at 5:55 p.m. EDT (2155 UTC). Meanwhile, (top left), Tropical Storm Marie continues tracking toward the Central Pacific Ocean. Credit: NASA Worldview, Earth Observing System Data and Information System (EOSDIS)

Tropical Depression 19E formed well offshore of southwestern Mexico on Oct. 5 and at 5:55 p.m. EDT (2155 UTC) visible imagery from the Visible Infrared Imaging Radiometer Suite (VIIRS) instrument aboard Suomi NPP helped confirm the development. VIIRS showed the low-pressure area had become better defined than it was during the previous day. The image was generated at NASA’s Goddard Space Flight Center in Greenbelt, Md. using the NASA Worldview application.

NOAA’s National Hurricane Center (NHC) noted, “The associated deep convection has also become more organized and convection has persisted over the low-level center since early this morning. In addition, a banding feature has also developed over the western portion of the circulation. Based on these trends, advisories have been initiated for Tropical Depression 19E.”

The same VIIRS visible image also caught a weakening Tropical Storm Marie as it continued toward the Central Pacific Ocean. The Suomi NPP image showed that deep convection and building thunderstorms associated with Marie had all but dissipated and what was left of it was located over 120 nautical miles away from the exposed low-level center of the cyclone (as a result of wind shear).

By 5 a.m. EDT on Oct. 6, Tropical Depression 19E strengthened into a tropical storm and was re-dubbed Norbert. At 11 a.m. EDT, Marie was barely hanging onto tropical storm status and fading quickly.

Norbert’s Status on Oct. 6

At 11 a.m. EDT (1500 UTC) on Oct. 6, the center of Tropical Storm Norbert was located near latitude 14.2 degrees north and longitude 106.6 degrees west. That is 365 miles (585 km) south-southwest of Manzanillo, Mexico. Norbert is moving toward the northwest near 7 mph (11 kph). A slower northwestward motion is expected until tonight. The system is forecast to meander thereafter through midweek. Maximum sustained winds are near 45 mph (75 kph) with higher gusts. Some slow strengthening is possible over the next few days. The estimated minimum central pressure is 1002 millibars.

Marie’s Fading Status of Oct. 6

At 11 a.m. EDT (1500 UTC), the center of Tropical Storm Marie was located near latitude 22.1 degrees north and longitude 135.1 degrees west. Marie is moving toward the west-northwest near 9 mph (15 kph), and this general motion with some decrease in forward speed is expected during the next day or so, followed by a turn toward the west late Wednesday or early Thursday.

Maximum sustained winds have decreased to near 45 mph (75 kph) with higher gusts.  Gradual weakening is forecast during the next 48 hours, and Marie is forecast to become a remnant low-pressure area by tonight and a trough of low pressure in a few days.

About NASA’s Worldview

NASA’s Earth Observing System Data and Information System (EOSDIS) Worldview application provides the capability to interactively browse over 700 global, full-resolution satellite imagery layers and then download the underlying data. Many of the available imagery layers are updated within three hours of observation, essentially showing the entire Earth as it looks “right now.”

NASA Researches Tropical Cyclones

Hurricanes/tropical cyclones are the most powerful weather events on Earth. NASA’s expertise in space and scientific exploration contributes to essential services provided to the American people by other federal agencies, such as hurricane weather forecasting.

For more than five decades, NASA has used the vantage point of space to understand and explore our home planet, improve lives and safeguard our future. NASA brings together technology, science, and unique global Earth observations to provide societal benefits and strengthen our nation. Advancing knowledge of our home planet contributes directly to America’s leadership in space and scientific exploration.

By Rob Gutro 
NASA’s Goddard Space Flight Center