This animation shows NASA IMERG rain rates (blue shading) and accumulations (green shading) alongside the NOAA low-pressure center track (red line) of Tropical Storm Amanda/Cristobal. The origin of this storm was in the eastern Pacific Ocean in late May 2020, where it was named Tropical Storm Amanda as it approached the southern Mexican and Central American coast. Amanda made landfall in Guatemala on May 31, where it began to deliver the first of a series of heavy rain pulses that led to flooding in the region. After temporarily stalling over land, the system reformed over the Bay of Campeche on June 1 as Tropical Storm Cristobal and made its second landfall on June 3 in Mexico. The storm continued to deliver several pulses of heavy rainfall to southern Mexico, Guatemala, and El Salvador. Some areas of the region accumulated over 60 cm (~2 feet) of rainfall throughout Cristobal’s passage. The storm then crossed the Gulf of Mexico and made landfall in Louisiana on June 7 and progressed northward as a tropical depression before being classified as an extratropical low pressure system over Wisconsin on June 10. Large swaths of the U.S. Gulf Coast and Midwest as far north as Wisconsin saw accumulations in excess of 10 cm (~4 inches), and some areas along the coasts of Florida, Alabama, and Mississippi received over 20 cm (~8 inches), during Cristobal’s passage.
Credit: Visualization and text by Jason West (NASA GSFC)
June 10, 2020 – NASA Finds Post-Tropical Depression Cristobal Soaking the Great Lakes
NASA’s GPM satellite gathered data on what is now Post-Tropical Cyclone Cristobal and revealed some areas of heavy rain were occurring. Cristobal was bringing rainfall and gusty winds to the Great Lakes Region and still generating warnings.
Warnings and Advisories
On June 10, Cristobal was designated a post-tropical cyclone and the storm has triggered several watches and warnings in the Great Lakes area. The National Weather Service’s Weather Prediction Center (WPC) in College Park, Md. issued a Lakeshore Flood Warning for the northern shores of Lake St. Clair. Lakeshore Flood Advisories are in effect for the Lake Michigan shoreline of northern Lower Michigan, the Lake Michigan shoreline of Upper Michigan and the Lake Huron shoreline of Upper Michigan.
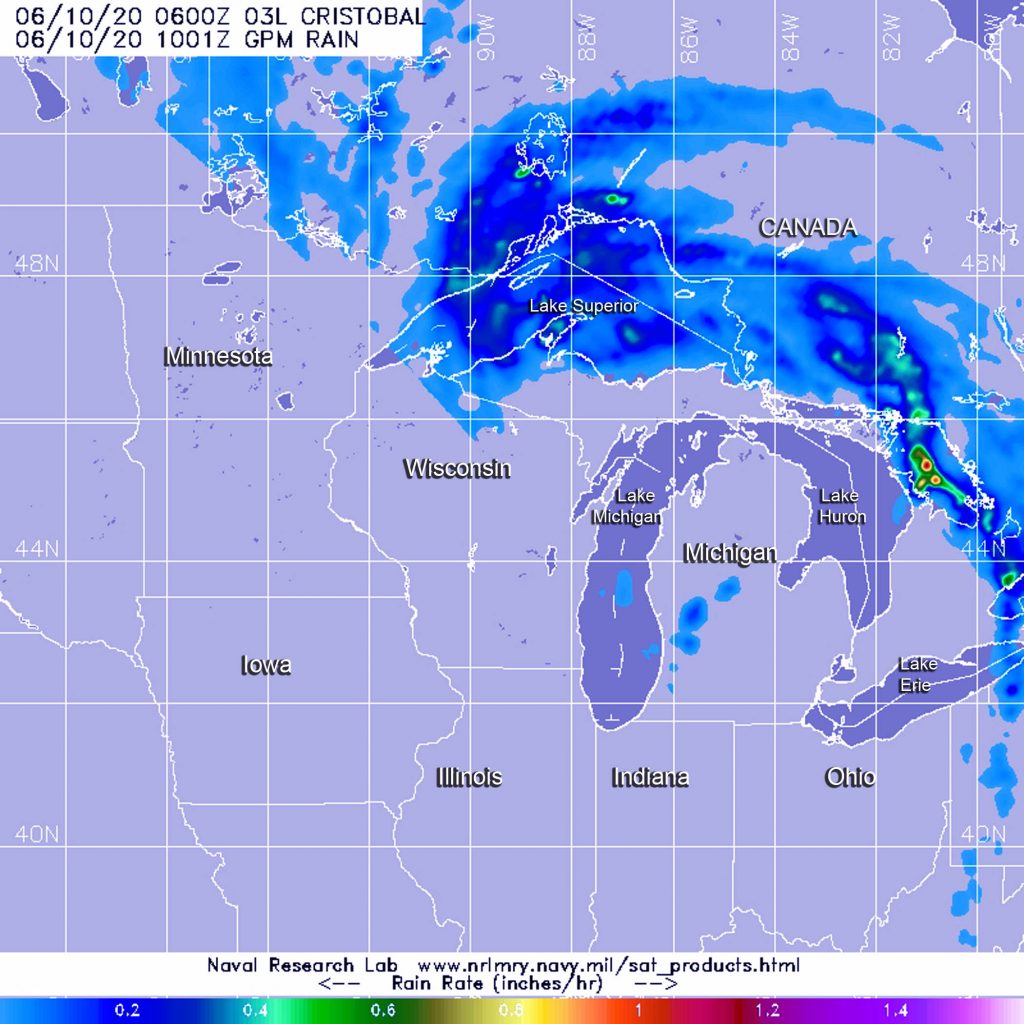
The GPM’s core satellite passed over Cristobal on June 10 at 2 a.m. EDT (0600 UTC). GPM found heaviest rainfall (orange) occurring in two areas. One area was north and west of Lake Superior, north of Rossport and Red Rock, Ontario, Canada. The second area was over Georgian Bay in the eastern side of Lake Huron. In both places, heavy rain (orange) was falling at a rate of 1 inch (25 mm) per hour. Light rain (blue) appears stretched around the northern and eastern side of the system. Credit: NASA/NRL
In addition, a Gale Warning is in effect for Lake Michigan, eastern Lake Superior and portions of Lake Huron. Wind Advisories are in effect for parts of Wisconsin and Michigan.
What is a Post-tropical Cyclone?
NOAA’s National Hurricane Center defines a Post-tropical cyclone as a former tropical cyclone. This generic term describes a cyclone that no longer possesses sufficient tropical characteristics to be considered a tropical cyclone. Post-tropical cyclones can continue carrying heavy rains and high winds. Former tropical cyclones that have become fully extratropical and remnant lows are two classes of post-tropical cyclones.
Rainfall Estimates
When the Global Precipitation Measurement mission or GPM core satellite passed over Cristobal on June 10 at 2 a.m. EDT (0600 UTC). GPM found heaviest rainfall occurring in two areas. One area was north and west of Lake Superior, north of Rossport and Red Rock, Ontario, Canada. The second area was over Georgian Bay on the eastern side of Lake Huron. In both places, rain was falling at rates of 1 inch (25 mm) per hour. Light rain appears stretched around the northern and eastern side of the system, falling at less than 0.2 inches (less than 5 millimeters) per hour.
Forecast Rainfall
The WPC noted, “The primary rainfall threat with Cristobal has ended. Sporadic heavy rain is possible today across the Great Lakes, along and ahead of a cold front associated with extratropical Cristobal. Minor to moderate river flooding will continue across portions of the Mississippi Valley.”
Cristobal’s Status on Wednesday, June 10, 2020
At 5 a.m. EDT (0900 UTC) on June 10, the center of Post-Tropical Cyclone Cristobal was located near latitude 45.8 degrees north and longitude 88.2 degrees west. That places the center about 195 miles (310 km) north-northeast of Madison, Wisconsin and about 185 miles (295 km) west of Sault Ste. Marie, Michigan. The post-tropical cyclone is moving toward the north-northeast near 30 mph (48 kph) and this motion is expected to continue as Cristobal tracks into Ontario, Canada.
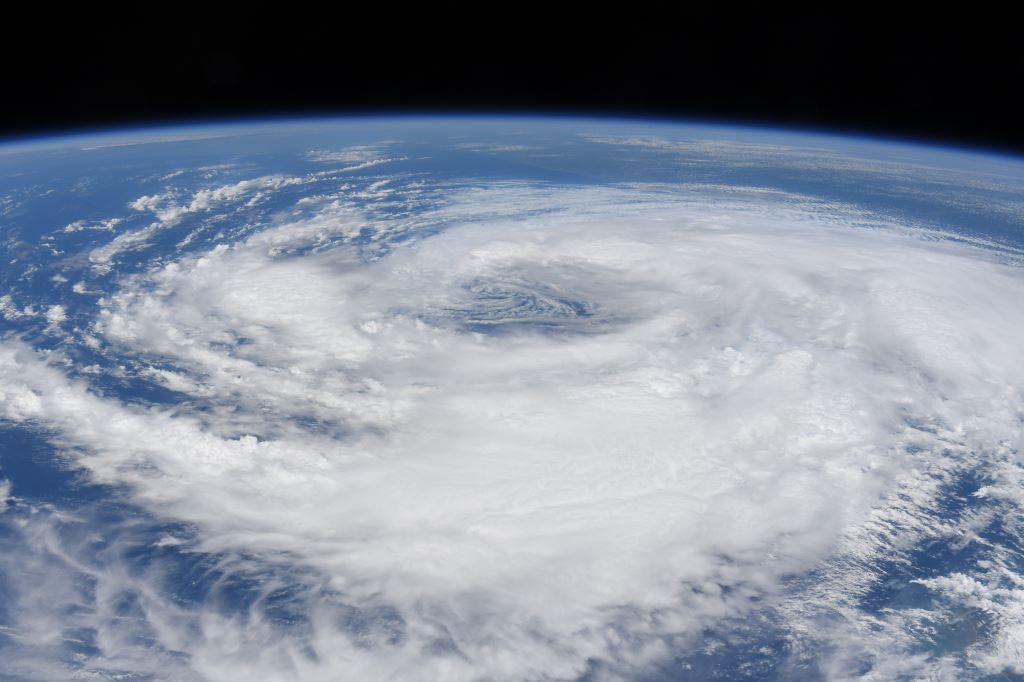
On June 8, from aboard the International Space Station, Astronaut Chris Cassidy captured this image of Tropical Storm Cristobal. Credit: NASA/Chris Cassidy Twitter
Maximum sustained winds are near 40 mph (65 kph) with higher gusts. Little change in strength is forecast during the next 48 hours. The estimated minimum central pressure is 983 millibars.
Cristobal’s Forecast Path
WPC noted that in addition to rainfall, winds gusting over 40 mph are expected early during the morning of June 10 over portions of Wisconsin and Michigan close to the Great Lakes. In addition, a few tornadoes are possible today across in the Great Lakes region, with the greatest chances in parts of Michigan, Indiana and Ohio.
Tropical cyclones/hurricanes are the most powerful weather events on Earth. NASA’s expertise in space and scientific exploration contributes to essential services provided to the American people by other federal agencies, such as hurricane weather forecasting.
GPM is a joint mission between NASA and the Japan Aerospace Exploration Agency, JAXA. The Suomi NPP satellite is a joint mission with NASA and NOAA.
June 09, 2020 – NASA Tracks Tropical Depression Cristobal Moving Toward Great Lakes
Once a tropical storm in the Gulf of Mexico, now a tropical depression in the Mississippi Valley, NASA’s Aqua satellite is tracking Cristobal as it continues to generate large amounts of rainfall while it heads toward the Great Lakes region.
On June 9 at 3:40 a.m. EDT (0740 UTC) the MODIS instrument that flies aboard NASA’s Aqua satellite showed strongest storms in Tropical Depression Cristobal were northeast and north of the elongated center over western Missouri, Iowa and Illinois, where cloud top temperatures were as cold as minus 63 degrees Fahrenheit (minus 56.6 Celsius). Credit: NASA/NRL
Infrared Data Reveals Strongest Storms
NASA’s Aqua satellite used infrared light to analyze the strength of storms and determine where the strongest storms were within the tropical depression. Strong storms are not evenly distributed within a tropical system, so it helps forecasters to know which side of the storm has the strongest storms and biggest rainmakers. Infrared data provides temperature information, and the strongest thunderstorms that reach high into the atmosphere have the coldest cloud top temperatures.
On June 9 at 3:40 a.m. EDT (0740 UTC) the Moderate Resolution Imaging Spectroradiometer (MODIS) instrument that flies aboard NASA’s Aqua satellite showed strongest storms in Tropical Depression Cristobal were northeast and north of the elongated center over western Missouri, Iowa and Illinois, where cloud top temperatures were as cold as minus 63 degrees Fahrenheit (minus 56.6 Celsius). NASA research has shown that storms with cloud top temperatures that cold have the ability to generate heavy rainfall.
Watches, Warnings and Rainfall Expected
On June 9, the National Weather Service Weather Prediction Center (WPC) in College Park, Md. has taken over the forecast responsibility for Cristobal, now that it is far inland. WPC issued a Flash Flood Watch for areas in and near the length of the Mississippi Valley. A Gale Warning is in effect for much of Lake Michigan, portions of eastern Lake Superior and portions of Lake Huron.
WPC forecasts “Cristobal will produce storm total rainfall accumulations of 2 to 4 inches with local amounts to 6 inches from Arkansas to the western Great Lakes through Wednesday morning. This rainfall may produce flash flooding, and is forecast to produce new and renewed minor to moderate river flooding across portions of the lower Missouri and mid to upper Mississippi Valleys. Smaller streams and rivers across southeast Louisiana, southern Mississippi, and eastern Arkansas have already begun to rise.”
Cristobal’s Status
At 5 a.m. EDT (0900 UTC), the center of Tropical Depression Cristobal was located near latitude 36.8 degrees north and longitude 92.0 degrees west. That puts the center of circulation about 140 miles (225 km) north of Little Rock, Arkansas and about 80 miles (130 km) east-southeast of Springfield, Missouri. The depression is moving toward the north near 25 mph (41 kph) and its motion is expected to accelerate to the north and north-northeast over the next 36 hours. Maximum sustained winds are near 30 mph (45 kph) with higher gusts. The estimated minimum central pressure is 995 millibars.
Cristobal Expected to Become Extra-Tropical
Often, a tropical cyclone will transform into an extra-tropical cyclone as it recurves toward the poles (north or south, depending on the hemisphere the storm is located in). Cristobal is expected to become an extra-tropical storm as it moves toward the Great Lakes region. An extra-tropical cyclone is a storm system that primarily gets its energy from the horizontal temperature contrasts that exist in the atmosphere.
Tropical cyclones have their strongest winds near the earth’s surface, while extra-tropical cyclones have their strongest winds near the tropopause – about 8 miles (12 km) up. Tropical cyclones, in contrast, typically have little to no temperature differences across the storm at the surface and their winds are derived from the release of energy due to cloud/rain formation from the warm moist air of the tropics.
Cristobal’s Path Forward
Some strengthening is forecast during the next 36 hours as Cristobal transitions into an extratropical cyclone. WPC said, “Gusty winds are expected Tuesday night and Wednesday [June 10] over portions of the Midwest and western Great Lakes as Cristobal strengthens as an extratropical low.”
June 08, 2020 – NASA Calculates Soaking Rainfall in Tropical Depression Cristobal
When Tropical Storm Cristobal made landfall in southern Louisiana yesterday, June 7, it dropped a lot of rain, and continues to as it weakens and moves inland. NASA’s GPM satellite provided a look at the rainfall rates in the now depression.
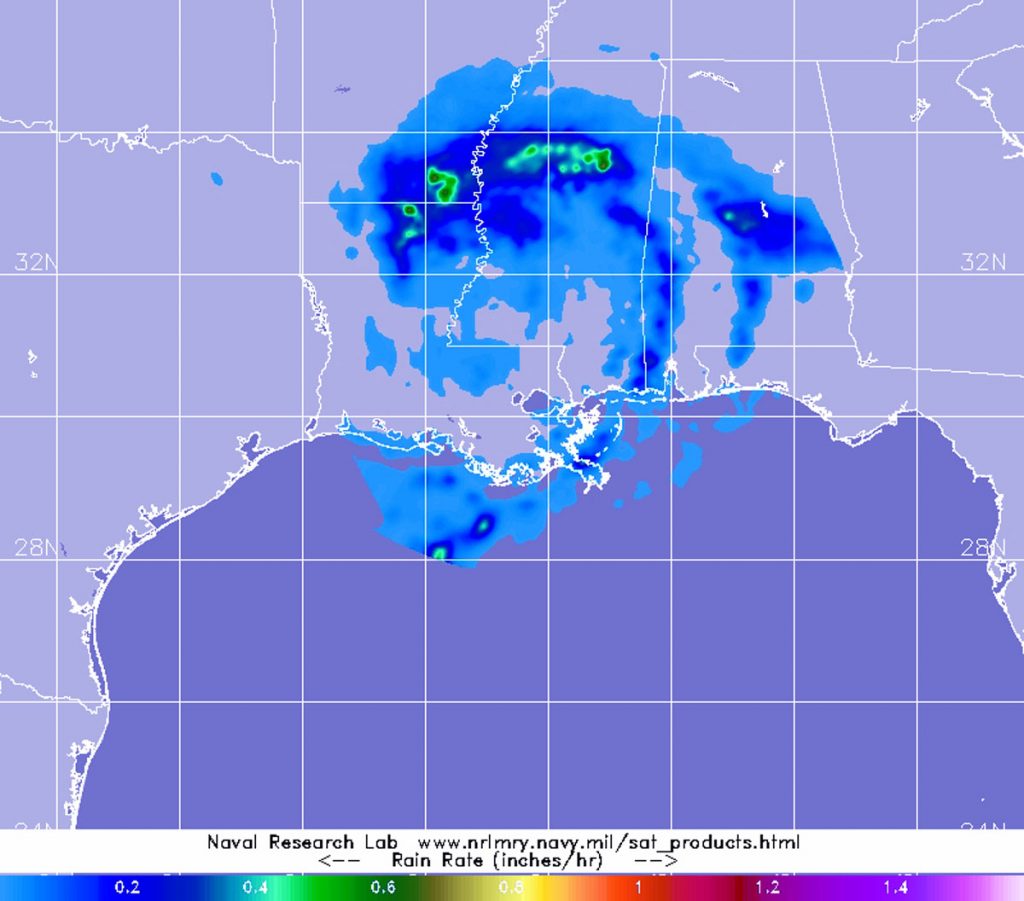
The Global Precipitation Measurement mission or GPM core satellite passed over Cristobal on June 8 at 7:46 a.m. EDT (1146 UTC). GPM found heaviest rainfall north of center falling at rates of 1 inch (25 mm) per hour over northern Louisiana, southern Arkansas and northern Mississippi. Light rain appears around the entire system, falling at less than 0.2 inches (less than 5 millimeters) per hour.
The GPM’s core satellite passed over Cristobal on June 8 at 7:46 a.m. EDT (1146 UTC). GPM found heaviest rainfall (orange) north of center falling at rates of 1 inch (25 mm) per hour over northern Louisiana, southern Arkansas and northern Mississippi. Light rain appears around the entire system (light blue), falling at less than 0.2 inches (less than 5 millimeters) per hour. Credit: NASA/NRL
Large Rainfall Totals Expected
The heavy rainfall rates that GPM observed are expected to add up to large amounts of rain on the ground, and the National Hurricane Center provided an estimate in the latest forecast on June 8, 2020.
NHC said, “Cristobal is expected to produce storm total rainfall accumulations of 5 to 10 inches across portions of the central to eastern Gulf Coast into the Lower Mississippi Valley, with isolated amounts to 15 inches. Rainfall totals of 2 to 4 inches with local amounts to 6 inches are expected across portions of the mid-to-Upper Mississippi Valley and Northern Plains near and in advance of Cristobal. This rainfall has led to flash flooding and forecast widespread river flooding across portions of the central Gulf Coast into the Lower Mississippi Valley. Smaller streams across southeast Louisiana and southern Mississippi have begun to rise and are forecast to crest mid-week. New and renewed significant river flooding is possible across the mid and upper Mississippi Valley.”
Gusty winds and isolated tornadoes are possible today with the depression. Gusty winds could also occur Tuesday night and Wednesday over portions of the Midwest and western Great Lakes as Cristobal becomes an extratropical low. Isolated tornadoes are possible today and tonight across Mississippi, Alabama, southeastern Louisiana, eastern Arkansas, western Tennessee, and southeastern Missouri. Ocean swells generated by Cristobal are still affecting portions of the northern and eastern Gulf coast and are likely causing life-threatening surf and rip current conditions.
Cristobal’s Status on Monday, June 8, 2020
This animation of visible imagery from the NASA-NOAA Suomi NPP satellite from June 4 at 0000 UTC to June 7 at 0000 UTC shows the northward movement of Tropical Storm Cristobal as it moved through the Gulf of Mexico. Credit: NASA Worldview
At 8 a.m. EDT (1200 UTC), the center of Tropical Depression Cristobal was located near latitude 31.8 degrees north and longitude 91.6 degrees west. That puts the center of circulation about 50 miles (75 km) south-southeast of Monroe, Louisiana. The depression is moving toward the north-northwest near 10 mph (17 km/h) and this motion should continue today. Maximum sustained winds were 35 mph (55 kph) with higher gusts. The estimated minimum central pressure based on surface observations is 994 millibars.
Cristobal’s Forecast Path
NHC forecasters expect that Cristobal will weaken through Tuesday. However, Cristobal is expected to strengthen some as it becomes an extratropical low pressure area Tuesday [June 9] night and Wednesday [June 10].
NHC expects a turn toward the north tonight, followed by a faster north-northeast motion Tuesday and Wednesday. On the forecast track, the center of Cristobal should move through northeastern Louisiana today, through Arkansas and eastern Missouri tonight and Tuesday, and reach Wisconsin and the western Great Lakes by Wednesday.
Tropical cyclones/hurricanes are the most powerful weather events on Earth. NASA’s expertise in space and scientific exploration contributes to essential services provided to the American people by other federal agencies, such as hurricane weather forecasting.
GPM is a joint mission between NASA and the Japan Aerospace Exploration Agency, JAXA. The Suomi NPP satellite is a joint mission with NASA and NOAA.
June 07, 2020 – NASA Analyzes Tropical Storm Cristobal Temperatures, Water Vapor
NASA scientists can analyze tropical cyclones in a variety of ways that include temperature and water vapor content. NASA’s Aqua satellite provided that data on Tropical Storm Cristobal as it approached the mouth of the Mississippi River on Sunday, June 7, 2020.
The National Hurricane Center (NHC) forecasts Cristobal to track northward through the Gulf of Mexico and toward Louisiana’s coast. Watches and warnings have gone into effect.
Watches and Warnings
On June 7 as Tropical Storm Cristobal was near the U.S. Gulf coast warnings were in effect. A Storm Surge Warning is in effect from the mouth of the Mississippi River to Ocean Springs, Mississippi and Lake Borgne. A Storm Surge Watch is in effect from east of Morgan City, Louisiana to the mouth of the Mississippi River. A Tropical Storm Warning is in effect from Intracoastal City, Louisiana to the Okaloosa/Walton County, Florida line and for Lake Pontchartrain and Lake Maurepas.
What the NASA Satellite Views Show
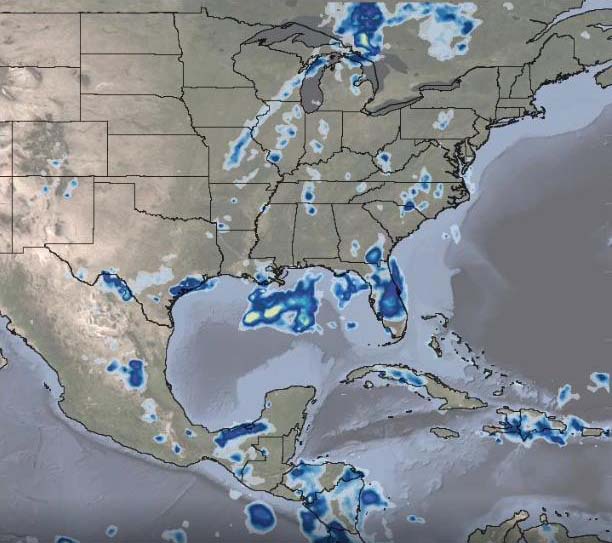
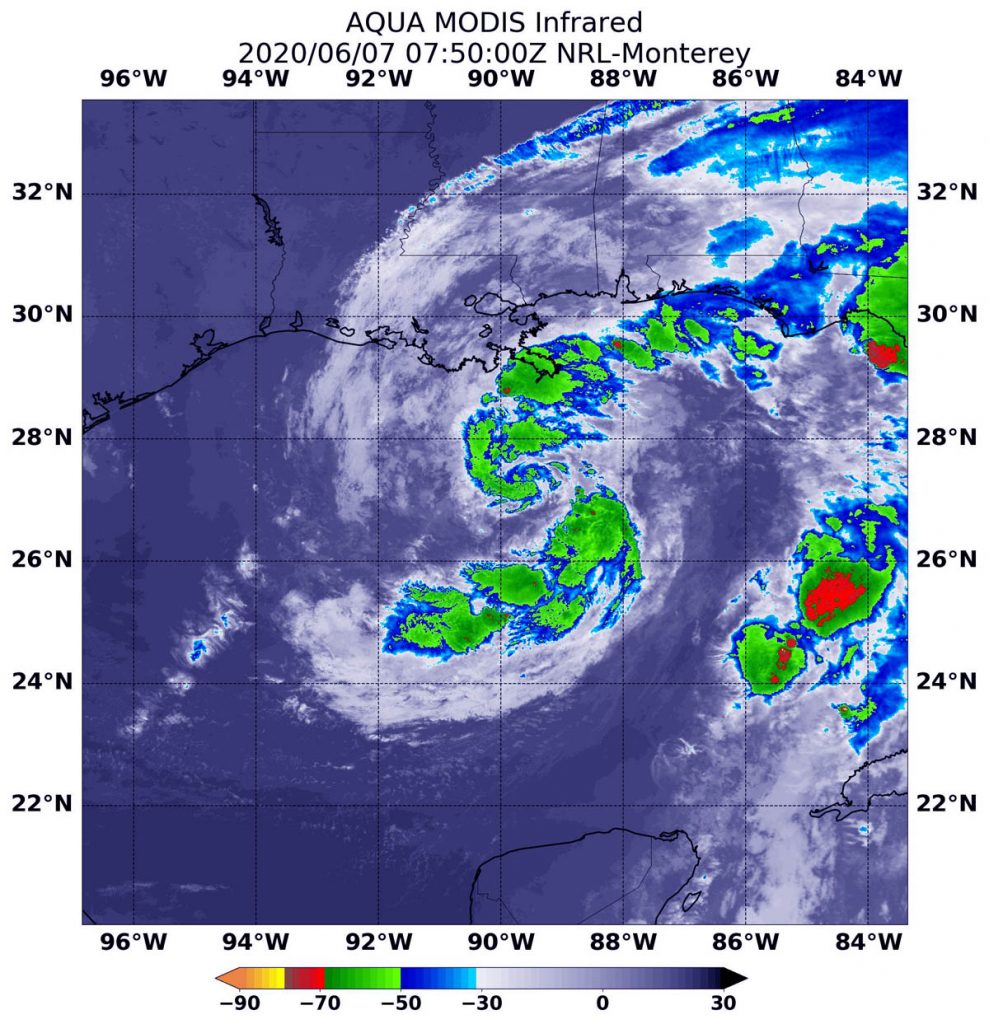
On June 7 at 3:50 a.m. EDT (0750 UTC), the MODIS instrument aboard NASA’s Aqua satellite showed several areas of powerful thunderstorms (green) where temperatures were as cold as or colder than minus 63 degrees Fahrenheit (minus 52.7 Celsius). All of those strongest storms were over the Gulf of Mexico, with the exception of an area over the southeastern Louisiana. Credit: NASA/NRL
On June 7 at 3:50 a.m. EDT (0750 UTC), the Moderate Resolution Imaging Spectroradiometer or MODIS instrument aboard NASA’s Aqua satellite showed several areas of powerful thunderstorms where temperatures were as cold as or colder than minus 63 degrees Fahrenheit (minus 52.7 Celsius). Cloud top temperatures that cold indicate strong storms with the potential to generate heavy rainfall. At the time of the imagery, all of those strongest storms were over the Gulf of Mexico, with the exception of an area over the southeastern Louisiana.
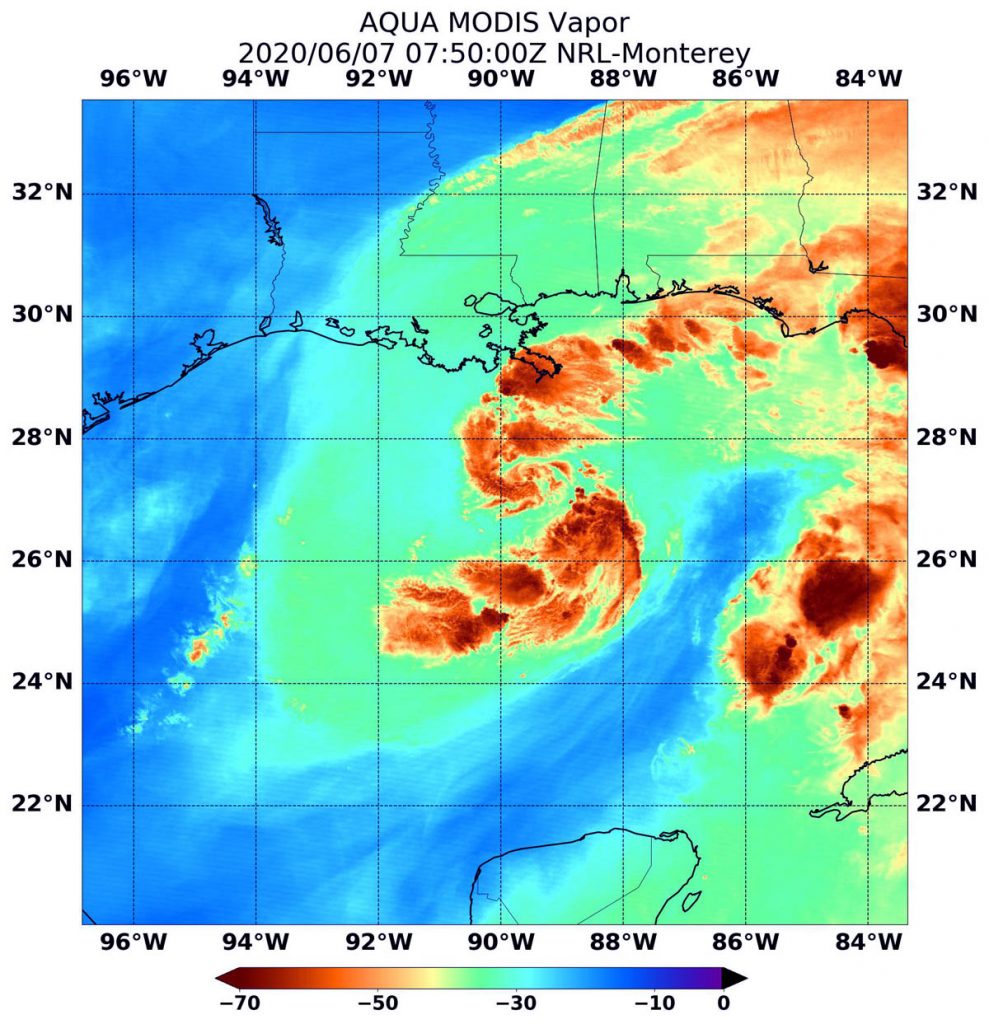
At the same time, a water vapor image of Tropical Storm Cristobal was taken from NASA’s Aqua satellite. The water vapor imagery confirmed the cloud top temperatures and showed where the greatest water content was in the storms.
Water vapor analysis of tropical cyclones tells forecasters how much potential a storm has to develop. Water vapor releases latent heat as it condenses into liquid. That liquid becomes clouds and thunderstorms that make up a tropical cyclone. Temperature is important when trying to understand how strong storms can be. The higher the cloud tops, the colder and stronger they are.
A water vapor image of Tropical Storm Cristobal was taken from NASA’s Aqua satellite on June 7 at 3:50 a.m. EDT (0750 UTC), and the brown color (minus 63 degrees Fahrenheit/minus 52.7 degrees Celsius) showed where the greatest water content was in the storms. Credit: NASA/NRL
Looking at NASA and other satellite imagery, forecasters at NOAA’s National Hurricane Center (NHC) noted that Cristobal continues to resemble a subtropical cyclone more than a tropical cyclone. At 5 a.m. EDT on June 7, the convection near the center remains limited, although it has become a little better organized during the past several hours.
Cristobal’s Status on June 7, 2020
At 8 a.m. EDT (1200 UTC), NHC noted that the center of Tropical Storm Cristobal was located by an Air Force Reserve reconnaissance aircraft near latitude 28.2 degrees north and longitude 89.9 degrees west. That puts the center about 70 miles (110 km) south of Grand Isle, Louisiana and about 75 miles (125 km) south-southwest of the mouth of the Mississippi River.
Cristobal was moving toward the north near 12 mph (19 kph) and this general motion is expected to continue today, followed by a gradual turn toward the north-northwest late today or tonight. Data from NOAA Doppler weather radars indicate that maximum sustained winds remain near 50 mph (85 km/h) with higher gusts. Tropical-storm-force winds extend outward up to 205 miles (335 km) mainly to the east of the center. The minimum central pressure recently measured by the reconnaissance aircraft was 994 millibars.
NHC provided detailed information about expected storm surge, rainfall totals, winds, isolated tornadoes and ocean swells. For those details visit: www.nhc.noaa.gov.
NHC forecasters said, “A combination of a dangerous storm surge and the tide will cause normally dry areas near the coast to be flooded by rising waters moving inland from the shoreline. The water could reach the following heights above ground somewhere in the indicated areas if the peak surge occurs at the time of high tide.
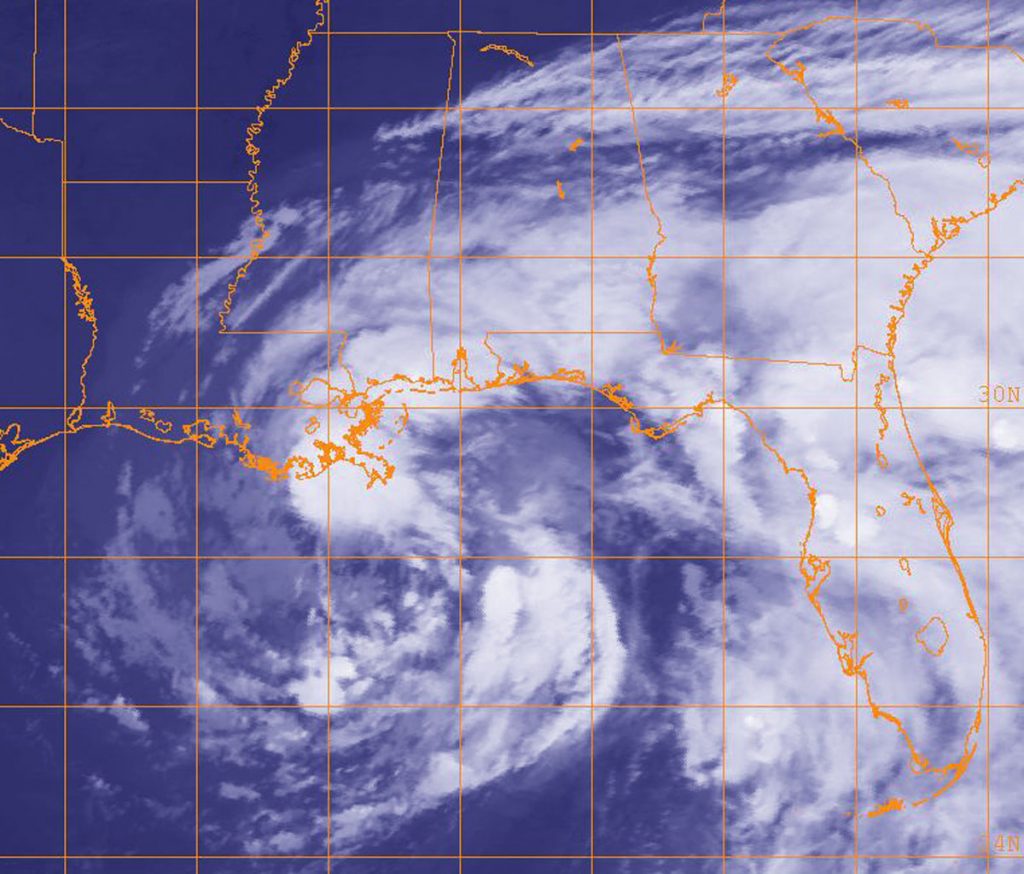
NOAA’s GOES East satellite provided a night-time view of Cristobal near the mouth of the Mississippi River on June 7 at 9 a.m. EDT. Credit: NRL/NOAA
Cristobal is expected to produce total rainfall accumulations of 4 to 8 inches across portions of the central Gulf Coast into the Lower Mississippi Valley, with isolated amounts to 12 inches. Rainfall totals of 2 to 4 inches with local amounts to 6 inches are expected across portions of the eastern Gulf Coast, along with the Mid to Upper Mississippi Valley and Northern Plains near and in advance of Cristobal.
Tropical storm conditions are expected within the Tropical Storm Warning area along the northern Gulf coast today and tonight. A few tornadoes are possible today and tonight across eastern Louisiana, southern Mississippi, southern Alabama, and northern Florida.”
In addition, ocean swells generated by Cristobal will affect portions of the northern and eastern Gulf coast during the next couple of days. These swells are likely to cause life-threatening surf and rip current conditions.
Cristobal’s Forecast Path
Little change in strength is forecast before Cristobal makes landfall and weakening will begin once Cristobal moves inland. On the NHC forecast track, the center of Cristobal will approach the northern Gulf of Mexico coast during the afternoon of Sunday, June 7, then move inland across Louisiana late today through Monday morning [June 8] and northward across Arkansas and Missouri Monday afternoon into Tuesday [June 9].
Typhoons/hurricanes are the most powerful weather events on Earth. NASA’s expertise in space and scientific exploration contributes to essential services provided to the American people by other federal agencies, such as hurricane weather forecasting.
June 06, 2020 – NASA Sees Cristobal Marching Through the Gulf of Mexico
NASA’s Aqua satellite provided visible and infrared imagery of the re-strengthened Tropical Storm Cristobal as it continued on a northward track through the Gulf of Mexico.
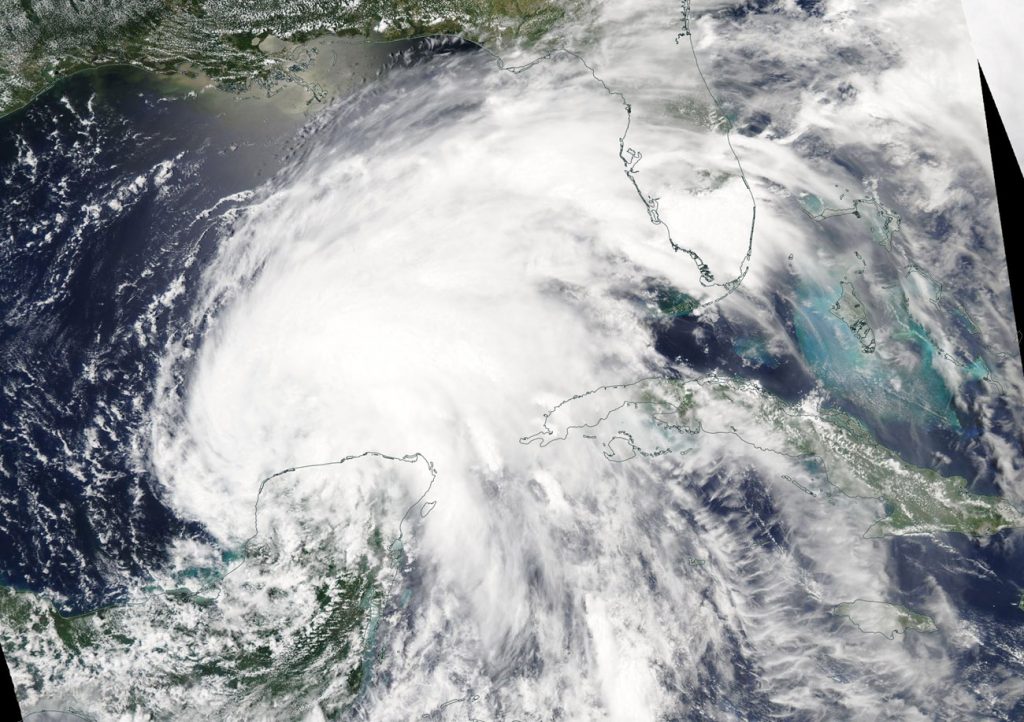
A visible image of Tropical Storm Cristobal was taken from NASA’s Aqua satellite on June 5 and showed the clouds in Cristobal’s eastern quadrant stretched over parts of Florida, while the center was still just north of Mexico’s Yucatan Peninsula. Credit: NASA Worldview
The National Hurricane Center (NHC) forecasts Cristobal to track northward through the Gulf of Mexico and toward Louisiana’s coast. Watches and warnings have gone into effect.
Watches and Warnings
On June 6, the NHC continued a Storm Surge Watch for the northern Gulf of Mexico coast from Indian Pass to Arepika, Florida and it also covers the area from East of Morgan City, Louisiana to the mouth of the Mississippi River.
Now, a Tropical Storm Warning is in effect from east of Morgan City, Louisiana to the Okaloosa/Walton County, Florida line and for Lake Pontchartrain and Lake Maurepas. In addition, a Tropical Storm Watch is in effect from Intracoastal City, Louisiana to Morgan City.
What the NASA Satellite Views Show
On June 6 at 3:10 a.m. EDT (0710 UTC), the Moderate Resolution Imaging Spectroradiometer or MODIS instrument aboard NASA’s Aqua satellite provided a visible (above) and infrared (below) image of Cristobal after it moved through the Gulf of Mexico.
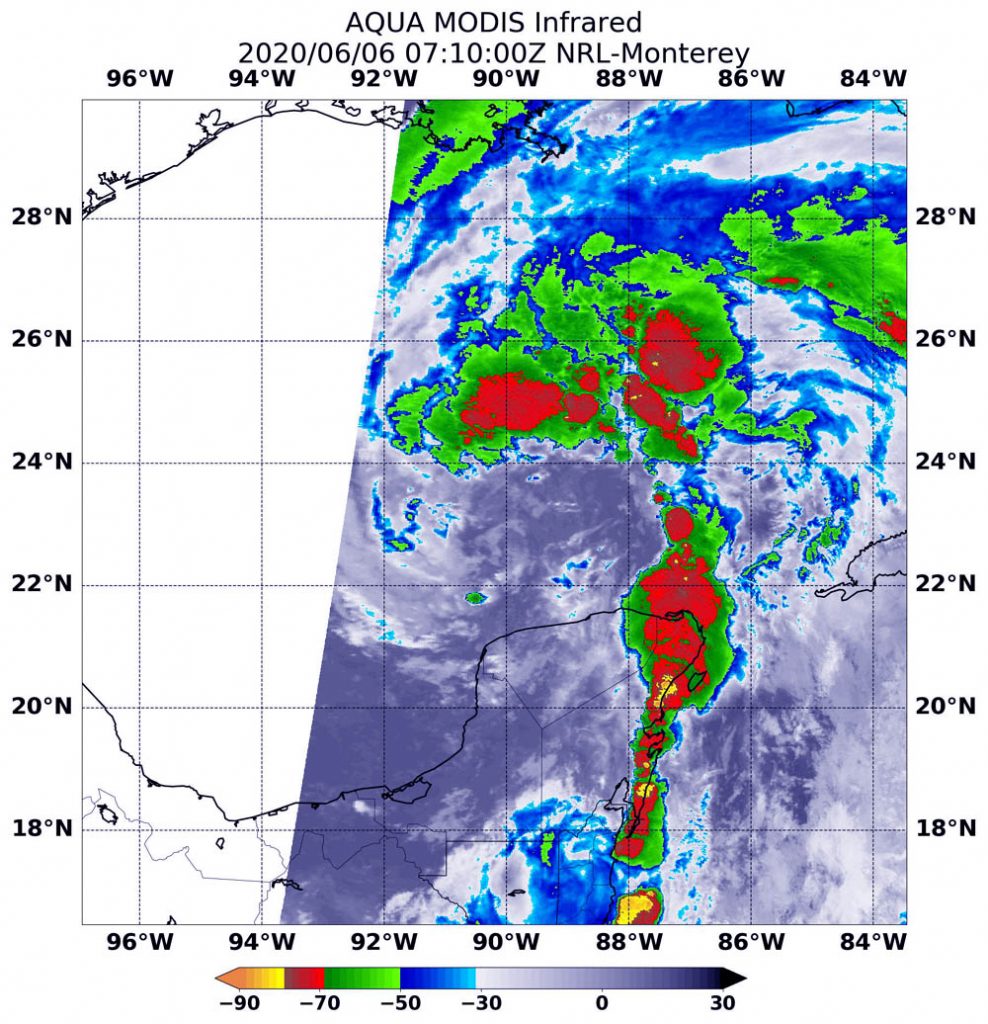
On June 6 at 3:10 a.m. EDT (0710 UTC), the MODIS instrument aboard NASA’s Aqua satellite showed several areas of powerful thunderstorms (red) where temperatures were as cold as or colder than minus 70 degrees Fahrenheit (minus 56.6 Celsius). All of the strongest storms were over the Gulf of Mexico, with the exception of an area over the northeastern Yucatan Peninsula. Credit: NASA/NRL
The visible image showed the clouds in Cristobal’s eastern quadrant stretched over parts of Florida, while the center was still just north of Mexico’s Yucatan Peninsula. NHC forecaster Jack Beven said in the 5 a.m. EDT discussion, “Satellite imagery this morning shows that Cristobal does not have a classic tropical cyclone structure, probably due to interaction with a mid- to upper-level trough (elongated area of low pressure) and the associated entrainment of dry air (dry air moving into the storm). The circulation is elongated north-south near the center, and multiple low-cloud swirls are preset. In addition, the strongest convection is well removed from the center of Cristobal to the north and east.” The strongest convection and thunderstorms east of center was apparent on infrared imagery.
Infrared MODIS imagery showed several areas of powerful thunderstorms where temperatures were as cold as or colder than minus 70 degrees Fahrenheit (minus 56.6 Celsius). All of the strongest storms were east of Cristobal’s center and over the Gulf of Mexico, with the exception of an area over the northeastern Yucatan Peninsula. Cloud top temperatures that cold indicate strong storms with the potential to generate heavy rainfall.
Cristobal’s Status on June 6, 2020
At 8 a.m. EDT (1200 UTC) on June 6, NOAA’s National Hurricane Center noted that the center of Tropical Storm Cristobal was located near latitude 23.9 degrees north and longitude 90.2 degrees west. That puts the center of Cristobal about 365 miles (590 km) south of the mouth of the Mississippi River.
Cristobal is moving toward the north near 12 mph (19 kph), and this general motion is expected to continue for the next couple of days. Maximum sustained winds are near 50 mph (85 kph) with higher gusts. Some additional slow strengthening is forecast until landfall occurs on the northern Gulf coast. The minimum central pressure estimated from Air Force Hurricane Hunter aircraft observations is 992 millibars.
Cristobal’s Forecast Path
On the NHC forecast track, the center of Cristobal will move northward over the central Gulf of Mexico today, and will be near the northern Gulf of Mexico coast on Sunday, June 7. Cristobal’s center is then forecast to move inland across Louisiana late Sunday and Monday morning, and across Arkansas Monday afternoon and Monday night (June 8).
Typhoons/hurricanes are the most powerful weather events on Earth. NASA’s expertise in space and scientific exploration contributes to essential services provided to the American people by other federal agencies, such as hurricane weather forecasting.
June 05, 2020 – NASA Analyzes Cristobal, the Big Rainmaker
NASA’s Aqua satellite gathered infrared imagery and cloud top temperature data on Tropical Depression Cristobal, and it revealed the heavy rainmaking capability of the storm.
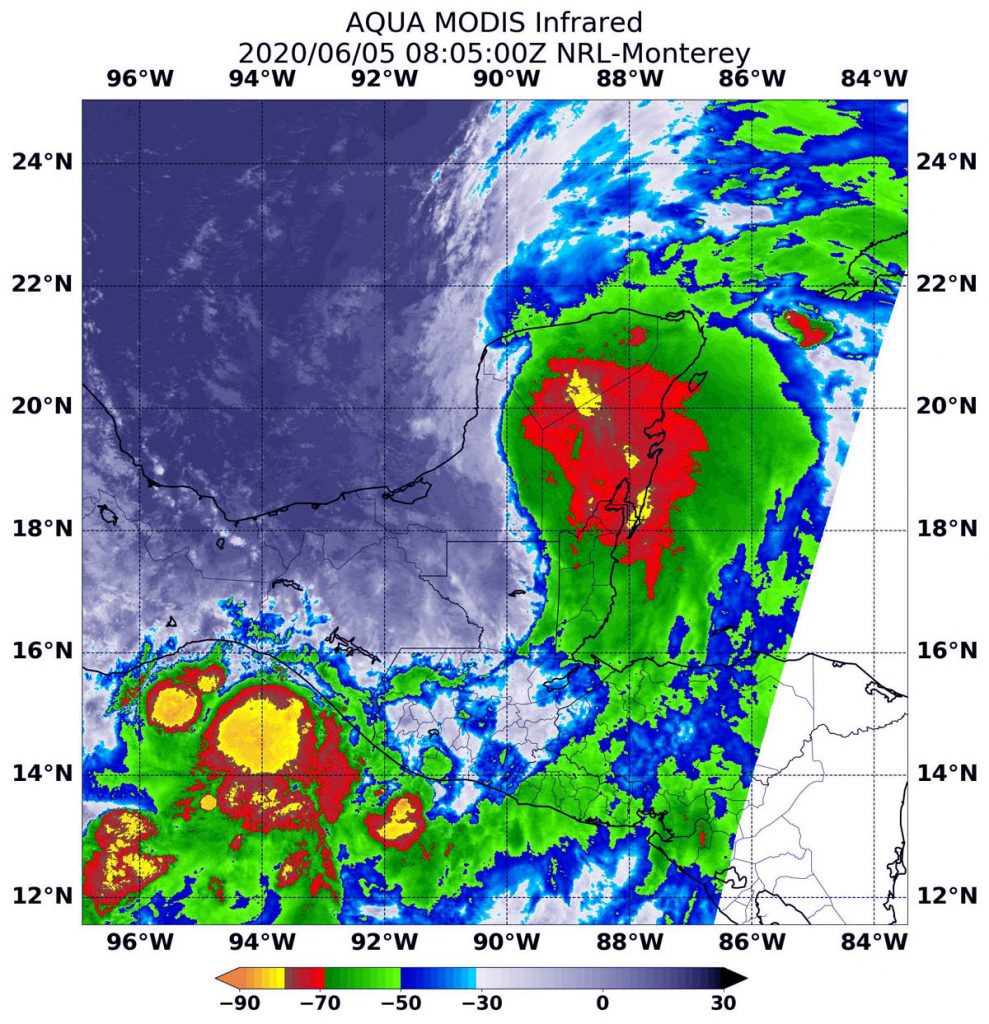
On June 5 at 4:05 a.m. EDT (0805 UTC), the MODIS instrument aboard NASA’s Aqua satellite gathered temperature information about Tropical Depression Cristobal’s cloud tops. MODIS found several areas of powerful thunderstorms (yellow and red) where temperatures were as cold as or colder than minus 70 degrees Fahrenheit (minus 56.6 Celsius). Credit: NASA/NRL
The National Hurricane Center (NHC) forecasts Cristobal to track northward through the Gulf of Mexico and toward Louisiana’s coast. Watches and warnings have gone into effect.
On June 5, the NHC issued a Storm Surge Watch for the northern Gulf of Mexico coast from Indian Pass to Arepika, Florida, and from Grand Isle, Louisiana, to Ocean Springs, Mississippi, including Lake Borgne. In addition, a Tropical Storm Watch has been issued for the northern Gulf of Mexico coast from Intracoastal City Louisiana to the Alabama/Florida border, including Lake Pontchartrain and Lake Maurepas.
Infrared Imagery and Cloud Top Temperatures
NASA’s Aqua satellite used infrared light to analyze the strength of storms in Cristobal. Infrared data provides temperature information, and the strongest thunderstorms that reach high into the atmosphere have the coldest cloud top temperatures. On June 5 at 4:05 a.m. EDT (0805 UTC), the Moderate Resolution Imaging Spectroradiometer or MODIS instrument aboard NASA’s Aqua satellite gathered temperature information about Cristobal’s cloud tops.
MODIS found several areas of powerful thunderstorms where temperatures were as cold as or colder than minus 70 degrees Fahrenheit (minus 56.6 Celsius). Cloud top temperatures that cold indicate strong storms with the potential to generate heavy rainfall. Those areas were located over Mexico’s Yucatan Peninsula, northeastern Guatemala, and out over the Eastern Pacific Ocean just off the coast of the Mexican states of Chiapas and Oaxaca.
NHC rainfall forecasts for Mexico’s Yucatan and Central America called for large quantities of rainfall. NHC noted of expected rainfall, “Mexican states of Campeche, Quintana Roo, and Yucatan…Additional 4 to 6 inches, isolated storm totals of 25 inches. Belize and the Mexican states of Tabasco and Oaxaca…Additional 4 to 6 inches, isolated storm totals of 12 inches. Southern Guatemala, coastal portions of Chiapas, and El Salvador…Additional 4 to 6 inches, isolated storm total amounts of 35 inches dating back to Saturday, May 30. Southern parts of Honduras…Additional 3 to 4 inches, isolated 8 inches.” Rainfall across Southeast Mexico and northern Central America would continue the risk of life-threatening flash floods and mudslides.
NHC forecasters said, as Cristobal moves north through the Gulf of Mexico, “Through Wednesday morning, for portions of the eastern and central Gulf Coast and the lower Mississippi Valley, rainfall accumulations of 4 to 8 inches, with local amounts to 12 inches, are forecast.”
Cristobal’s Status on June 5, 2020
The NHC said at 11 a.m. EDT (1500 UTC) on June 5, the center of Tropical Depression Cristobal was located near latitude 20.0 degrees north and longitude 89.9 degrees west. That puts the center about 40 miles (65 km) east of Campeche, Mexico. The depression was moving toward the north near 12 mph (19 kph), and this general motion is expected to continue for the next couple of days. The estimated minimum central pressure is 1000 millibars. Maximum sustained winds are near 35 mph (55 kph).
NHC Forecast for Cristobal
On the NHC forecast track, the center will move back over the southern Gulf of Mexico this evening, over the central Gulf of Mexico on Saturday, and be near the northern Gulf of Mexico coast Sunday evening. Some strengthening is forecast during the next 48 hours, and Cristobal is expected to regain tropical storm strength later today. Some additional strengthening is forecast thereafter.
Typhoons/hurricanes are the most powerful weather events on Earth. NASA’s expertise in space and scientific exploration contributes to essential services provided to the American people by other federal agencies, such as hurricane weather forecasting.
“Effective 8:00 am Friday June 5, 2020 Stennis Space Center (SSC) will enter into Hurricane Condition III until further notice. In Hurricane Condition III, SSC is in a heightened state of awareness for potential dangerous weather conditions due to the effects of Tropical Storm Cristobal over the next 2 to 3 days. All employees should stay weather aware and monitor local weather for any changes in the forecast.”
June 04, 2020 – NASA Infrared Imagery Indicates Cristobal’s Heavy Rainmaking Capabilities
One of the ways NASA observes tropical cyclones is by using infrared data that provides temperature information and indicates storm strength. The AIRS instrument aboard NASA’s Aqua satellite gathered that data and revealed Cristobal has the potential to generate heavy rainfall. That rainfall is now soaking Mexico and portions of Central America as Cristobal meanders.
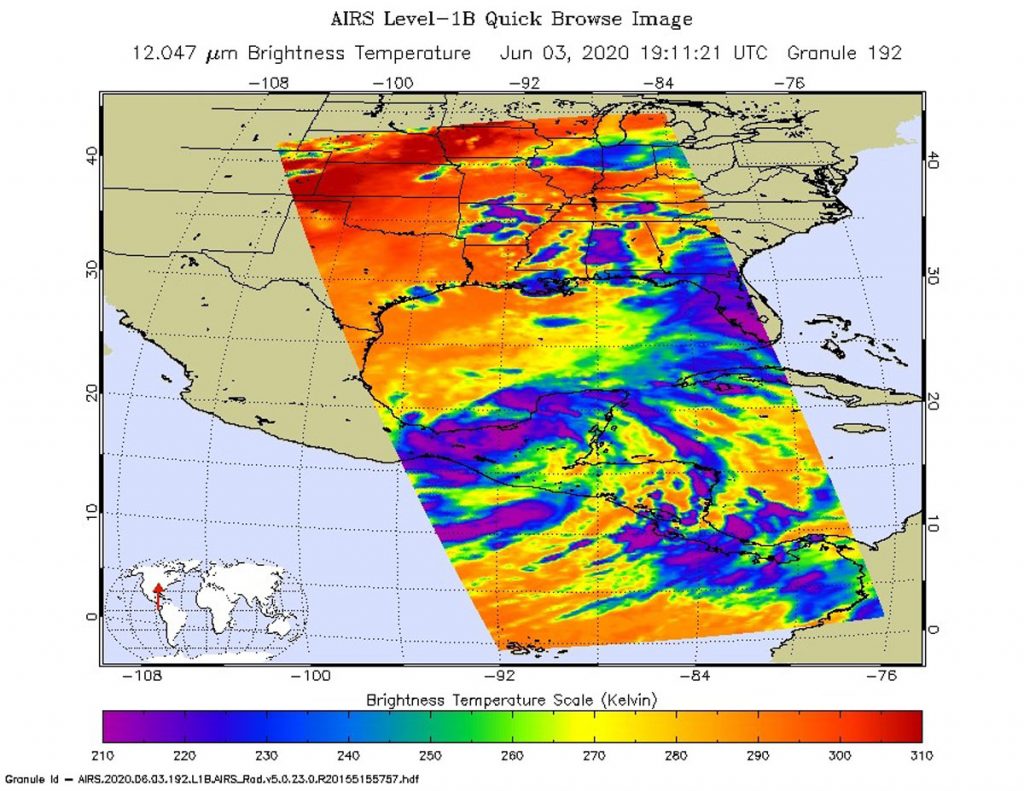
On June 3 at 3:11 p.m. EDT (1911 UTC) NASA’s Aqua satellite analyzed Tropical Storm Cristobal using the Atmospheric Infrared Sounder or AIRS instrument. AIRS found coldest cloud top temperatures as cold as or colder than (purple) minus 63 degrees Fahrenheit (minus 53 degrees Celsius) east of center over Mexico’s Yucatan Peninsula. Credit: NASA JPL/Heidar Thrastarson
At 9:35 a.m. EDT on Wednesday, June 3, Tropical Storm Cristobal made landfall in the Mexican state over Campeche, just to the west of Ciudad del Carmen. At the time of landfall, maximum winds were estimated to be 60 mph (95 kph) with higher gusts. Since landfall, Cristobal weakened to a depression, and moved very slowly in a southeasterly direction into northwestern Guatemala. As the storm weakened, it expanded, now heavy rainfall is expected in Mexico, Guatemala, El Salvador, Belize and Honduras.
Damaging and deadly flooding has already been occurring in portions of Mexico and Central America. Cristobal is expected to produce additional extreme rainfall amounts through the end of the week.
Colder Cloud Top Temperatures Indicate Strength
Cloud top temperatures provide information to forecasters about where the strongest storms are located within a tropical cyclone. Tropical cyclones do not always have uniform strength, and some sides are stronger than others. The stronger the storms, the higher they extend into the troposphere, and the colder the cloud temperatures.
NASA provides this infrared data to forecasters at NOAA’s National Hurricane Center (NHC) so they can incorporate in their forecasting. That data is reflected in the NHC forecasts of rainfall amounts.
On June 3 at 3:11 p.m. EDT (1911 UTC) NASA’s Aqua satellite analyzed Tropical Storm Cristobal using the Atmospheric Infrared Sounder or AIRS instrument. AIRS found coldest cloud top temperatures as cold as or colder than minus 63 degrees Fahrenheit (minus 53 degrees Celsius) south and east of center, over Mexico’s Yucatan Peninsula. NASA research has shown that cloud top temperatures that cold indicate strong storms that have the capability to create heavy rain.
A Look at Extreme Rainfall Potential
NHC forecasters using infrared and other satellite data noted that Cristobal is expected to produce high rain accumulations through Saturday, June 6. NHC noted,”The Mexican states of Campeche, Quintana Roo, Tabasco, and Yucatan are expected to receive an additional 6 to 12 inches, with isolated storm totals of 25 inches.
Mexican states of Veracruz and Oaxaca can expect an additional 5 to 10 inches, while southern Guatemala and parts of Chiapas can expect an additional 15 to 20 inches, and isolated storm total amounts of 35 inches dating back to Saturday, May 30. El Salvador can also expect an additional 10 to 15 inches, with isolated storm total amounts of 35 inches dating back to Saturday, May 30. In Belize and Honduras, an additional 3 to 6 inches with isolated amounts to 10 inches are forecast.
Rainfall in all of these areas may produce life-threatening flash floods and mudslides.”
Cristobal on June 4, 2020
NOAA’s National Hurricane Center updated Cristobal’s status on June 4 at 11 a.m. EDT (1500 UTC) and noted that since it made landfall on June 3, it had weakened to a depression. The center of Tropical Depression Cristobal was located near latitude 17.6 degrees north and longitude 91.0 degrees west. That places the center of Cristobal about 160 miles (260 km) south-southwest of Campeche, Mexico.
The depression is moving toward the east-southeast near 3 mph (6 kph). The estimated minimum central pressure is 998 millibars. Maximum sustained winds have decreased to near 35 mph (55 kph) with higher gusts. Little change in strength is expected through tonight [June 4]. Re-intensification is expected to begin on Friday.
Cristobal’s Forecast Path
Forecasters at the NHC said that Cristobal is expected to turn back into the Gulf of Mexico after moving over extreme northwestern Guatemala and eastern Mexico today and tonight. The center is forecast to move back over the southern Gulf of Mexico [June 5] Friday day or Friday night, over the central Gulf of Mexico on Saturday, and approach the northern Gulf of Mexico coast [June 7] Sunday day and Sunday night.
The AIRS instrument is one of six instruments flying on board NASA’s Aqua satellite, launched on May 4, 2002.
June 03, 2020 – NASA Finds Heavy Rainfall in Tropical Storm Cristobal
The third tropical cyclone of the Atlantic Ocean basin has been generating large amounts of rainfall over Mexico’s Yucatan and parts of Central America. Using satellite data, NASA analyzed that heavy rainfall and provided forecasters with valuable cloud top temperature data to help assess the strength of the storm.
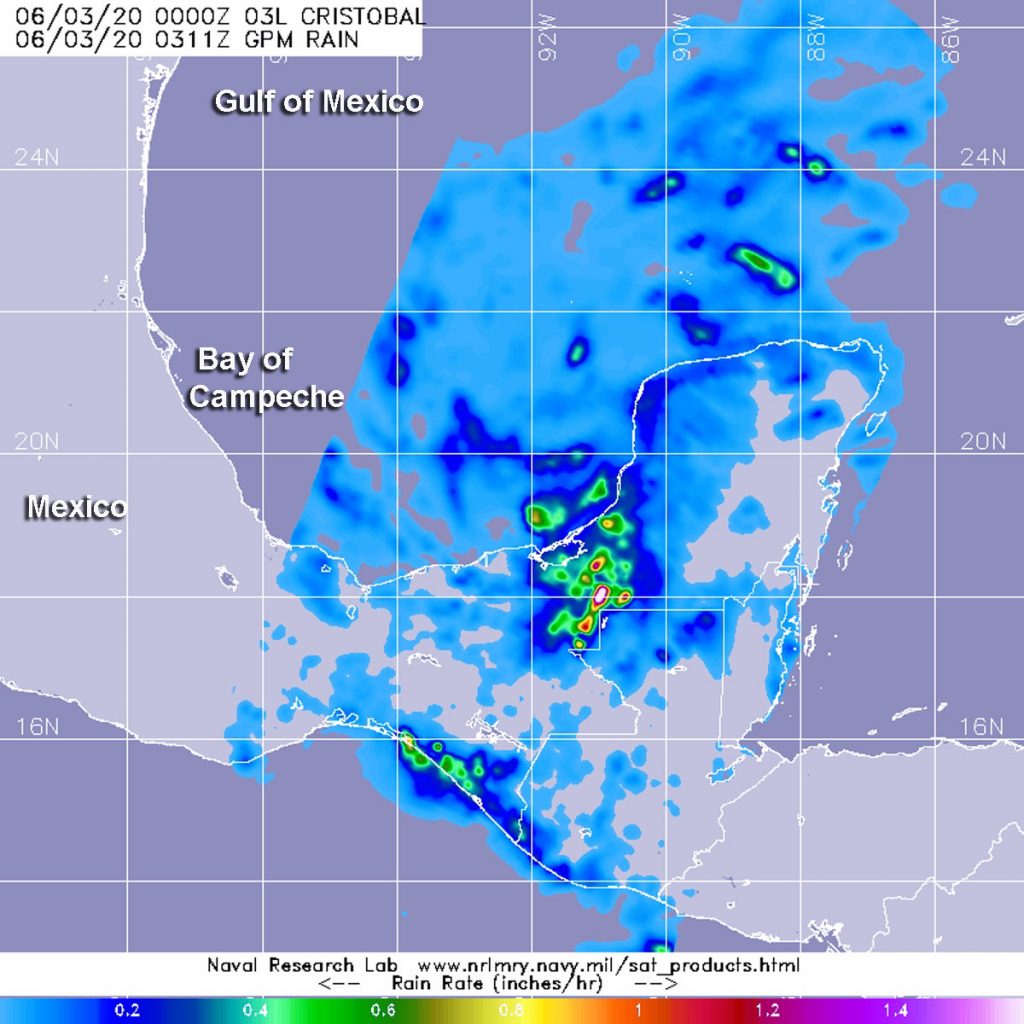
On June 2, 2020, by 2 p.m. EDT, Tropical Depression 03L strengthened into Tropical Storm Cristobal over Mexico’s Gulf of Campeche. The Gulf of Campeche is surrounded by Mexico’s Yucatan Peninsula, and the gulf is part of the southwestern Gulf of Mexico.
GPM satellite provided a look at Cristobal’s rainfall rates on June 3 at 0311 UTC (June 2 at 11:11 p.m. EDT). GPM found heaviest rainfall south of center falling at rates of more than 1 inch (25 mm) per hour over Mexico’s Yucatan Peninsula. Lighter rain rates appear around the entire system. Credit: NASA/NRL
Cristobal remained in the Bay of Campeche on June 3, and a Tropical Storm Warning remained in effect from Campeche to Puerto de Veracruz.
Analyzing Rainfall
The Global Precipitation Measurement mission or GPM satellite provided a look at Cristobal’s rainfall rates on June 3 at 0311 UTC (June 2 at 11:11 p.m. EDT). GPM found heaviest rainfall south of center over Mexico’s Yucatan Peninsula, falling at rates of more than 1 inch (25 mm) per hour. Lighter rain rates appear around the entire system.
Analyzing Cloud Top Temperatures
Another way NASA analyzes tropical cyclones is by using infrared data that provides temperature information. The Moderate Resolution Imaging Spectroradiometer or MODIS instrument aboard NASA’s Aqua satellite provided data on cloud top temperatures of Cristobal.
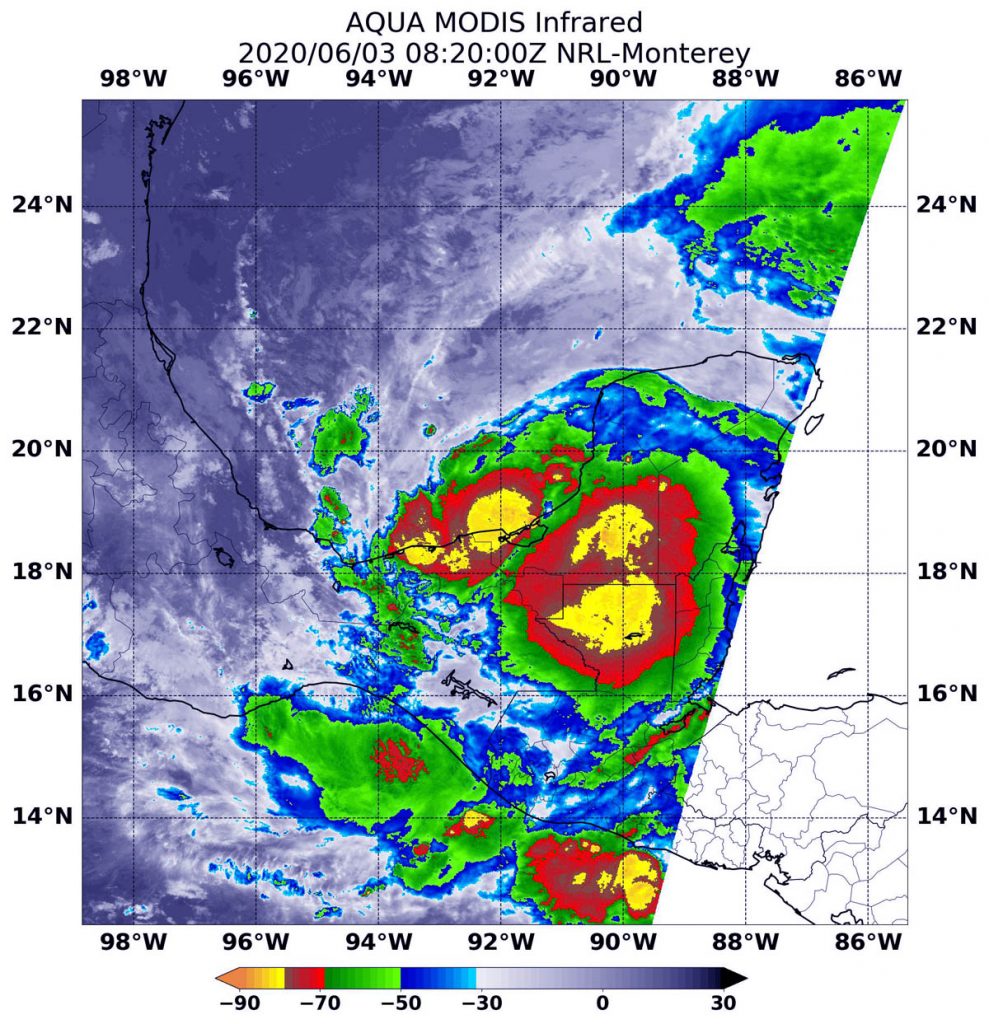
On June 3 at 4:20 a.m. EDT (0820 UTC) NASA’s Aqua satellite analyzed Tropical Storm Cristobal using the MODIS instrument. MODIS found coldest cloud top temperatures (yellow) as cold as or colder than minus 80 degrees Fahrenheit (minus 62.2 Celsius). Credit: NASA
Cloud top temperatures provide information to forecasters about where the strongest storms are located within a tropical cyclone. Tropical cyclones do not always have uniform strength, and some sides are stronger than others. The stronger the storms, the higher they extend into the troposphere, and the colder their cloud top temperatures.
On June 3 at 4:20 a.m. EDT (0820 UTC) NASA’s Aqua satellite analyzed Tropical Storm Cristobal using the MODIS instrument and found coldest cloud top temperatures as cold as or colder minus 80 degrees Fahrenheit (minus 62.2 Celsius). A large area of the strongest storms were located over the Yucatan Peninsula and along the coastline of the Bay of Campeche. NASA research has shown that cloud top temperatures that cold indicate strong storms that have the capability to create heavy rain.
NASA provides data to forecasters at NOAA’s National Hurricane Center or NHC so they can incorporate it in their forecasting.
Cristobal’s Status on June 3, 2020
The National Hurricane Center noted on June 3 at 8 a.m. EDT (1200 UTC), the center of Tropical Storm Cristobal was located by an Air Force Hurricane Hunter aircraft near latitude 18.8 degrees north and longitude 92.1 degrees west. The center was about 25 miles (40 km) northwest of Ciudad Del Carmen, Mexico.
Cristobal was moving toward the southeast near 3 mph (6 kph), and is expected to turn toward the east later in the day. Maximum sustained winds were near 60 mph (95 kph) with higher gusts. Tropical-storm-force winds extended outward up to 60 miles (95 km) from the center. Gradual weakening is forecast while the center remains inland, but re-strengthening is expected after Cristobal moves back over water Thursday night and Friday [June 5]. The minimum central pressure reported by an Air Force Hurricane Hunter aircraft is 994 millibars.
NHC Forecast for Cristobal
A motion toward the north-northeast and north is expected on Thursday and Friday. On the forecast track, the center will cross the southern Bay of Campeche coast later today and move inland over eastern Mexico tonight and Thursday. The center is forecast to move back over the Bay of Campeche Thursday night and Friday.
Tropical cyclones/hurricanes are the most powerful weather events on Earth. NASA’s expertise in space and scientific exploration contributes to essential services provided to the American people by other federal agencies, such as hurricane weather forecasting.
GPM is a joint mission between NASA and the Japan Aerospace Exploration Agency, JAXA. The GPM and Aqua satellites are part of a fleet of NASA Earth observing satellites.
June 02, 2020 – NASA Analyzes Gulf of Mexico’s Reborn Tropical Depression Soaking Potential
Infrared imagery from NASA’s Aqua satellite showed that strong storms from a redeveloped tropical cyclone were soaking parts of Mexico’s Yucatan Peninsula. Tropical Depression 03L is expected to generate heavy rainfall in the region.
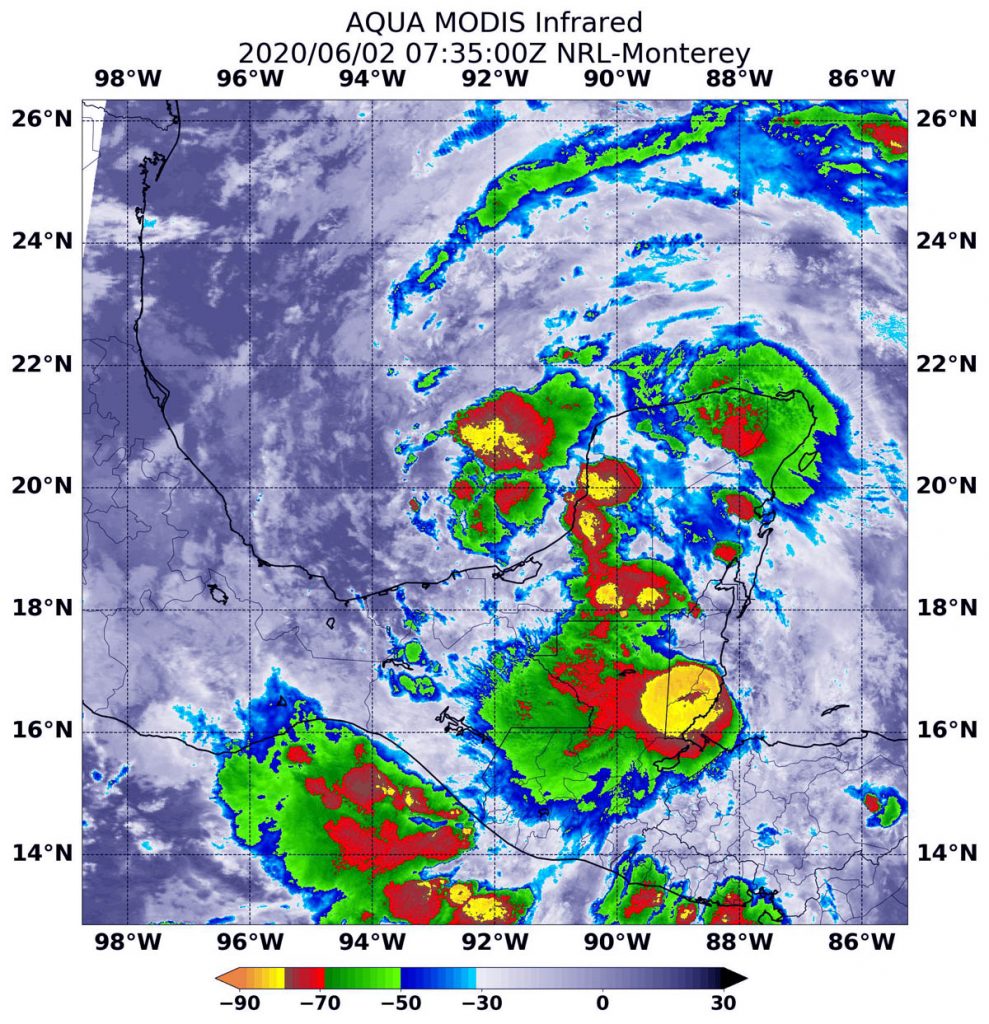
On June 2 at 3:35 a.m. EDT (0735 UTC) the MODIS instrument that flies aboard NASA’s Aqua satellite found coldest cloud top temperatures (yellow) in several areas around Tropical Depression 03L’s center of circulation. They were as cold as or colder than minus 80 degrees Fahrenheit (minus 62.2 Celsius). One area of strong storms were off the coast and over the Bay of Campeche, Gulf of Mexico. Several other areas were over Mexico’s Yucatan Peninsula. Credit: NASA/NRL
On June 2, a Tropical Storm Warning is in effect from Campeche to Puerto de Veracruz, Mexico.
The Atlantic Ocean saw the development of Tropical Depression 03L on June 2 in the Bay of Campeche, Gulf of Mexico. However, it is not the first go-round for this system, though. Tropical Depression 03L formed from a former eastern Pacific Ocean tropical storm. On Sunday, May 31, Tropical Storm Amanda,that formed along the coast of Guatemala made landfall and dissipated over land. The remnants moved north and slid into the Bay of Campeche where it reformed into a tropical depression in the Atlantic Ocean basin, getting the number 03L.
Tropical cyclones/hurricanes are made of up hundreds of thunderstorms, and infrared data can show where the strongest storms are located. They can do that because infrared data provides temperature information, and the strongest thunderstorms that reach highest into the atmosphere have the coldest cloud top temperatures. Convection is rising air that condenses and forms the thunderstorms that make up a tropical cyclone. When it is strong, it pushes clouds higher into the troposphere (the layer of atmosphere closest to Earth’s surface). The higher you go in the troposphere, the colder the air temperature gets, so colder cloud tops indicate stronger, higher storm cloud tops.
On June 2 at 3:35 a.m. EDT (0735 UTC), the Moderate Resolution Imaging Spectroradiometer or MODIS instrument that flies aboard NASA’s Aqua satellite found coldest cloud top temperatures in several areas around Tropical Depression 03L’s center of circulation. They were as cold as or colder than minus 80 degrees Fahrenheit (minus 62.2 Celsius). One area of strong storms were off the coast and over the Bay of Campeche, Gulf of Mexico. Several other areas were over Mexico’s Yucatan Peninsula. NASA research has found that cloud top temperatures that cold indicate strong storms with the potential to generate heavy rainfall.
That life-threatening heavy rainfall and flooding continues over portions of Mexico and Central America, according to the National Hurricane Center (NHC).
NHC said, “Tropical Depression Three is expected to produce total rain accumulations of 10 to 20 inches with isolated maximum amounts of 25 inches over parts of the Mexican states of Tabasco, Veracruz, and Campeche. The depression is also expected to produce total rain accumulations of 10 to 15 inches over northern Chiapas and other Mexican states, Quintana Roo and Yucatan. Additional rainfall of 10 to 15 inches, with isolated amounts of 25 inches is expected along the Pacific coasts of Chiapas, Guatemala, and El Salvador. Some of these Pacific locations received 20 inches of rain over the weekend, and storm total amounts of 35 inches are possible. Rainfall in all of these areas may produce life-threatening flash floods and mudslides.”
At 11 a.m. EDT (1500 UTC), on June 2, the center of Tropical Depression 03L was located near latitude 19.5 degrees north and longitude 92.6 west. That is about 140 miles (225 km) west of Campeche Mexico.
The depression is moving toward the west near 3 mph (6 kph). The depression is forecast to move slowly southwestward or southward this afternoon and tonight, and meander over the southern Bay of Campeche through late Wednesday. On the forecast track, the center of the cyclone is forecast to be near the coast of the southern Bay of Campeche tonight through Thursday. Maximum sustained winds are near 35 mph (55 kph) with higher gusts. Some strengthening is forecast during the next 48 hours, and the depression is likely to become a tropical storm today. The minimum central pressure reported by an Air Force Hurricane Hunter plane is 1005 millibars.
Tropical cyclones/hurricanes are the most powerful weather events on Earth. NASA researches these storms to determine how they rapidly intensify, develop and behave. NASA’s expertise in space and scientific exploration contributes to essential services provided to the American people by other federal agencies, such as hurricane weather forecasting.