Sep. 20, 2018 – NASA Storm Analysis of Florence from a Suite of Satellites
Using Earth-observing satellite data, our researchers have been keeping an eye on the amount of rain that fell from #HurricaneFlorence. We have been analyzing the storm, providing a steady stream of information to the Federal Emergency Management Agency (FEMA), the National Guard, and other state and federal agencies “to help assess the hurricane’s impact. Learn more about how we study these storms: https://blogs.nasa.gov/disaster-response/2018/09/17/nasa-tracking-florence-from-every-angle-and-wavelength/
Credit: NASA
Sep. 19 #2 – A Broad View of Flooding in the Carolinas
Before and after Hurricane Florence swept through the Carolinas, the Operational Land Imager (OLI) on the Landsat 8 satellite observed several residential areas and major rivers. The image below shows the Trent River on September 19, 2018. The false-color image use a combination of visible and infrared light (bands 6-5-4) to make it easier to distinguish between flood waters and land.
For more on this story visit: https://earthobservatory.nasa.gov/images/92786/a-broad-view-of-flooding-in-the-carolinas

Sep. 19, 2018 #1 – Florence Inundates the Carolinas

Upon making landfall on the southeastern U.S. coast on September 14, 2018, Hurricane Florence brought strong winds and torrential rains that flooded roads, houses, and rivers to historic levels and left hundreds of thousands of people without power. NASA data and researchers observed and analyzed the event, providing a steady stream of information to the Federal Emergency Management Agency (FEMA) and the National Guard to help assess the hurricane’s impact.
For the whole story visit: https://earthobservatory.nasa.gov/images/92775/florence-inundates-the-carolinas?src=eoa-iotd
Sep. 18, 2018 #2 – Dramatic Soil Moisture Transformation over North Carolina Associated with Flooding Rainfall from Hurricane Florence

As anticipated, Hurricane Florence resulting in monumental rainfall totals, particularly across southern and eastern North Carolina. This past week’s rainfall totals are depicted in Figure 1, derived from the NOAA/National Weather Service Advanced Hydrologic Prediction Service (AHPS). Widespread totals exceeded 10” across most of southern/eastern North Carolina and far eastern South Carolina, with maximum rainfall of more than 20” along and within a few counties of the Atlantic Coast.
For more on this story visit: https://nasasport.wordpress.com/2018/09/18/dramatic-soil-moisture-transformation-over-north-carolina-associated-with-flooding-rainfall-from-hurricane-florence/
Sep. 18, 2018 #1 – NASA Sees Fading Florence’s Stretched-Out Strongest Storms
NASA’s Aqua satellite provided an infrared look at fading Post-Tropical Cyclone Florence’s clouds, revealing where the strongest thunderstorms were located. Those strong thunderstorms stretched from the Mid-Atlantic to New England.
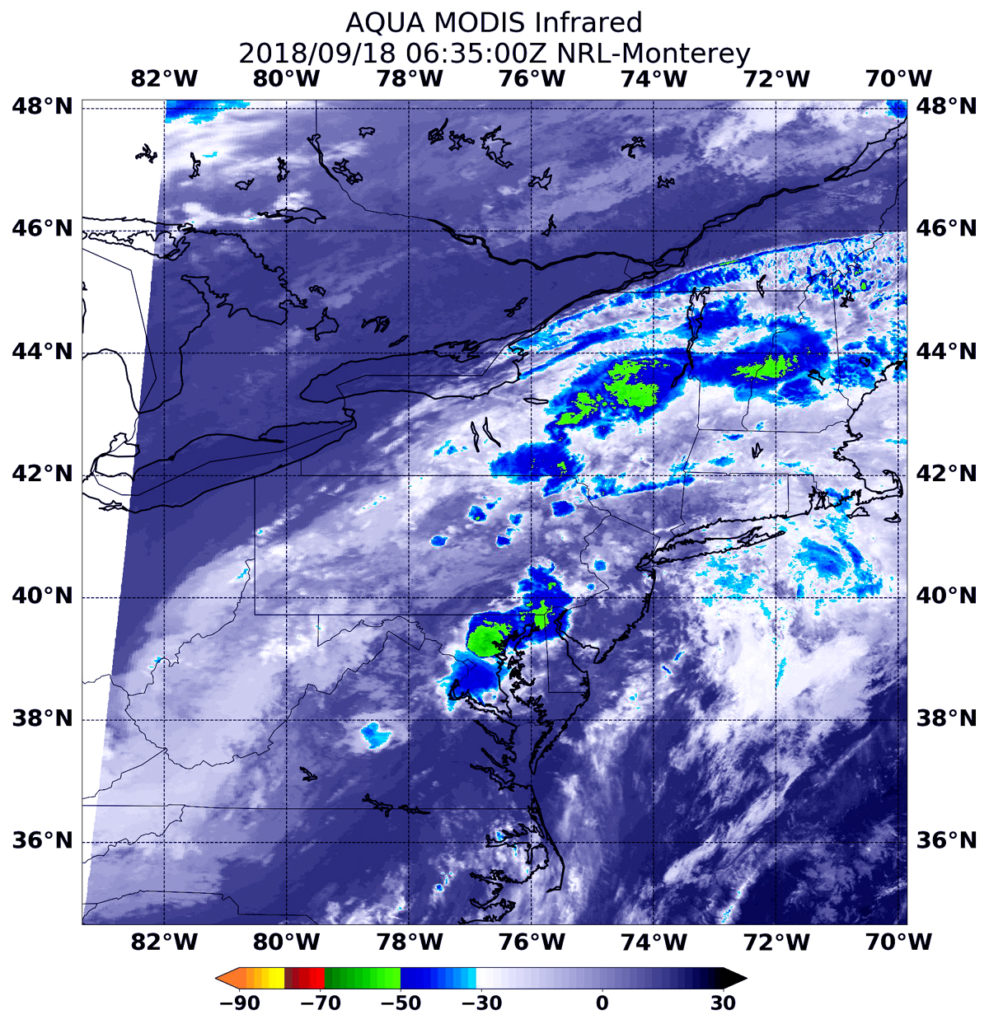
On Sept. 18, Florence is becoming an increasingly elongated low pressure area while it generates heavy rain over parts of the Mid-Atlantic and into southern New England today. Flash flood watches are in effect for portions of the Mid-Atlantic States and southern New England.
At 2:35 a.m. EDT (0635) on Sept. 18, the Moderate Resolution Imaging Spectroradiometer or MODIS instrument aboard NASA’s Aqua satellite analyzed Post-Tropical Cyclone Florence in infrared light. MODIS found several areas of coldest cloud top temperatures and strongest storms located over several U.S. states: Maryland, Delaware, northeastern upstate New York, central Vermont and New Hampshire.
Those cloud top temperatures were as cold as or colder than minus 63 degrees Fahrenheit (minus 53 degrees Celsius). NASA research has found that cloud top temperatures as cold as or colder than the 63F/53C threshold have the capability to generate heavy rainfall.
The National Weather Service’s Weather Prediction Center (WPC) in College Park, Md. issued the final advisory on Florence at 11 a.m. EDT.
At 11 a.m. EDT on Sept. 18 Florence’s center of circulation was just 45 miles west-northwest of Boston, Mass. near latitude 42.6 degrees north and longitude 71.9 degrees west. The post-tropical cyclone is moving toward the east-northeast near 30 mph (41 kph) and this motion is expected to increase as the low moves east into the western Atlantic later today. Maximum sustained winds are near 25 mph (35 kph) with higher gusts.
The low will transition into a trough or elongated area of low pressure, off the East Coast tomorrow.
By Rob Gutro
NASA Goddard Space Flight Center
Sep. 17, 2018 #3 – NASA Data Shows Florence Brings Torrential Rains and Record Flooding to the Carolinas
NASA estimated the precipitation generated by Hurricane Florence from Sept. 10 through 17 as it approached North Carolina and days after it made landfall. On Sept. 17, Florence’s remnant rainfall was moving up the Appalachian Mountains into the Mid-Atlantic.
Credit: NASA/JAXA, Hal Pierce
Florence’s History
After making its way across the Atlantic, Florence, a once powerful Category 4 hurricane with maximum sustained winds reported at 140 mph by the National Hurricane Center (NHC), finally made landfall early Friday morning at around 7:15 a.m. EDT September 14th near Wrightsville Beach on the coast of North Carolina just east of Wilmington.
Although its maximum sustained winds had decreased to 90 mph when it made landfall, making it a Category 1 storm, Florence was still a very dangerous storm with a peak wind gust of 105 mph recorded at Wilmington, No. Carolina. By this time, Florence was a large storm with a large wind field.
Having undergone an eyewall replacement cycle on Sept. 11, wherein a new eyewall forms and replaces the original inner eyewall, Florence traded some of its peak intensity for size before reaching the coast. This kept the storm surge threat high even though the peak winds were down. New Bern, No. Carolina was hit by a reported 10 foot storm surge, which stranded many residents. In addition to its large size, Florence also slowed down as it approached the coast, allowing a good portion of its circulation to remain over water as it slowly made its way inland. This set the stage for a major flooding event over the Carolinas and was well forecast by NHC.
NASA Estimates Florence’s Massive Rainfall
The Integrated Multi-satellitE Retrievals for GPM or IMERG is used to make estimates of precipitation from a combination of passive microwave sensors, including the GMI microwave sensor onboard the GPM or Global Precipitation Measurement mission satellite, and geostationary IR (infrared) data. GPM is a joint mission between NASA and the Japan Aerospace Exploration Agency, JAXA.
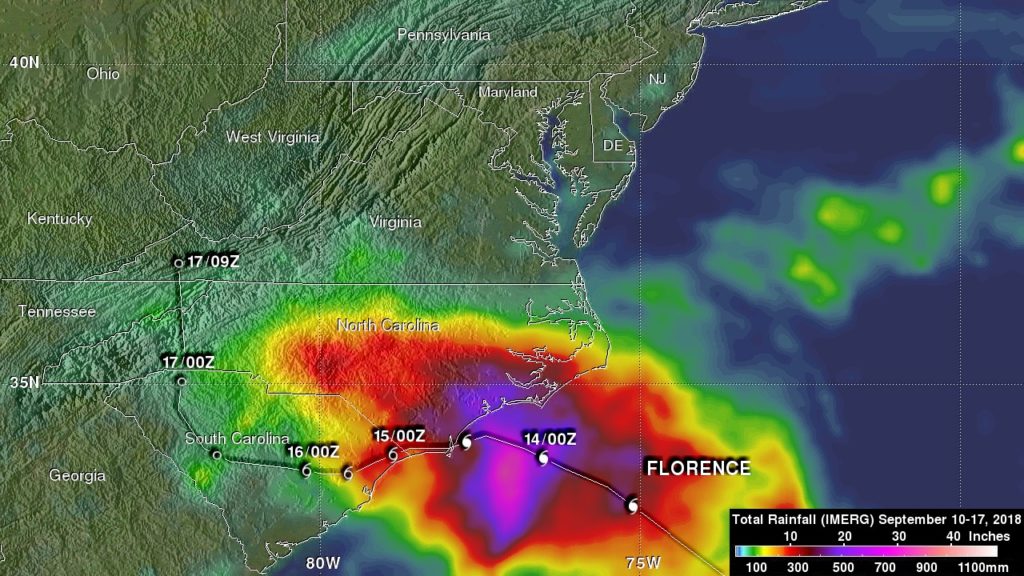
NASA’s IMERG estimated Florence’s rainfall from Sept. 10 to 17, 2018. IMERG estimates show on the order of 250 mm of rain (~10 inches, shown in red) or more reaching inland over most of central and southern No. Carolina as well as the northeast corner of So. Carolina. However, along the southeast coast of North Carolina between Cape Fear and Cape Lookout rainfall amounts are much higher, IMERG estimates are on the order of 500 mm (~20 inches, shown in purple) or more. Locally, upwards of 30 inches of rain were reported in parts of North Carolina with reports of over 35 and 33 inches in Elizabethtown and Swansboro, respectively. Credit: NASA/JAXA, Hal Pierce
In an image created at NASA’s Goddard Space Flight Center in Greenbelt, Md. the IMERG rainfall estimates associated with Florence for the 1-week period from Sept. 10 to 17 covered the central U.S. East Coast region where the storm came ashore. IMERG estimates show on the order of 250 mm of rain (~10 inches) or more reaching inland over most of central and southern North Carolina as well as the northeast corner of South Carolina.
However, along the southeast coast of North Carolina between Cape Fear and Cape Lookout rainfall amounts were much higher. There, where persistent rain bands rotated onshore bringing continuous bands of heavy rains onto the coast, IMERG estimates are on the order of 500 mm (~20 inches) or more. Locally, upwards of 30 inches of rain were reported in parts of North Carolina with reports of over 35 and 33 inches in Elizabethtown and Swansboro, respectively.
Record Rainfall in Wilmington, No. Carolina
As a result of receiving over 26 inches of rain from Florence, Wilmington set a new yearly rainfall record. The result of all of this rain has been record or major flooding along many of the rivers in North Carolina. At one point, Wilmington, No. Carolina was reportedly cut off. So far, Florence is being blamed for 20 fatalities.
Warnings and Watches Continue
At 11 a.m. EDT on Sept. 17, NOAA’s National Weather Service Weather Prediction Center (WPC) in College Park, Md. issued the latest update on Tropical Depression Florence.
WPC said flash flood warnings are currently in effect across parts of central North Carolina into far southern Virginia. Flash flood watches are in effect across much of North Carolina, northern South Carolina, portions of Western Virginia, southern and eastern West Virginia, central and western Maryland, central and western Pennsylvania, southern New York and southern New England.
Status of Tropical Depression Florence on Sept. 17
At 11 a.m. EDT on Sept. 17 the WPC said,”Florence continues to produce heavy rain over parts of the Mid-Atlantic region. Flash flooding continues over the Carolinas and may develop across parts of the Delmarva Peninsula into Pennsylvania today.”
At 1100 AM EDT (1500 UTC), the center of Tropical Depression Florence was located near latitude 38.5 degrees north and longitude 82.9 degrees west. That’s about 240 miles (385 km) west of Charlottesville, Virginia. The depression is moving toward the northeast near 15 mph (24 kph) and is forecast to become extratropical late today while accelerating to the east-northeast. Maximum sustained winds are near 25 mph (35 kph) with higher gusts. Little change in strength is forecast until the low moves into the western Atlantic by early Wednesday. The estimated minimum central pressure is 1008 millibars.
More Rain from Florence over Next Few Days
The WPC forecast stated: “Florence is expected to produce heavy to excessive rainfall over the next couple of days. Portions of the Mid-Atlantic states west of Interstate 95 into southern New York and southern New England are expected to receive an additional 2 to 4 inches of rain with isolated maximum amounts of 6 inches possible.”
For more information on rainfall totals please see the Storm Summary available at: www.wpc.ncep.noaa.gov/discussions/nfdscc4.html
By Stephen Lang / Rob Gutro (SSAI/NASA GSFC)
NASA’s Goddard Space Flight Center
Sep. 17, 2018 #2 -“Split Frame” of Hurricane Florence’s Record-setting Rainfall
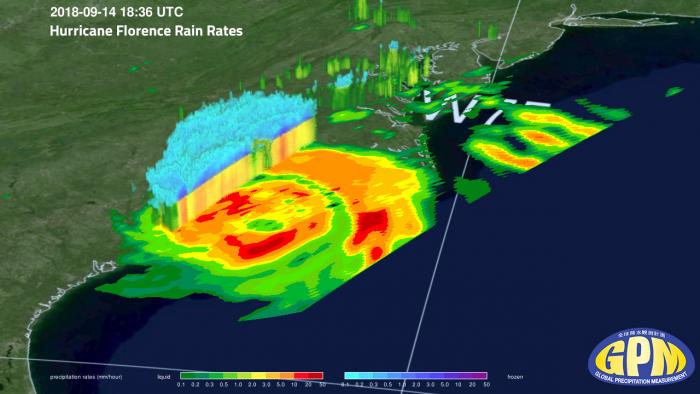
For days, Hurricane Florence’s relentless bands of heavy rain fell on North Carolina, as shown in these satellite-based estimates of precipitation from NASA’s IMERG algorithm. The left side of the screen shows the storm-total rainfall rising, starting on Thursday, September 13, at 9AM EDT. The right side of the screen tracks the storm using a 3-hour-average rain rate throughout the duration of the storm. Hurricane Florence’s abrupt slowdown near landfall in North Carolina is easily discernable in the 3-hour rain rate. NASA Goddard generates these realtime estimates by calibrating, merging, and morphing data from the international constellation of rain-observing satellites in Earth orbit. Credit: NASA
Sep. 17, 2018 #1 – Hurricane Florence Resources – GPM Core Observatory and Constellation Satellite Rain Rates
For more information on this story and details on the Global Precipitation Measurement mission visit: https://disasters.nasa.gov/hurricane-florence-2018/hurricane-florence-resource-gpm-core-observatory-and-constellation-satellite
Sep. 16, 2018 – NASA Sees Florence Still Dropping Heavy Rain Over North Carolina
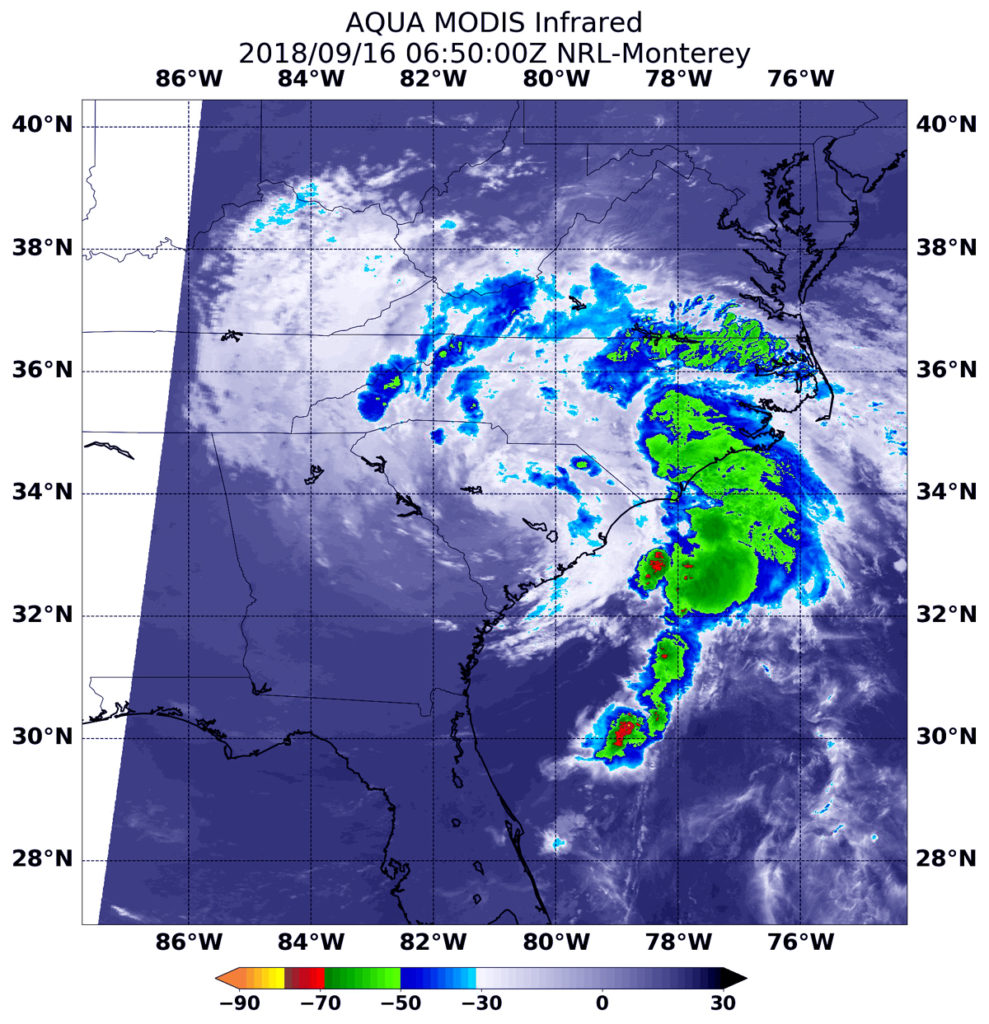
Although now a tropical depression centered over South Carolina, bands of thunderstorms spinning around its center continue to drench North Carolina on Sunday, Sept. 16. Infrared imagery from NASA’s Aqua satellite showed the location of the strongest storms feeding into Florence’s center with the capability to generate more heavy rain in an already soaked region.
The National Hurricane Center noted that flooding rains are the biggest threat now from Tropical Depression Florence as it continues to linger over the Carolinas. Today, Sunday, Sept. 16, there are no longer any coastal watches or warnings in effect. However, interests in the southeastern and mid-Atlantic states should monitor the progress of Florence due to the heavy rainfall threat.
What Satellite Data Shows
As Tropical Depression Florence’s center lingered over South Carolina, bands of thunderstorms north of the center were wrapping from the Atlantic over North Carolina and continuing to drop heavy amounts of rainfall.
Infrared satellite data at 2:50 a.m. EDT (0650 UTC) on Sept. 16 the Moderate Resolution Imaging Spectroradiometer or MODIS instrument aboard NASA’s Aqua satellite revealed strongest storms with the coldest cloud top temperatures north and east of Florence’s center. Those storms straddled the North Carolina and Virginia border and were in a thick band of thunderstorms extended from Goldsboro to coastal Jacksonville and south to Wilmington, No. Carolina and out over the Atlantic Ocean.
MODIS found coldest cloud tops had temperatures near minus 63 degrees Fahrenheit (minus 53 degrees Celsius). NASA research has found that cloud top temperatures that cold have the capability to generate heavy rainfall.
What is the Expected Rainfall?
The National Hurricane Center said: “Florence is expected to produce heavy and excessive rainfall in central and western North Carolina into far southwest Virginia.
An additional 5 to 10 inches, with storm total accumulations of 15 to 20 inches in western North Carolina. These rainfall amounts will produce catastrophic flash flooding, prolonged significant river flooding, and an elevated risk for landslides in western North
Carolina and far southwest Virginia. In southern North Carolina into northern South Carolina, an additional 4 to 6 inches, with isolated totals of 8 inches are forecast. This rainfall will result in additional flash flooding while also exacerbating the river flooding. Storm total accumulations of 30 to 40 inches in southeast North Carolina.
And in west-central Virginia, north of Roanoke and west of Charlottesville rainfall of 2 to 4 inches, with isolated totals to 6 inches can be expected. This rainfall will result in flash flooding and potentially lead to some river flooding.”
Other Hazards Remaining from Florence
Other hazards include a few tornadoes possible across North Carolina and eastern South Carolina today and tonight and ocean swells. Swells generated by Florence are affecting Bermuda, portions of the U.S. East Coast, and the northwestern and central Bahamas. These swells are likely to cause life-threatening surf and rip current conditions.
Location of Florence on Sunday, September 16, 2018
At 5 a.m. EDT (0900 UTC), the center of Tropical Depression Florence was located near latitude 33.8 degrees north and longitude 81.4 degrees west. That puts the center of Florence’s circulation about 20 miles (35 km) southwest of Columbia, South Carolina.
Maximum sustained winds have decreased to near 35 mph (55 kph) with higher gusts. Continued gradual weakening is forecast during the next couple of days.
Where Is Florence Going?
The depression is moving toward the west near 8 mph (13 kph). A turn toward the northwest with an increase in forward speed is expected today, followed by a turn toward the north and northeast with an additional increase in forward speed on Monday. That’s because the high pressure area that was blocking Florence from moving north is sliding east over the Atlantic Ocean, allowing the storm to move north then east.
On the forecast track, Florence’s center will move across the western Carolinas today and then recurve over the Ohio Valley and Northeast U.S. Monday and Tuesday.
For updates on Florence, visit: www.nhc.noaa.gov
By Rob Gutro (with information from the NHC)
NASA Goddard Space Flight Center
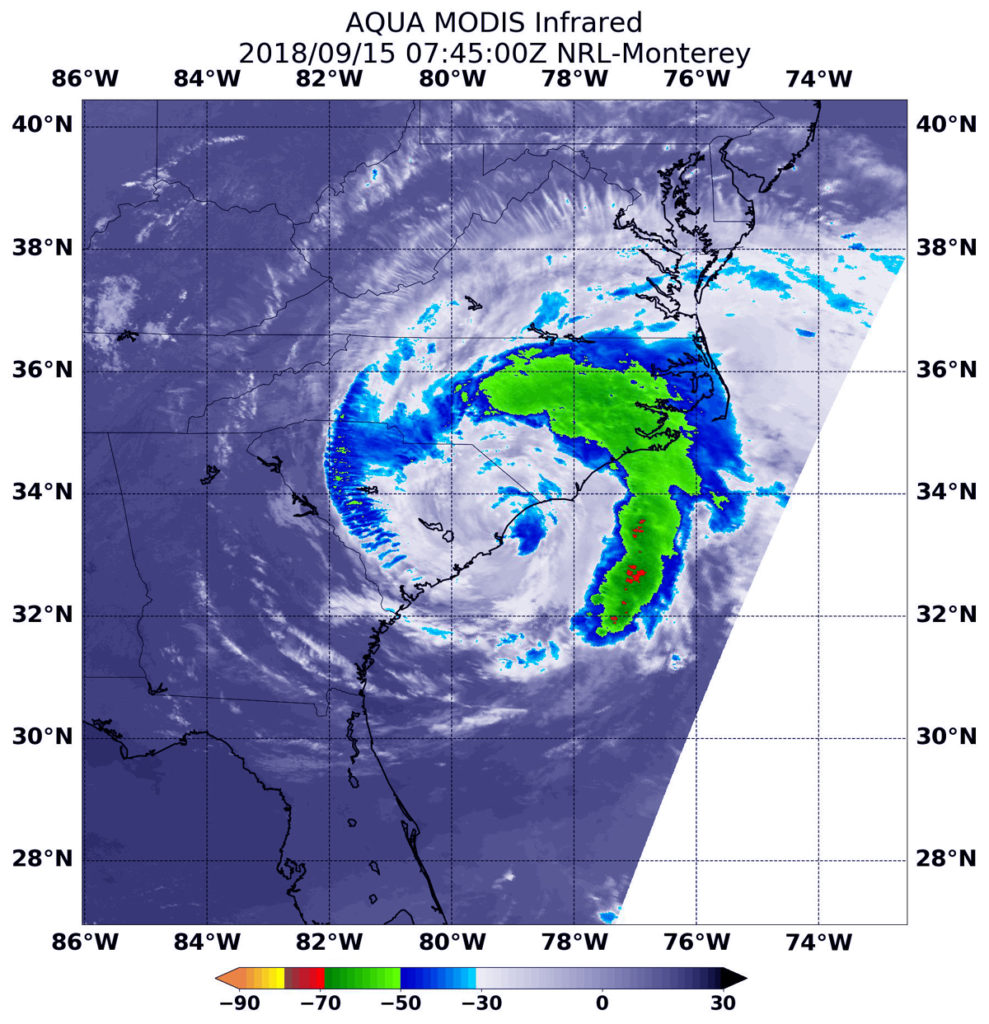
Sep. 15, 2018 – NASA Finds Heaviest Rains North and East as Florence’s Center Hugs Carolina Coast
Tropical Storm Florence is a slow-moving storm as expected, and NASA provided an infrared look to determine where the strongest storms and heaviest rains were occurring. Catastrophic flooding was happening throughout North and South Carolina as the system continues to drop heavy rainfall.
Florence, weakened to a tropical storm but continuing to hug the coast, is now over South Carolina. Winds may have weakened, but the astounding rainfall and storms surge continues. The National Hurricane Center noted: “Florence is moving slowly across eastern South Carolina and continues to produce catastrophic flooding over North Carolina and South Carolina.”
Warnings and Watches in Effect Saturday, September 15, 2018
The NHC said a Storm Surge Warning is in effect for Myrtle Beach, South Carolina to Ocracoke Inlet, North Carolina and for Pamlico Sound, including the Neuse and Pamlico Rivers. A Tropical Storm Warning is in effect for Edisto Beach, South Carolina to Ocracoke Inlet, North Carolina and Pamlico Sound
What Satellite Data Shows
Infrared satellite data at 3:45 a.m. EDT (0745 UTC) on Sept. 15 from the Moderate Resolution Imaging Spectroradiometer or MODIS instrument aboard NASA’s Aqua satellite revealed strongest storms with the coldest cloud top temperatures north and east of Florence’s center. Those storms wrapped around Florence from central and eastern North Carolina out over the Atlantic Ocean.
MODIS found coldest cloud tops had temperatures near minus 63 degrees Fahrenheit (minus 53 degrees Celsius). NASA research has found that cloud top temperatures that cold have the capability to generate heavy rainfall.
Florence Near Florence, S.C. on Saturday, Sept. 15
At 8 a.m. EDT (1200 UTC), the center of Tropical Storm Florence was located near latitude 33.6 North, longitude 79.5 West. That’s about 35 miles (55 km) west of Myrtle Beach, South Carolina and about 45 miles (70 km) south-southeast of Florence, So. Carolina.
Florence is moving toward the west near 2 mph (4 kph), and a slow westward motion is expected to continue through today. A turn toward the west-northwest and northwest is expected on Sunday.
Radar data continue to indicate that the maximum sustained winds remain near 50 mph (80 kph) with higher gusts in the heavy rainbands over water. Gradual weakening is forecast while Florence moves farther inland during the next couple of days, and it is expected to weaken to a tropical depression by tonight.
Rainfall along the Carolina coast south of Cape Hatteras is expected to be as high as 40 inches. For the full explanation of rains, winds, surge and isolated tornadoes, visit: http://www.nhc.noaa.gov.
Florence is forecast to turn northward through the Ohio Valley by Monday, Sept. 17.
For updates on Florence, visit: www.nhc.noaa.gov
By Rob Gutro
NASA’s Goddard Space Flight Center
Sep. 14, 2018 #3 – The Complex Evolution of Florence’s Winds
Having churned through the Atlantic for two weeks, Hurricane Florence is among the longest-lived cyclones of the 2018 season. That means the storm’s winds have had plenty of time to rage and ease as they ran into different environmental conditions over the Atlantic Ocean.
For more on this story visit: https://earthobservatory.nasa.gov/images/92757/the-complex-evolution-of-florences-winds?src=eoa-iotd
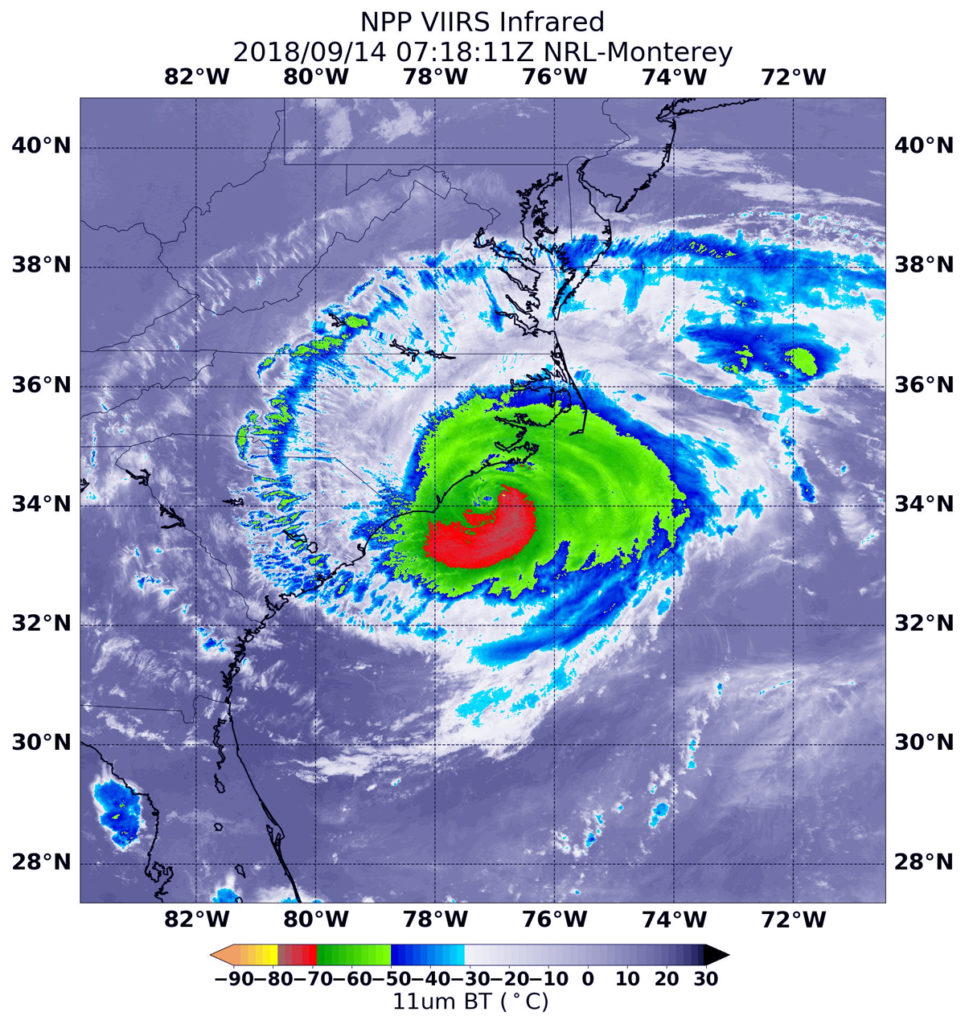
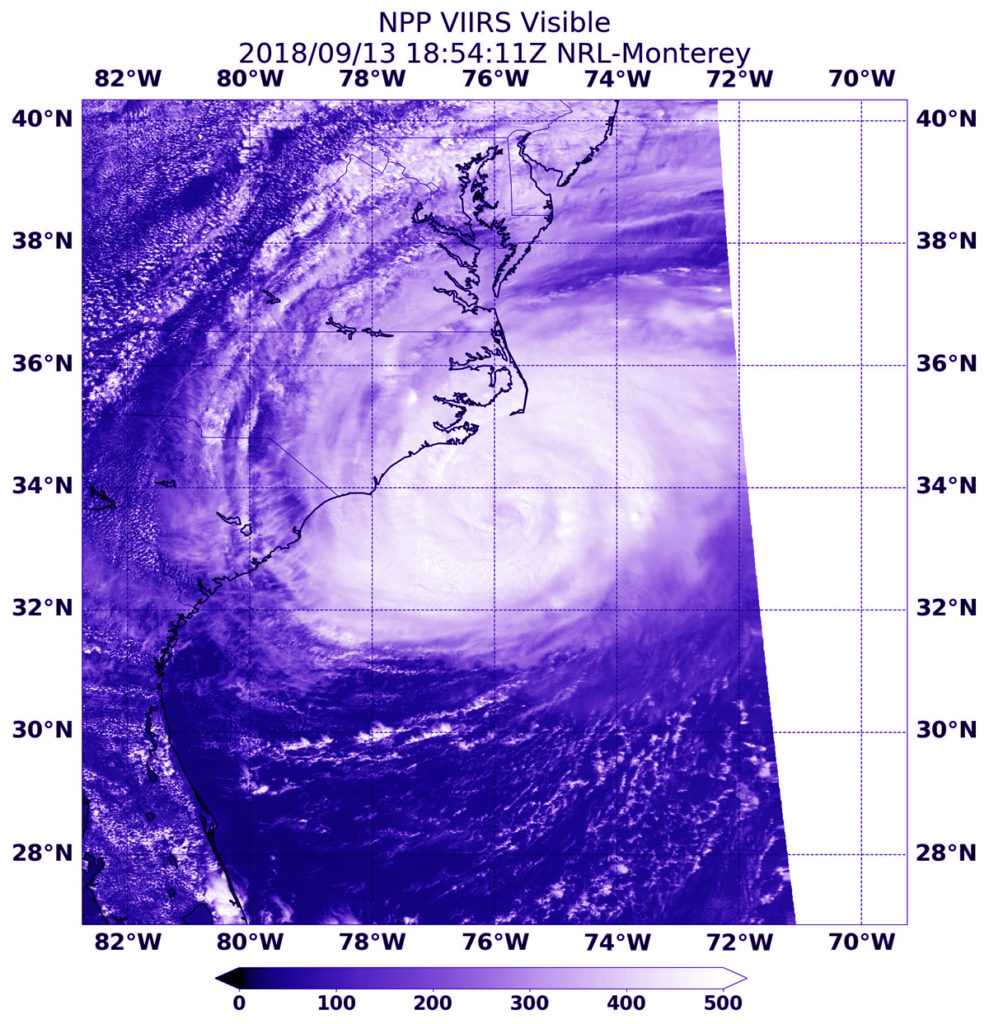
Sep. 14, 2018 #2 – NASA-NOAA Satellite Sees Land-falling Hurricane Florence
NASA-NOAA’s Suomi NPP satellite passed over the eye of Hurricane Florence the morning of landfall. Infrared imagery showed the power and the extent of this massive storm.
The National Hurricane Center or NHC said on Sept. 14, “Life-threatening storm surges and hurricane-force winds continue and catastrophic freshwater flooding expected over portions of North and South Carolina.”
Hurricane Florence made landfall near Wrightsville Beach, North Carolina at 7:15 AM EDT (1115 UTC) with estimated maximum winds of 90 mph (150 km/h), and a minimum central pressure estimate of 958 millibars.
Four hours before landfall NASA- NOAA’s Suomi NPP satellite analyzed the large storm.
A NASA Satellite View of a Massive Rainmaker
On Sept. 14 at 3:18 a.m. EDT (0718 UTC) the Visible Infrared Imaging Radiometer Suite (VIIRS) instrument aboard NASA-NOAA’s Suomi NPP satellite captured an infrared view of Florence. VIIRS infrared imagery showed that the eye of Florence appeared ragged.
Coldest cloud top temperatures of strongest thunderstorms were in the ragged eyewall, the area of thunderstorms surrounding the open eye. Those storms had cloud tops as cold as or colder than minus 80 degrees Fahrenheit (minus 62.2 Celsius). They were surrounded by powerful storms with cloud tops as cold as minus 70 degrees Fahrenheit (minus 56.6 degrees Celsius).
NASA research has shown that cloud top temperatures in excess of 63F/53C can produce heavy rainfall. Florence has a very wide area of storms where cloud tops are colder than that threshold, indicating that the storm has the capability to generate very heavy rainfall over a large area.
How Large is Florence?
Hurricane-force winds extend outward up to 80 miles (130 km) from the center and tropical-storm-force winds extend outward up to 195 miles (315 km).
The Forecast Rainfall from NHC
Florence is expected to produce heavy and excessive rainfall in the following areas:
Southeastern coastal North Carolina into far northeastern South Carolina…an additional 20 to 25 inches, with isolated storm totals of 30 to 40 inches. This rainfall will produce catastrophic flash flooding and prolonged significant river flooding. The remainder of South Carolina and North Carolina into southwest Virginia…5 to 10 inches, isolated 15 inches. This rainfall will produce life-threatening flash flooding.
Warnings and Watches
On Sept. 14, NHC posted the following warnings and watches: A Storm Surge Warning is in effect for South Santee River, South Carolina to Duck, North Carolina, the Albemarle and Pamlico Sounds, including the Neuse and Pamlico Rivers. A Storm Surge Watch is in effect for Edisto Beach, South Carolina to South Santee River, South Carolina. A Hurricane Warning is in effect for South Santee River, South Carolina to Duck, North Carolina and the Albemarle and Pamlico Sounds. A Hurricane Watch is in effect for Edisto Beach, South Carolina to South Santee River, South Carolina. A Tropical Storm Warning is in effect from north of Duck, North Carolina to Cape Charles Light, Virginia for the Chesapeake Bay south of New Point Comfort, and from Edisto Beach South Carolina to South Santee River, South Carolina.
Status of Hurricane Florence at 8 a.m. EDT
NHC stated at 8 a.m. EDT (1200 UTC), the center of the eye of Hurricane Florence was located by NOAA Doppler weather radars and surface observations to be just inland near latitude 34.1 degrees north and longitude 77.9 degrees west.
NHC said, “The center of Florence will be moving inland very soon, but is expected to slow down even more today and tonight. As a result, it will remain fairly close to the coast today, with much of the circulation still over water.”
Florence is moving toward the west near 6 mph (9 kph). A slow westward to west-southwestward motion is expected today through Saturday, Sept. 15. Maximum sustained winds remain near 90 mph (150 kph) with higher gusts. Gradual weakening is forecast later today and tonight. Significant weakening is expected over the weekend and into early next week while Florence moves farther inland.
Florence’s Forecast Track
On the forecast track, the center of Florence will move further inland across extreme southeastern North Carolina and extreme eastern South Carolina today and Saturday. Florence will then move generally northward across the western Carolinas and the central Appalachian Mountains early next week.
Storm Surge, Ocean Swells, Strong Winds, Isolated Tornadoes, Flooding
Whenever a tropical cyclone makes landfall, it comes with powerful storm surge, hurricane and tropical-storm force winds, isolated tornadoes and very heavy rainfall.
At 8 a.m. EDT, NHC noted “A life-threatening storm surge is already occurring along portions of the North Carolina coast and will continue through today and tonight. This surge is also likely along portions of the South Carolina coast.”
Surge-related flooding can vary greatly over short distances. For information specific to your area, please see products issued by your local National Weather Service forecast office at www.weather.gov. Swells generated by Florence are affecting Bermuda, portions of the U.S. East Coast, and the northwestern and central Bahamas. A few tornadoes are possible in eastern North Carolina today.
Once a tropical system moves inland, flooding and flash flooding becomes the biggest threat for days. NHC noted “Life-threatening, catastrophic flash flooding and prolonged significant river flooding are likely over portions of the Carolinas and the southern and central Appalachians through early next week, as Florence is expected to slow down while it moves inland.”
For updated forecasts, visit: www.nhc.noaa.gov
By Rob Gutro (with information from NHC)
NASA Goddard Space Flight Center
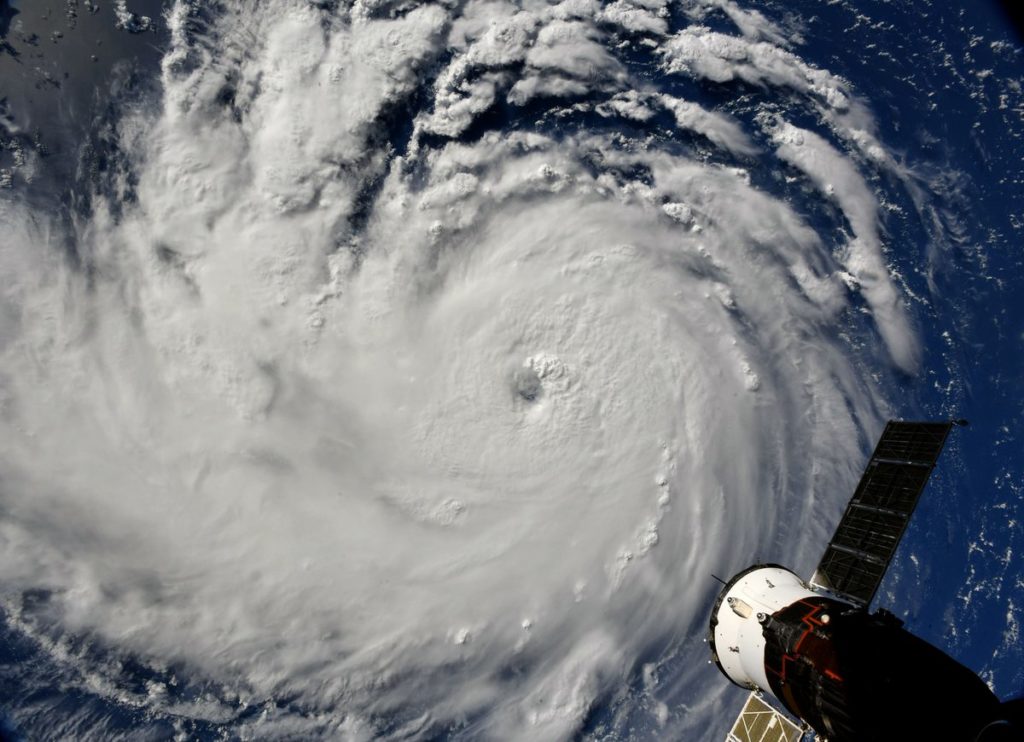
Sep. 14, 2018 #1 – Video from ISS of Hurricane Florence
Cameras outside the International Space Station captured views of Hurricane Florence on Sept. 14 at 7:41 a.m. EDT minutes after the storm made landfall near Wrightsville Beach, North Carolina packing winds of 90 miles an hour. The National Hurricane Center said Florence is moving very slowly to the west at only 6 miles an hour, then is expected to turn to the southwest, increasing the threat for historic storm surge and catastrophic flooding to coastline areas and inland cities in North Carolina and South Carolina. Credit: NASA
Astronaut Ricky Arnold took this image from the International Space Station this morning, Sept. 14, 2018.

Sep. 13, 2018 #2 – NASA Gets Inside Look at Large and Powerful Hurricane Florence
NASA’s Aqua satellite provided an infrared look at the large and powerful Hurricane Florence early on Sept. 13 that indicated wind shear was temporarily affecting the southern side of the storm.

The National Hurricane Center or NHC noted that hurricane-force winds extend outward up to 80 miles (130 km) from the center and tropical-storm-force winds extend outward up to 195 miles (315 km).
Infrared and Microwave Satellite Images Reveal
Early on Sept. 13, NASA’s Aqua satellite’s infrared data showed the clouds in the southern quadrant of Hurricane Florence appeared warmer than storms throughout the rest of Florence. That means that the cloud tops are lower in the atmosphere, and the storms are not as powerful. That’s because vertical wind shear, the change of speed and direction of winds with altitude was buffeting the southern side of Florence and preventing the development of higher, stronger thunderstorms in that part of the storm.
NOAA’s National Hurricane Center (NHC) said “microwave overpass indicated that the convection over the southern and southeastern portions of the storm is still disrupted, and that the eyewall was open to the southeast. It appears that some southern shear has caused the degradation of the inner core. The global models suggest that this shear will relax today while Florence moves over warm waters, however, given the current storm structure, little overall change in strength is anticipated as Florence approaches the coast.”
At 2:20 a.m. EDT (0230 UTC) on Sept. 13, Moderate Resolution Imagine Spectroradiometer or MODIS instrument aboard NASA’s Aqua satellite analyzed Hurricane Florence in infrared light. MODIS found coldest cloud top temperatures in a tight band around the eye wall (the thunderstorms surrounding the open eye), as cold as or colder than minus 80 degrees Fahrenheit (F)/minus 112 degrees Celsius (C). Surrounding the eye were thick rings of powerful storms with cloud tops as cold as or colder than minus 70F (minus 56.6C).
NASA research has found that cloud top temperatures as cold as or colder than the 70F/56.6C threshold have the capability to generate heavy rainfall.
Watches and Warnings Already in Effect
NHC noted Storm Surge Warning is in effect for South Santee River, South Carolina to Duck, North Carolina and for the Albemarle and Pamlico Sounds, including the Neuse and Pamlico Rivers. A Storm Surge Watch is in effect for Edisto Beach South Carolina to South Santee River, South Carolina and north of Duck, North Carolina to the North Carolina/Virginia border. A Hurricane Warning is in effect for South Santee River, South Carolina to Duck, North Carolina and the Albemarle and Pamlico Sounds. A Hurricane Watch is in effect for Edisto Beach, South Carolina to South Santee River, South Carolina. A Tropical Storm Warning is in effect from north of Duck, North Carolina to Cape Charles Light Virginia, and Chesapeake Bay south of New Point Comfort.
Florence at 8 a.m. EDT on Sept. 13, 2018
At 8 a.m. EDT (1200 UTC), the center of the eye of Hurricane Florence was located by an Air Force Reserve reconnaissance aircraft and NOAA Doppler weather radars to be near latitude 33.1 degrees north and longitude 75.1 degrees west.
Florence is moving slower toward the northwest at about 12 mph (20 kph). This general motion, accompanied by a further decrease in forward speed, is expected to continue through today. A turn to the west-northwest and west at an even slower forward speed is expected tonight and Friday, and a slow west-southwestward motion is forecast Friday night and into Saturday.
Maximum sustained winds are near 110 mph (175 kph) with higher gusts. Little change in strength is expected before the center reaches the coast, with weakening expected after the center moves inland.
Florence’s Forecast Track
On the forecast track, the center of Florence will approach the coasts of North and South Carolina later today, then move near or over the coast of southern North Carolina and eastern South Carolina in the hurricane warning area tonight and Friday. A slow motion over eastern South Carolina is forecast Friday night through Saturday night.
For updated forecasts on Florence, visit: www.nhc.noaa.gov
By Rob Gutro
NASA’ Goddard Space Flight Center
Sep. 13, 2018 #1 – ISS Video of Florence
High definition cameras outside the International Space Station captured new views of a somewhat weakened Hurricane Florence at 6:56 a.m. EDT Sept. 13 as it neared the U.S. Eastern seaboard. According to the National Hurricane Center, Florence is moving northwest with winds of 110 miles an hour. On the forecast track, the center of Florence will approach the coasts of North and South Carolina later today, then move near or over the coast of southern North Carolina and eastern South Carolina in the hurricane warning area tonight and Friday. A slow motion over eastern South Carolina is forecast Friday night through Saturday night. The region is facing potential catastrophic flooding from Florence with some rainfall totals predicted to reach 40 inches. Credit: NASA
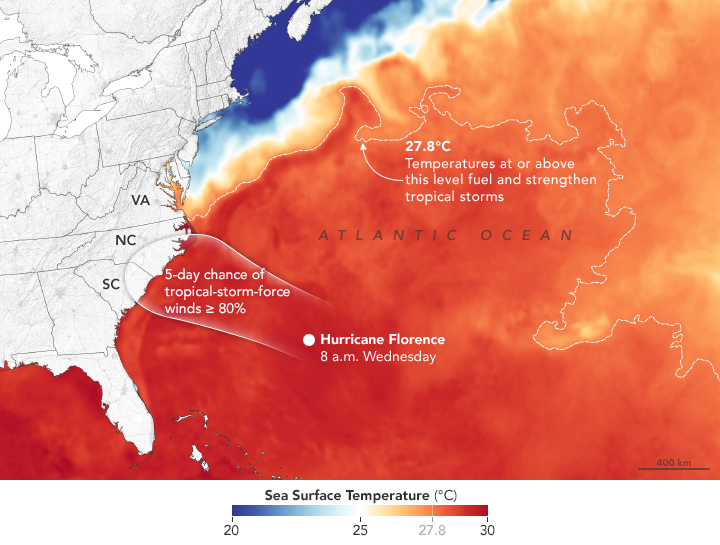
Sep. 12, 2018 #5 – Florence Crossing Warm Waters on the Way to the Carolinas
The map below shows sea surface temperatures on September 11, 2018. Meteorologists generally agree that sea surface temperatures (SSTs) should be above 27.8°C (82°F) to sustain and intensify hurricanes (although there are some exceptions). In Florence’s case, National Hurricane Center forecasters expect the storm to pass over water with temperatures well above that threshold. The data for the map were compiled by Coral Reef Watch, which blends observations from the Suomi NPP, MTSAT, Meteosat, and GOES satellites and computer models. Information about the storm track and winds come from the National Hurricane Center.
For more on this story visit: https://earthobservatory.nasa.gov/images/92739/florence-crossing-warm-waters-on-the-way-to-the-carolinas?src=eoa-iotd
Sep. 12, 2018 #4 – NASA-NOAA Satellite Analyzes Rainmaker Hurricane Florence
NASA-NOAA’s Suomi NPP satellite passed over the eye of powerful Category 4 Hurricane Florence and found the storm over 400 miles in diameter and the capability to generate very heavy rainfall.

At 8 a.m. EDT on Wednesday, Sept. 12, NOAA’s National Hurricane Center (NHC) warned “Dangerous Florence heading toward the U.S. southeast coast and is expected to bring life-threatening storm surge and rainfall to portions of the Carolinas and Mid-Atlantic States.”
Putting the Size and Surge of the Storm in Perspective
Florence is about 400 miles in diameter. For an understanding of how large the system is 400 miles is the distance from Baltimore, Maryland to Boston, Massachusetts.
This is a life-threatening situation. In some areas, the NHC said that storm surge could be as high as 13 feet, which is over the first floor of a house or building.
NHC said “Persons located within these areas should take all necessary actions to protect life and property from rising water and the potential for other dangerous conditions. Promptly follow evacuation and other instructions from local officials.” A Storm Surge Warning means there is a danger of life-threatening inundation, from rising water moving inland from the coastline, during the next 36 hours in the indicated locations.
Warnings and Watches: Storm Surge, Hurricane, Tropical Storm
The warnings and watches are numerous from Virginia to South Carolina. A Storm Surge Warning and a Hurricane Warning are both in effect for South Santee River, South Carolina to Duck, North Carolina and the Albemarle and Pamlico Sounds, including the Neuse and Pamlico Rivers. A Storm Surge Watch and a Hurricane Watch is in effect for Edisto Beach, South Carolina to South Santee River, South Carolina.
A Tropical Storm Warning and Storm Surge Watch is in effect for north of Duck, North Carolina to the North Carolina/Virginia border. A Tropical Storm Watch is in effect for north of the North Carolina/Virginia border to Cape Charles Light, Virginia and for the Chesapeake Bay south of New Point Comfort.
A NASA Satellite View of a Massive Rainmaker
On Sept. 12 at 2:12 a.m. EDT (0612 UTC) the Visible Infrared Imaging Radiometer Suite (VIIRS) instrument aboard NASA-NOAA’s Suomi NPP satellite captured an infrared view of Florence (above). VIIRS infrared imagery showed that the eye of Florence remains very distinct. There has been little change to the cloud top temperatures surrounding the eye overnight. The VIIRS imagery also showed that the overall structure has become slightly more symmetric.
Coldest cloud top temperatures of strongest thunderstorms were in the eyewall, the area of thunderstorms surrounding the open eye. Those storms had cloud tops as cold as or colder than minus 80 degrees Fahrenheit (minus 62.2 Celsius). They were surrounded by powerful storms with cloud tops as cold as minus 70 degrees Fahrenheit (minus 56.6 degrees Celsius).
NASA research has shown that cloud top temperatures in excess of 63F/53C can produce heavy rainfall. Florence has a very wide area of storms where cloud tops are colder than that threshold, indicating that the storm has the capability to generate very heavy rainfall over a large area.
NHC said Florence is expected to produce heavy and excessive rainfall in the following areas: Coastal North Carolina…20 to 30 inches, isolated areas may see 40 inches; South Carolina, western and northern North Carolina…5 to 10 inches, isolated areas may see 20 inches; Elsewhere in the Appalachians and Mid-Atlantic states…3 to 6 inches, isolated areas may see 12 inches.
Florence’s Status on Sept. 12 at 8 a.m. EDT
At 8 a.m. EDT (1200 UTC) on Sept. 12, the NHC said the eye of Hurricane Florence was located near latitude 29.4 degrees north and longitude 70.7 degrees west. That’s about 530 miles (855 km) southeast of Cape Fear, North Carolina.
Maximum sustained winds are near 130 mph (215 kph) with higher gusts. Florence is a category 4 hurricane on the Saffir-Simpson Hurricane Wind Scale. Hurricane-force winds extend outward up to 70 miles (110 km) from the center and tropical-storm-force winds extend outward up to 175 miles (280 km).
Strengthening is forecast through tonight. While some weakening is expected on Thursday, Florence is forecast to be an extremely dangerous major hurricane when it nears the U.S. coast.
Florence’s Current Forecast Path
Florence is moving toward the west-northwest near 17 mph (28 kph), and this motion is expected to continue this morning. A motion toward the northwest is forecast to begin by this afternoon and continue through Thursday. Florence is expected to slow down considerably by late Thursday into Friday, and move slowly through early Saturday. On the forecast track, the center of Florence will move over the southwestern Atlantic Ocean between Bermuda and the Bahamas today, and approach the coast of North Carolina or South Carolina in the hurricane warning area on Thursday and Friday.
NHC forecasters caution that the path may change and residents along the southeastern U.S. coast should stay vigilant.
For updated forecasts, visit: www.nhc.noaa.gov
By Rob Gutro
NASA Goddard Space Flight Center
Sep. 12, 2018 #3 – Stark View of Florence from ISS
A high definition camera outside the International Space Station captured a stark and sobering view of Hurricane Florence at 7:50 a.m. EDT on Sept. 12 as it churned across the Atlantic in a west-northwesterly direction with winds of 130 miles an hour. The National Hurricane Center forecasts additional strengthening for Florence before it reaches the coastline of North Carolina and South Carolina early Friday, Sept. 14. Credit: NASA
Sep. 12, 2018 #2 – ISS Video of Florence
A high definition camera outside the International Space Station captured a stark and sobering view of Hurricane Florence at 7:50 a.m. EDT on Sept. 12. NASA satellites track the storm: https://go.nasa.gov/2CEmDGQ This video was taken as Florence churned across the Atlantic in a west-northwesterly direction with winds of 130 miles an hour. The National Hurricane Center forecasts additional strengthening for Florence before it reaches the coastline of North Carolina and South Carolina early Friday, Sept. 14. Credit: NASA
Sep. 12, 2018 #1 – Images from the International Space Station


Sep. 11, 2018 #2 – A View Inside Hurricane Florence
One of CloudSat’s most recent acquisitions—a view of the inner structure of Hurricane Florence as the storm took aim for the Carolinas—underscores the mission’s scientific value. This natural-color image shows how Hurricane Florence appeared from above to the Moderate Resolution Imaging Spectroradiometer (MODIS) on the Aqua satellite on September 11, 2018. The second image, acquired by CloudSat on the same day, shows a cross-section—how the storm would look if it had been sliced near the middle and viewed from the side. The blue line is the north-to-south track that CloudSat flew over Florence. Note that the MODIS image has been rotated.

For more on this story visit: https://earthobservatory.nasa.gov/images/92751/a-view-inside-hurricane-florence?src=eoa-iotd
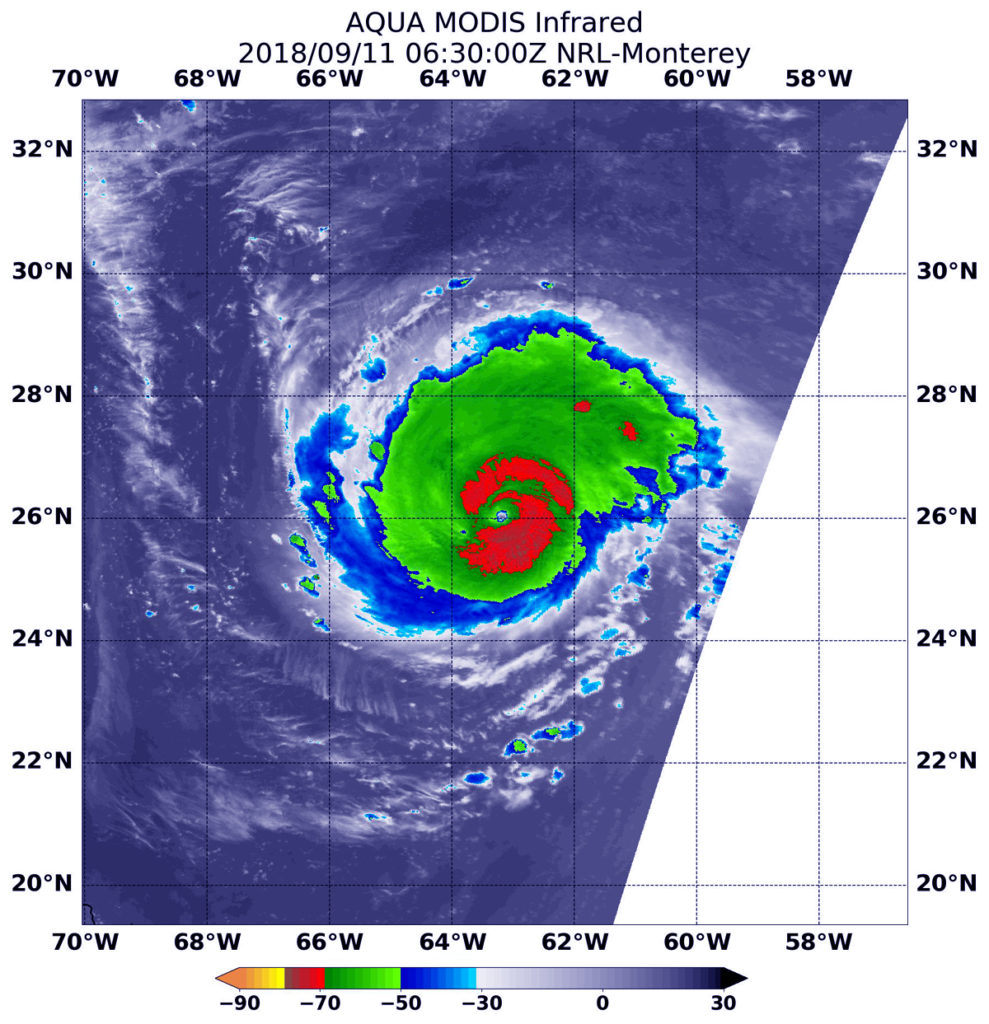
Sep. 11, 2018 #1 – NASA Satellite Finds Hurricane Florence Undergoing Eyewall Replacement
NASA’s Aqua satellite provided an infrared look at powerful Hurricane Florence early on Sept. 11 that indicated it was likely undergoing eyewall replacement.
Intense hurricanes can and often undergo an eyewall replacement cycle. That happens when a new eyewall or ring of thunderstorms within the outer rain bands forms further out from the storm’s center, outside of the original eye wall. That ring of thunderstorms then begins to choke off the original eye wall, starving it of moisture and momentum. Eventually, if the cycle is completed, the original eye wall of thunderstorms dissipates and the new outer eye wall of thunderstorms contracts and replace the old eye wall. The storm’s intensity can fluctuate over this period, initially weakening as the inner eye wall dies before again strengthening as the outer eye wall contracts.
Infrared and Microwave Satellite Images Reveal
NOAA’s National Hurricane Center (NHC) said that recent satellite imagery shows that the eye of Florence has become cloud filled. A microwave image of the storm at 12:41 a.m. EDT (0441 UTC) showed a double eyewall structure. These observations suggest that an eyewall replacement cycle is likely underway.
At 2:30 a.m. EDT (0630 UTC) on Sept. 11, Moderate Resolution Imaging Spectroradiometer or MODIS instrument aboard NASA’s Aqua satellite analyzed Hurricane Florence in infrared light. MODIS found coldest cloud top temperatures around the eye, as cold as or colder than minus 80 degrees Fahrenheit (F)/minus 112 degrees Celsius (C). Surrounding the eye were thick rings of powerful storms with cloud tops as cold as or colder than minus 70F (minus 56.6C).
NASA research has found that cloud top temperatures as cold as or colder than the 70F/56.6C threshold have the capability to generate heavy rainfall.
Analyzing Sea Surface Temperatures Ahead
Infrared data also shows that the sea surface temperatures ahead of Florence are at least 84.2 degrees Fahrenheit (29 degrees Celsius). That’s important because tropical cyclones need sea surface temperatures of at least 80F (26.6C) to maintain intensity. Warmer sea surface temperatures provide more energy for the tropical cyclone.
Watches and Warnings Already in Effect
NHC noted a Storm Surge Watch is in effect for Edisto Beach, South Carolina to the North Carolina-Virginia border and for the Albemarle and Pamlico Sounds, including the Neuse and Pamlico Rivers. A Hurricane Watch is in effect for Edisto Beach South Carolina to the North Carolina-Virginia border and for the Albemarle and Pamlico Sounds.
Florence at 8 a.m. EDT on Sept. 11, 2018
At 8 a.m. EDT (1200 UTC), the center of Hurricane Florence was located near latitude 26.4 degrees north and longitude 64.6 degrees west. That’s about 405 miles (655 km) south of Bermuda and 950 miles (1,530 km) east-southeast of Cape Fear, North Carolina.
Florence is moving toward the west-northwest near 15 mph (24 kph). A west- northwestward to northwestward motion with a slight increase in forward speed are expected during the next couple of days. Data from the reconnaissance aircraft indicate that the minimum central pressure is 950 millibars.
NHC said “reports from an Air Force Reserve Unit hurricane hunter aircraft indicate that maximum sustained winds have decreased to near 130 mph (215 km/h) with higher gusts. However, Florence is still a category 4 hurricane on the Saffir-Simpson Hurricane Wind Scale. Re-strengthening is forecast to occur during the next day or so, and Florence is expected to be an extremely dangerous major hurricane through Thursday night. Hurricane-force winds extend outward up to 40 miles (65 km) from the center and tropical-storm-force winds extend outward up to 150 miles (240 km).
Florence Churning High Seas
At 5 a.m. EDT on Sept. 11, NOAA buoy 41049 located about 80 nautical miles north of the eye, has reported tropical-storm-force winds during the last several hours and seas as high as 23 feet.
Florence’s Forecast Track
On the forecast track, the center of Florence will move over the southwestern Atlantic Ocean between Bermuda and the Bahamas through Wednesday, and approach the coast of North Carolina or South Carolina on Thursday, Sept. 13.
For updated forecasts, visit: www.nhc.noaa.gov
By Rob Gutro
NASA’ Goddard Space Flight Center
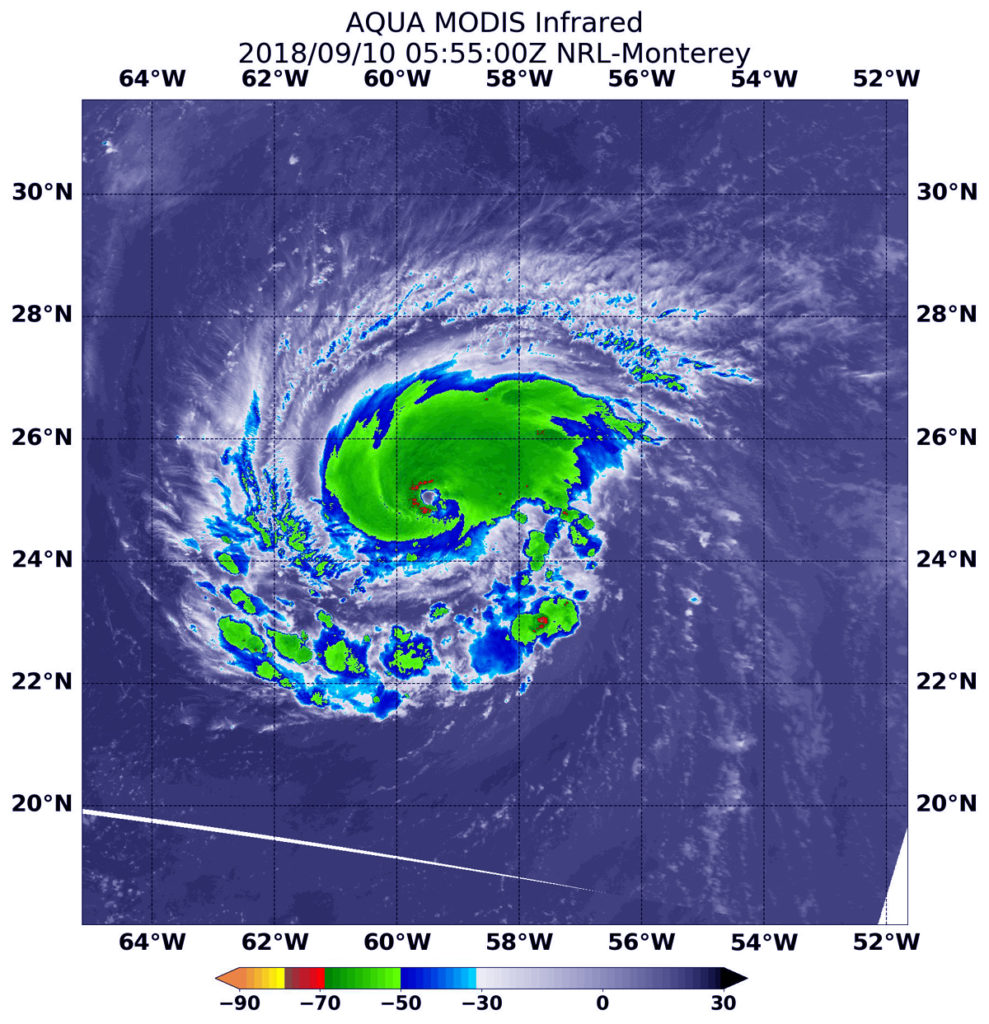
Sep. 10, 2018 #4 update – NASA Satellites Show Hurricane Florence Strengthening
NASA satellites are providing a lot of different kinds of data to forecasters at the National Hurricane Center to help them understand what’s happening with Hurricane Florence. NASA’s Aqua satellite is providing visible, infrared and microwave imagery while the GPM core satellite is providing additional data like rain rates throughout the storm and cloud heights.
Last Friday, Sept. 7, Florence was a sheared tropical storm but on Saturday vertical shear lessened and Florence started to get better organized. Today, Sept. 10 Hurricane Florence was rapidly strengthening and became a major hurricane.
NOAA’s National Hurricane Center (NHC) said “Interests in the southeastern and mid-Atlantic states should monitor the progress of Florence. Storm Surge and Hurricane watches could be issued for portions of these areas by Tuesday morning”.
The Global Precipitation Measurement mission or GPM core observatory satellite had a fairly good look at Florence on Sunday, Sept. 9, 2018 at 2:13 p.m. EDT (1813 UTC). GPM is a joint satellite mission between NASA and the Japan Aerospace Exploration Agency called JAXA.

When GPM observed Florence, the intensifying storm had maximum sustained winds of about 70 knots (81 mph) at that time and was still a tropical storm. At the time GPM observed Florence, GPM’s Microwave Imager (GMI) instruments revealed distinct rain bands wrapping around Florence’s southeastern side. Algorithms developed by NASA’s Precipitation Measurement Missions (PMM) team at NASA’s Goddard Space Flight Center in Greenbelt, Maryland were used with GMI data and estimated that precipitation was falling at a rate of greater than 44 mm (1.7 inches) per hour in the rain band.
At NASA Goddard, a 3-D animation was created using data observed by GPM’s radar (DPR Ku Band), that showed the relative heights of storm tops within Florence. Those data were blended with estimates from geostationary satellite cloud top temperatures.
That heavy rainfall was confirmed in NASA infrared imagery the next day, Monday, Sept. 10. At 1:55 a.m. EDT (0555 UTC) on Sept. 10, from the Moderate Resolution Imaging Spectroradiometer or MODIS instrument aboard NASA’s Aqua satellite revealed strongest storms in Florence were in the northern and western part of the eyewall. In those areas, MODIS found coldest cloud tops had temperatures near minus 70 degrees Fahrenheit (minus 56.6 degrees Celsius). NASA research has found that cloud top temperatures that cold have the capability to generate heavy rainfall.
At 3:21 a.m. EDT (0721 UTC) the AIRS or Atmospheric Infrared Sounder instrument aboard Aqua provided another, wider infrared view of the storm that showed powerful thunderstorms with cloud tops as cold as or colder than minus 63 degrees Fahrenheit (minus 53 degrees Celsius) made up most of the storm. Temperatures that cold were also found in fragmented bands of storms south of Florence’s center.
Florence’s Status on Sept. 10 at 11 a.m. EDT
At 11 a.m. EDT (1500 UTC), the eye of Hurricane Florence was located near latitude 25.0 degrees north and longitude 60.0 degrees west. Florence is moving toward the west near 13 mph (20 kph). A west-northwestward motion with an increase in forward speed is expected during the next couple of days.
The GPM core observatory satellite had a fairly good look at Florence on Sunday, Sept. 9, 2018 at 2:13 p.m. EDT (1813 UTC). GPM estimated that precipitation was falling at a rate of greater than 44 mm (1.7 inches) per hour in a band of thunderstorms south of Florence’s center. Credit: NASA/JAXA, Hal Pierce
The NHC said, a turn toward the northwest is forecast to occur late Wednesday night. On the forecast track, the center of Florence will move over the southwestern Atlantic Ocean between Bermuda and the Bahamas Tuesday and Wednesday, and approach the coast of South Carolina or North Carolina on Thursday.
Satellite data indicate that maximum sustained winds have increased to near 115 mph (185 kph) with higher gusts. Florence is a category 3 hurricane on the Saffir-Simpson Hurricane Wind Scale. Further strengthening is anticipated, and Florence is expected to be an extremely dangerous major hurricane through Thursday.
Ocean swells generated by Florence are affecting Bermuda and portions of the U.S. East Coast. These swells are likely to cause life-threatening surf and rip current conditions.
The NHC predicts that Florence’s winds will decrease slightly to 125 knots (144 mph) as the hurricane threatens the southeastern United States on Thursday September 13, 2018.
For updated forecasts, visit: www.nhc.noaa.gov
By Rob Gutro
NASA’ Goddard Space Flight Center
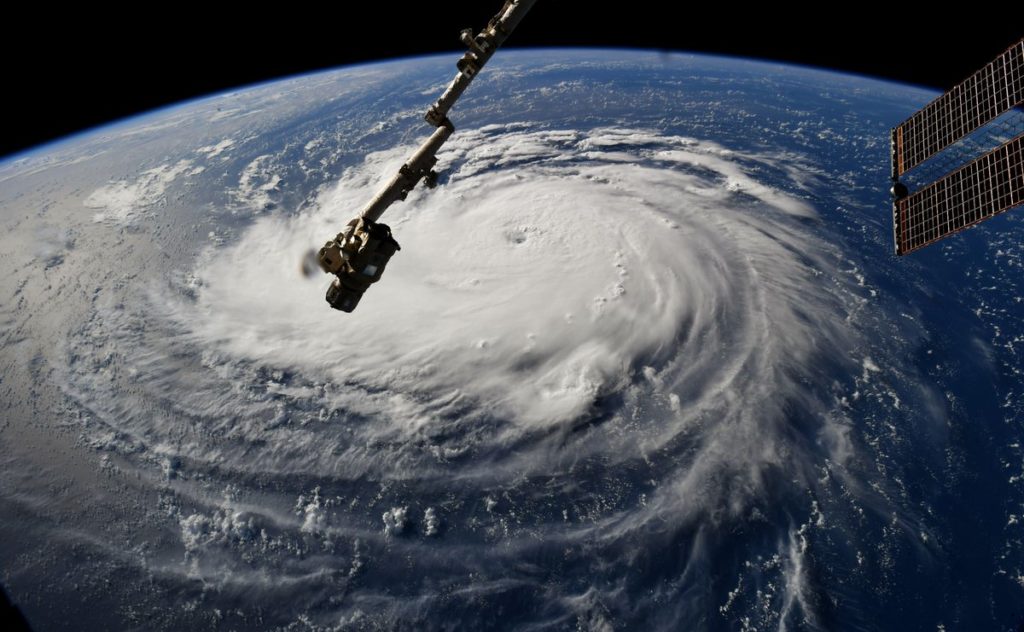
Sep. 10, 2018 #3 – Hurricane Florence Views from Space Station
Cameras outside the International Space Station captured dramatic views of rapidly strengthening Hurricane Florence at 8:10 a.m. EDT Sept. 10 as it moved in a westerly direction across the Atlantic, headed for a likely landfall along the eastern seaboard of the U.S. late Thursday or early Friday. Now a major hurricane with winds of 115 miles an hour and increasing, the National Hurricane Center says Florence’s forecast track will take the system over the southwestern Atlantic Ocean between Bermuda and the Bahamas Tuesday and Wednesday, and Florence will approach the coast of South Carolina or North Carolina on Thursday. The station was flying 255 miles over the storm at the time this video was captured. Credit: NASA
Sep. 10, 2018 #2 update -GPM Sees Heavy Rain In Menacing Hurricane Florence
Last Friday Florence was a sheared tropical storm but on Saturday vertical shear lessened and Florence started to get better organized. Today hurricane Florence is rapidly strengthening. The National Hurricane Center (NHC) predicts that Florence will be a major hurricane with maximum sustained winds peaking at 130 kts (~150 mph) on Wednesday when it is over the open Atlantic well southwest of Bermuda. The NHC predicts that Florence’s winds will decrease slightly to 125 kts (144 mph) as the hurricane threatens the southeastern United States on Thursday September 13, 2018.
For more information visit: https://pmm.nasa.gov/extreme-weather/gpm-sees-heavy-rain-menacing-hurricane-florence
Sep. 10, 2018 #1 update – ISS Sees Florence From Space

Sep. 09, 2018 – NASA Sees Now-Hurricane Florence Developing an Eye
Hurricane Florence continued to organize and NASA’s Aqua satellite found strongest storms around a developing eye.
Florence is forecast to rapidly intensify into a major hurricane by Monday, Sept. 10.

Infrared satellite data at 1:10 a.m. EDT (0510 UTC) on Sept. 9 from the Moderate Resolution Imaging Spectroradiometer or MODIS instrument aboard NASA’s Aqua satellite revealed strongest storms around Florence’s center hinting at the development of an eye. MODIS found coldest cloud tops had temperatures near minus 70 degrees Fahrenheit (minus 56.6 degrees Celsius). NASA research has found that cloud top temperatures that cold have the capability to generate heavy rainfall.
At 11 a.m. EDT (1500 UTC) on Sunday, Sept. 9, the National Hurricane Center, or NHC, in Miami discussion on Florence stated: “Deep convection has intensified in the central dense overcast, with hints of a ragged eye in the latest GOES-16 visible channel 9.”
At that time, the center of Hurricane Florence was located by a NOAA Hurricane Hunter aircraft near 24.4 degrees north latitude and 56.3 degrees west longitude. That’s about 610 miles (985 km) miles northeast of the Northern Leeward Islands.
Florence is also about 750 miles (1,210 km) southeast of Bermuda. Swells generated by Florence are affecting Bermuda and are beginning to reach portions of the U.S. East Coast.
Florence is moving toward the west near 6 mph (9 kph), and this general motion is expected to continue today. A west-northwestward motion with an increase in forward speed is expected by Monday, and that motion is forecast to continue through mid-week. On the forecast track, the center of Florence will move over the southwestern Atlantic Ocean between Bermuda and the Bahamas Tuesday and Wednesday, and approach the southeastern U.S. coast on Thursday.
Aircraft data indicate that maximum sustained winds have increased to near 75 mph (120 km/h) with higher gusts. Florence is forecast to rapidly strengthen to a major hurricane by Monday, and is expected to remain an extremely dangerous major hurricane through Thursday.
For updates on Florence, visit: www.nhc.noaa.gov
By Rob Gutro
NASA’s Goddard Space Flight Center, Greenbelt, Md.
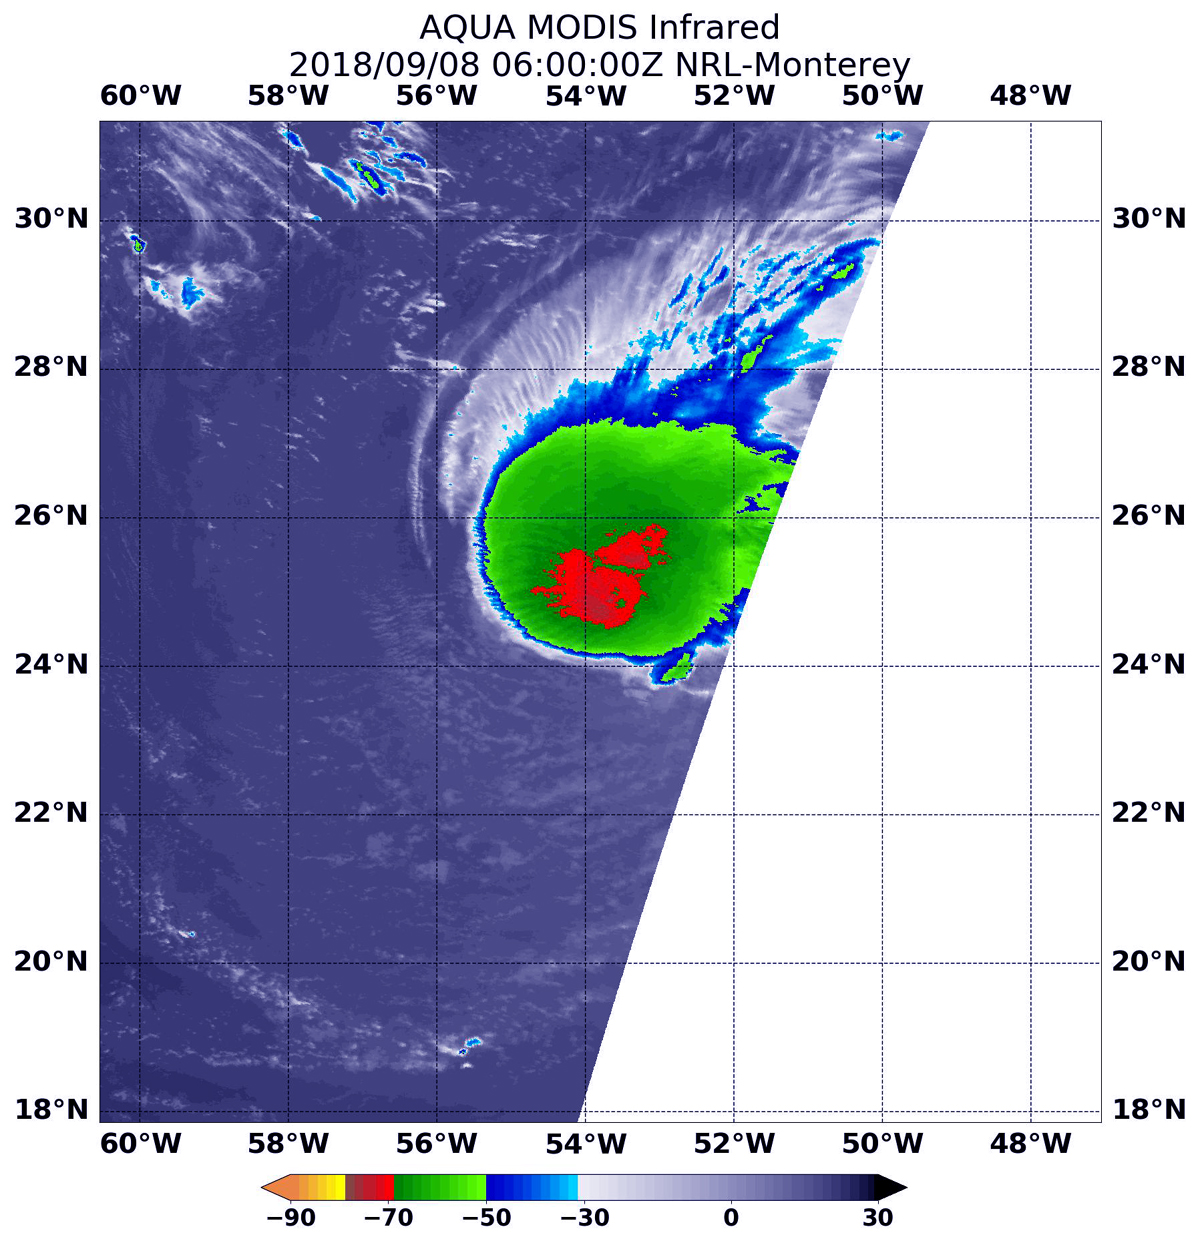
Sept. 8, 2018 – NASA’s Aqua Satellite Finds Tropical Storm Florence Strengthening
Tropical Storm Florence appeared stronger and more organized in infrared imagery from NASA’s Aqua satellite on Saturday, Sept. 8, 2018. The imagery showed a more rounded storm, and higher, much colder cloud tops.
NOAA’s National Hurricane Center or NHC noted that regardless of Florence’s eventual track, large swells are affecting Bermuda and will begin to affect portions of the U.S. East Coast this weekend, resulting in life-threatening surf and rip currents.
Infrared satellite data at 2:00 a.m. EDT (0600 UTC) on Sept. 8, from the Moderate Resolution Imaging Spectroradiometer or MODIS instrument aboard NASA’s Aqua satellite showed coldest cloud top temperatures near minus 112 degrees Fahrenheit (minus 80 degrees Celsius) around Florence’s center. The previous day, when wind shear was strongly affecting the storm, cloud tops were only as cold as minus 63 degrees Fahrenheit (minus 53 degrees Celsius). The colder the cloud tops, the stronger the storms and the greater the capability to produce heavy rain.
NHC forecaster Stewart noted on Sept. 8, “Deep convection with overshooting cloud tops near minus 80 degrees Celsius and an abundance of lightning activity have developed very close to the center.”
At 5 a.m. EDT (0900 UTC), the center of Tropical Storm Florence was located near latitude 24.5 degrees north and longitude 54.2 degrees west. Florence is about 840 miles (1,350 km) southeast of Bermuda and about 720 miles (1,155 km) northeast of the Northern Leeward Islands.
Florence is moving toward the west near 9 mph (14 kph), and this general motion is expected to continue for the next couple days. A west-northwestward motion with an increase in forward speed is expected by early next week and continue into middle part of next week. On the forecast track, the center of Florence will move over the warm waters of the southwestern Atlantic Ocean through Wednesday.
Maximum sustained winds are near 65 mph (100 kph) with higher gusts. Gradual re-strengthening is forecast over the weekend. Florence is forecast to become a hurricane by Sunday, Sept. 9 and is expected to become a major hurricane again early next week.
NHC cautioned “The risk of other direct impacts associated with Florence along the U.S. East Coast next week has increased. However, there is still very large uncertainty in model forecasts of Florence’s track beyond day 5, making it too soon to determine the exact location, magnitude, and timing of these impacts. Interests near and along the U.S. East Coast should monitor the progress of Florence through the weekend and ensure they have their hurricane plans in place.”
For updates on Florence, visit: www.nhc.noaa.gov
By Rob Gutro
NASA’s Goddard Space Flight Center, Greenbelt, Md.
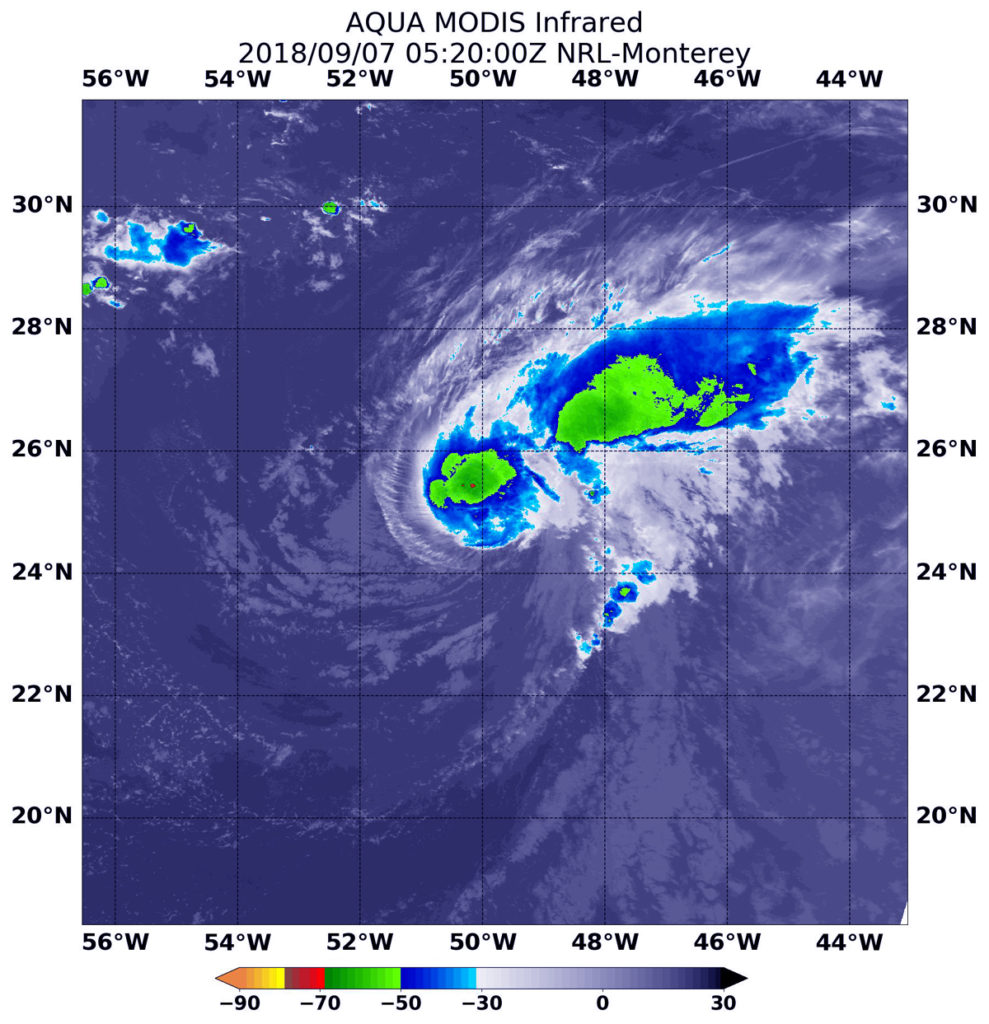
Sep. 07, 2018 – NASA’s Aqua Satellite Finds Florence Temporarily Fighting Wind Shear
Tropical Storm Florence appeared weaker in infrared imagery from NASA’s Aqua satellite, with warmer cloud top temperatures. However, forecasters believe this is a temporary setback.
NOAA’s National Hurricane Center cautioned that the U.S. coasts will start to feel some effects from Florence over the weekend of Sept. 8 and 9. Regardless of Florence’s eventual track, large swells will begin to affect Bermuda later today and portions of the U.S. East Coast this weekend, resulting in life-threatening surf and rip currents.
Infrared satellite data at 1:20 a.m. EDT (0520 UTC) on Sept. 7, from the Moderate Resolution Imaging Spectroradiometer or MODIS instrument aboard NASA’s Aqua satellite showed coldest cloud top temperatures near minus 63 degrees Fahrenheit (minus 53 degrees Celsius) around Florence’s center and in a band of thunderstorms northeast of center.
NHC forecaster Zelinsky said “Florence’s structure continues to be negatively affected by strong southwesterly [wind] shear. Cloud tops have generally warmed over the past 6 hours, and recent microwave data show that the low-level circulation center of Florence is displaced nearly 20 nautical miles to the southwest of the mid-level center.”
At 5 a.m. EDT (0900 UTC) on Friday, Sept. 7 the center of Tropical Storm Florence was located near latitude 25.1 degrees north and longitude 50.7 degrees west. Florence is moving toward the west near 7 mph (11 kph). This general motion will likely continue for the next couple of days. A turn toward the west-northwest is expected by the end of the weekend.
Maximum sustained winds have decreased to near 65 mph (100 kph) with higher gusts. Little change in intensity is expected today. However, Florence is forecast to restrengthen and become a hurricane again over the weekend.
Swells generated by Florence will begin to affect Bermuda later today and will reach portions of the U.S. East Coast over the weekend. These swells are likely to cause life-threatening surf and rip current conditions.
NHC noted “There is still very large uncertainty in Florence’s track beyond day 5, and it is too soon to determine what, if any, other impacts Florence could have on the U.S. East Coast next week.”.
For updates on Florence, visit: www.nhc.noaa.gov
By Rob Gutro
NASA’s Goddard Space Flight Center
Sep. 06, 2018 – Pics from Astronaut Ricky Arnold from the ISS


Sep. 06, 2018 – NASA’s GPM Peers Under the Clouds of Hurricane Florence
Hurricane Florence became more powerful over the past few days while moving through the central Atlantic Ocean and wind speeds increased from tropical storm force to a Category 3 hurricane. The GPM core satellite provided a look under the clouds to investigate the rate rain in which was falling throughout the storm.

The Global Precipitation Measurement mission or GPM core observatory satellite passed over hurricane Florence on Sept. 5, 2018 at 1:14 a.m. EDT (0514 UTC). Data collected by the GPM satellite’s Microwave Imager (GMI) instruments showed the intensity and location of precipitation around the center of the hurricane. GPM’s GMI revealed that storms north of Florence’s eye were producing heavy rainfall a rate of 50 mm/2 inches per hour. The GPM satellite’s Dual-Frequency Precipitation Radar (DPR) only scanned the nearly rain-free areas to the west of the hurricane.
At NASA’s Goddard Space Flight Center in Greenbelt, Md. a 3D animation was created that showed the estimated heights of storms within hurricane Florence at the time of the GPM satellite pass. Heights are based on data observed by GPM’s radar (DPR Ku Band) blended with estimates from geostationary satellite cloud top temperatures. GPM is a joint mission between NASA and the Japan Aerospace Exploration Agency, JAXA.
At 5 a.m. EDT, the National Hurricane Center noted that Florence was weakening, although still a hurricane. It was centered near latitude 24.1 degrees north and longitude 47.9 degrees west. That’s about 1,060 miles (1,705 km) east-northeast of the Northern Leeward Islands and about 1,170 miles (1,885 km) east-southeast of Bermuda.
Florence is moving toward the northwest near 12 mph (19 kph). NHC forecasters said a turn toward the west-northwest with a decrease in forward speed is expected later today, followed by a turn toward the west by the weekend. Maximum sustained winds have decreased to near 115 mph (185 kph) with higher gusts. Florence is a category 3 hurricane on the Saffir-Simpson Hurricane Wind Scale. Some additional weakening is forecast today, but Florence is expected to remain a strong hurricane for the next several days.
Although still quite a distance from Bermuda, ocean swells generated by Florence will begin to affect Bermuda on Friday and will reach portions of the U.S. East Coast over the weekend. These swells are likely to cause life-threatening surf and rip current conditions.
Hurricane Florence is being steered toward the northwest by the Atlantic subtropical ridge. Early next week the National Hurricane Center (NHC) predicts that hurricane Florence will have moved to a location southeast of Bermuda. Interests in Bermuda should watch the progression of the storm.
For updates on Florence, visit: www.nhc.noaa.gov
By Rob Gutro / Hal Pierce
NASA’s Goddard Space Flight Center
Sep. 05, 2018 – NASA-NOAA’s Suomi NPP Satellite Sees Florence Strengthening into a Major Hurricane
NASA-NOAA’s Suomi NPP passed over strengthening Hurricane Florence in the Atlantic Ocean and observed powerful thunderstorms within a more organized storm.

Florence became the Atlantic Ocean’s third hurricane of the season on Sept. 4 at 11 a.m. EDT and continued to strengthen in the season’s first major hurricane at 8:35 a.m. EDT on Sept. 5.
On Sept. 5 at 1:06 a.m. EDT (0506 UTC) the Visible Infrared Imaging Radiometer Suite (VIIRS) instrument aboard NASA-NOAA’s Suomi NPP satellite captured an infrared image of Hurricane Florence.
The Infrared image provided forecasters with temperature data that showed where the strongest storms were located within the hurricane. Coldest clouds tops and strongest storms were around the center of circulation and a thick band of thunderstorms wrapping around the northern quadrant where temperatures were as cold as or colder than minus 70 degrees Fahrenheit (minus 56.6 Celsius). NASA research has shown that storms with cloud top temperatures that cold can produce heavy rainfall.
On Sept. 5 at 8:35 a.m. EDT (0900 UTC), the center of Hurricane Florence was located near latitude 21.7 degrees north and longitude 45.2 degrees west. That’s 1,185 miles (1,910 km) east-northeast of the Northern Leeward Islands.
Florence is temporarily moving toward the northwest near 13 mph (20 kph). A turn back toward the west-northwest is expected later today, and this general motion is expected to continue with Florence’s forward speed decreasing by the weekend.
Recent satellite imagery indicates that Florence is still strengthening and is now a major hurricane. Maximum sustained winds are estimated to be 120 mph (195 kph).
NHC forecasters expect a gradual weakening trend to begin tonight and continue through Friday, Sept 7. After that time, Florence is forecast to re-strengthen through the weekend.
For updated forecasts on Florence, visit: www.nhc.noaa.gov.
By Rob Gutro
NASA’s Goddard Space Flight Center
Sep. 04, 2018 – NASA Sees Tropical Storm Florence Still Feeling the Shear
NASA’s Aqua satellite showed that the center of Tropical Storm Florence’s circulation was still displaced to the southeast of the bulk of the storm indicating wind shear was still affecting the storm.

Infrared satellite data on Monday, Sept. 3 indicated vertical wind shear was affecting Florence. Imagery showed that the low-level center of Florence’s circulation was southeast of the bulk of the tropical cyclone’s clouds and that persists today, Sept. 4.
At 12:50 a.m. EDT (0450 UTC) on Sept. 4, the Moderate Resolution Imaging Spectroradiometer or MODIS instrument aboard NASA’s Aqua satellite looked Florence in infrared light. MODIS found coldest cloud tops had temperatures near minus 70 degrees Fahrenheit (minus 56.6 degrees Celsius) southeast of the bulk of Florence’s clouds.
At 5 a.m. EDT (0900 UTC), the National Hurricane Center or NHC noted “An earlier Advanced Microwave Scanning Radiometer 2 or AMSR2 (aboard the GCOM-W1 satellite) overpass revealed a rather obvious tilt toward the east-northeast, indicative of the moderate southwesterly shear.”
The center of Tropical Storm Florence was located near latitude 19.3 degrees north and longitude 42.0 degrees west. That’s about 1,300 miles (2,090 km) east-northeast of the Lesser Antilles.
Florence is moving toward the west-northwest near 13 mph (20 km/h), and this general motion is expected to continue for the next couple of days followed by a turn toward the northwest around Friday. Maximum sustained winds are near 70 mph (110 km/h) with higher gusts. Little change in strength is expected through tonight, but some weakening is forecast on Wednesday. Afterward, gradual strengthening is forecast through the weekend.
For updates on Florence, visit: www.nhc.noaa.gov
By Rob Gutro
NASA’s Goddard Space Flight Center
Sep. 03, 2018 – NASA Sees Dislocated Core of Tropical Storm Florence
Infrared data from NASA’s Aqua satellite showed that Florence’s center of circulation was south of the bulk of precipitation.
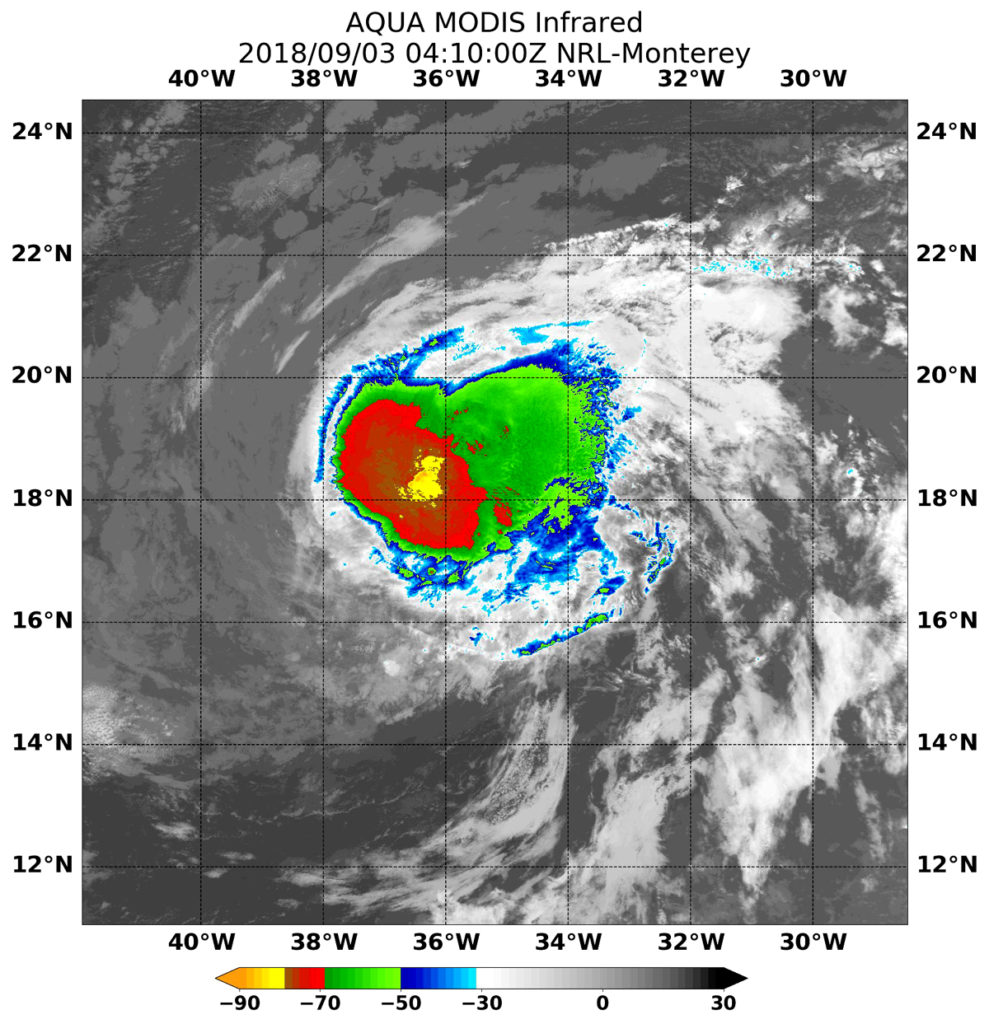
At 12:10 a.m. EDT (0410 UTC) on Sept. 3, the Moderate Resolution Imaging Spectroradiometer or MODIS instrument aboard NASA’s Aqua satellite looked at Florence in infrared light. MODIS found coldest cloud tops (yellow) around the center were as cold as or colder than minus 80 degrees Fahrenheit (minus 62.2 Celsius) southwest of the bulk of the storm.
The center was surrounded, mostly northeast, by slightly less powerful thunderstorms (red) with cloud top temperatures near minus 70 degrees Fahrenheit (minus 56.6 degrees Celsius). Storms with cloud top temperatures that cold have the capability to produce heavy rainfall.
By 5 a.m. EDT, the National Hurricane Center noted “Several recent microwave images indicate that the tropical storm’s center is still dislocated to the south of most of the associated convection, but convective banding has increased. There is also evidence that Florence has developed better defined low-level inner-core.”
At 5 a.m. EDT (0900 UTC), the center of Tropical Storm Florence was located near latitude 18.0 degrees north and longitude 37.5 degrees west. That’s about 895 miles (1,440 km) west-northwest of the southernmost Cabo Verde Islands.
The National Hurricane Center noted that Florence is moving toward the west-northwest near 16 mph (26 kph). The tropical storm is expected to move generally westward to west-northwestward at a slightly slower forward speed for the next several days. Maximum sustained winds are near 60 mph (95 kph) with higher gusts. Little change in intensity is expected over the next several days
Interests in Bermuda should watch the progression of Florence by the end of the week.
For updates on Florence, visit: www.nhc.noaa.gov
By Rob Gutro
NASA’s Goddard Space Flight Center
Sep. 02, 2018 – NASA Finds Wind Shear Affecting Tropical Storm Florence
NASA’s Terra satellite provided forecasters with a visible image of Tropical Storm Florence that showed it was still being affected by wind shear.

NASA’s Terra satellite passed over Tropical Storm Florence at 8:50 a.m. EDT (1250 UTC).
But the image provided by the MODIS instrument, or Moderate Resolution Imaging Spectroradiometer that flies aboard Terra, showed wind shear was pushing the bulk of clouds northeast of the center. The western quadrant was only circled by a wispy circle of clouds.
National Hurricane Center (NHC) Forecaster Stewart noted ” Florence’s convective cloud appearance has become rather disheveled this morning, with most of the deep convection sheared to the east and northeast of the now fully exposed but well-defined low-level circulation center. ”
NHC noted at 11 a.m. EDT (1500 UTC), Sept. 2, the center of Tropical Storm Florence was located near latitude 17.0 degrees north and longitude 33.2 degrees west. Florence is far from land areas and is about 605 miles (970 km) west-northwest of the southernmost Cabo Verde Islands.
Florence is moving toward the west-northwest near 18 mph (30 kph). A westward to west-northwestward motion at a similar forward speed is expected for the next few days. Maximum sustained winds have decreased slightly to near 50 mph
(85 kph) with higher gusts. Little change in strength is forecast during the next few days.
For forecast updates on Florence, visit the NHC website: www.nhc.noaa.gov
By Rob Gutro
NASA’s Goddard Space Flight Center
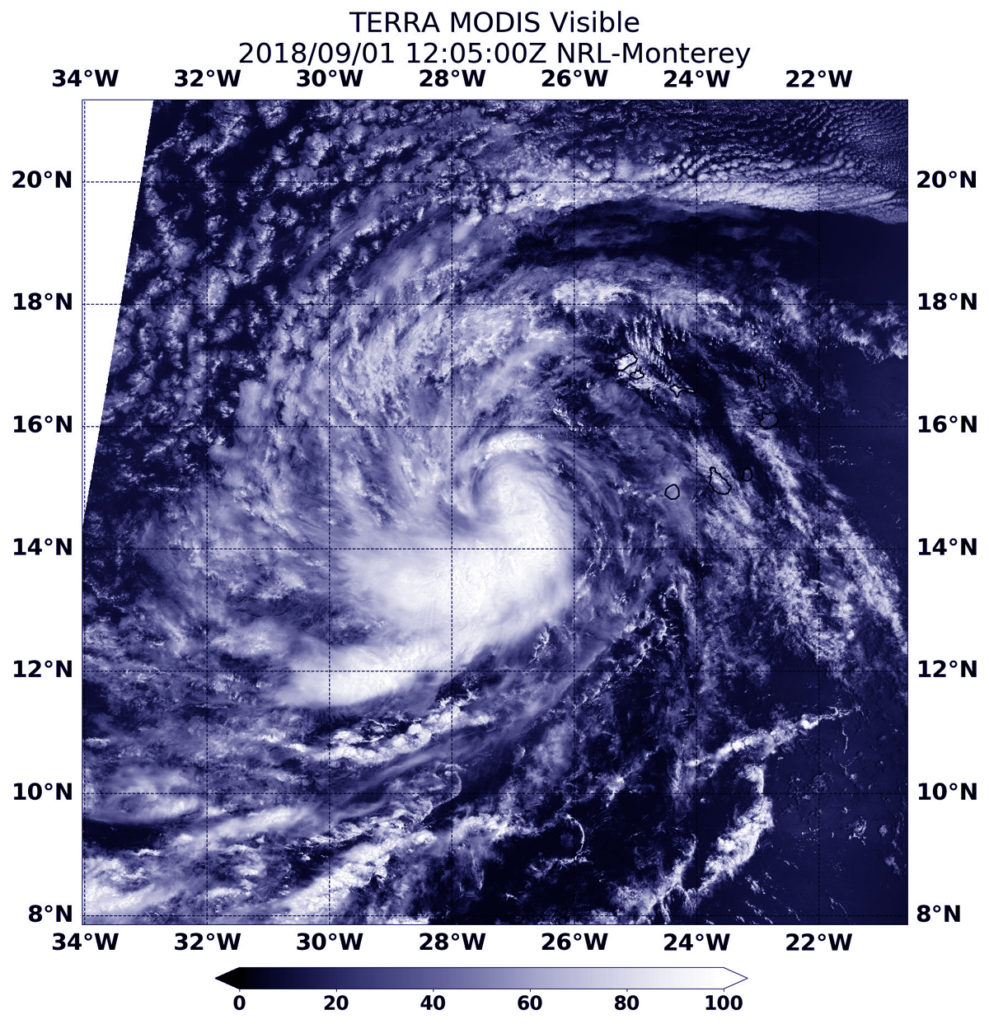
Sep. 01, 2018 – NASA Sees Tropical Storm Florence Develop Near African Coast
Potential tropical cyclone Six has organized in the overnight hours and strengthened into the sixth tropical storm of the Atlantic Ocean hurricane season. NASA’s Terra satellite passed over Tropical Storm Florence early on Sept. 1.
The system developed over western Africa and moved into the eastern Atlantic where it started to organize. On Aug. 31, a Tropical Storm Warning was posted for the Cabo Verde Islands of Santiago,
Fogo, and Brava as the low pressure area was moving west, passing the islands and staying to the south. On Sept. 1, that warning was discontinued. However, the system could still produce an additional 1 to 2 inches of rain across the southern Cabo Verde Islands today, Sept. 1. There are no coastal watches or warnings in effect.
On Sept. 1 at 8:05 a.m. EDT (1205 UTC) the Moderate Resolution Imaging Spectroradiometer or MODIS instrument aboard NASA’s Terra satellite provided a visible image of Florence. The MODIS image showed strong thunderstorms around the center, and in a thick band wrapping into the low-level center from the southwest.
A recent SSMIS instrument microwave image has revealed that the cyclone has become much better organized with more pronounced convective banding. The Special Sensor Microwave Imager (SSM/I) flies aboard the F8, F10, F11, F13, F14, F15, F16, and 17 polar-orbiting satellite platforms of the Defense Meteorological Satellite Program.
At 8 a.m. EDT (1200 UTC), the National Hurricane Center said the center of Tropical Storm Florence was located near latitude 14.6 degrees North and longitude 27.2 degrees west. Florence is moving toward the west-northwest near 14 mph (22 kph), and this general motion is expected to continue through Tuesday. On the forecast track, the center of Florence will continue to move away from the Cabo Verde Islands today.
Maximum sustained winds are near 40 mph (65 kph) with higher gusts. A gradual strengthening is forecast during the next several days.
For updates on Florence, visit: www.nhc.noaa.gov
By Rob Gutro
NASA’s Goddard Space Flight Center
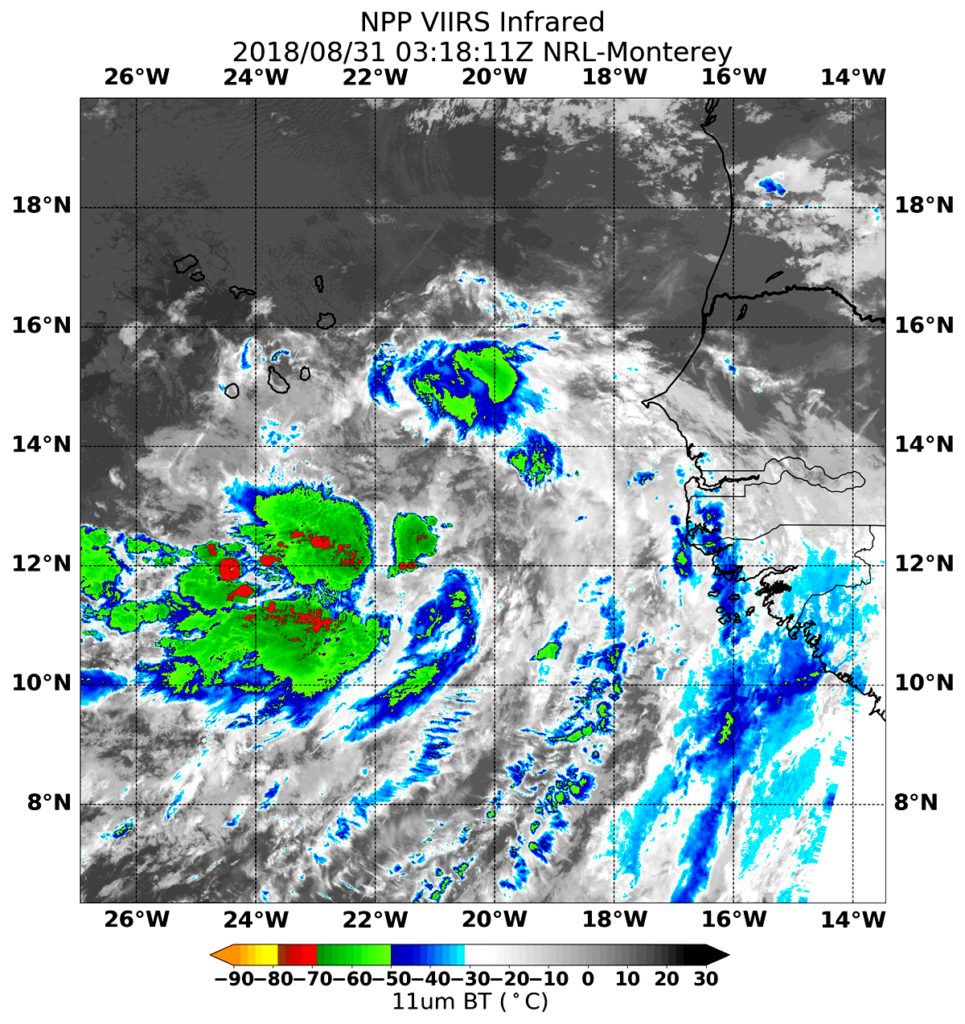
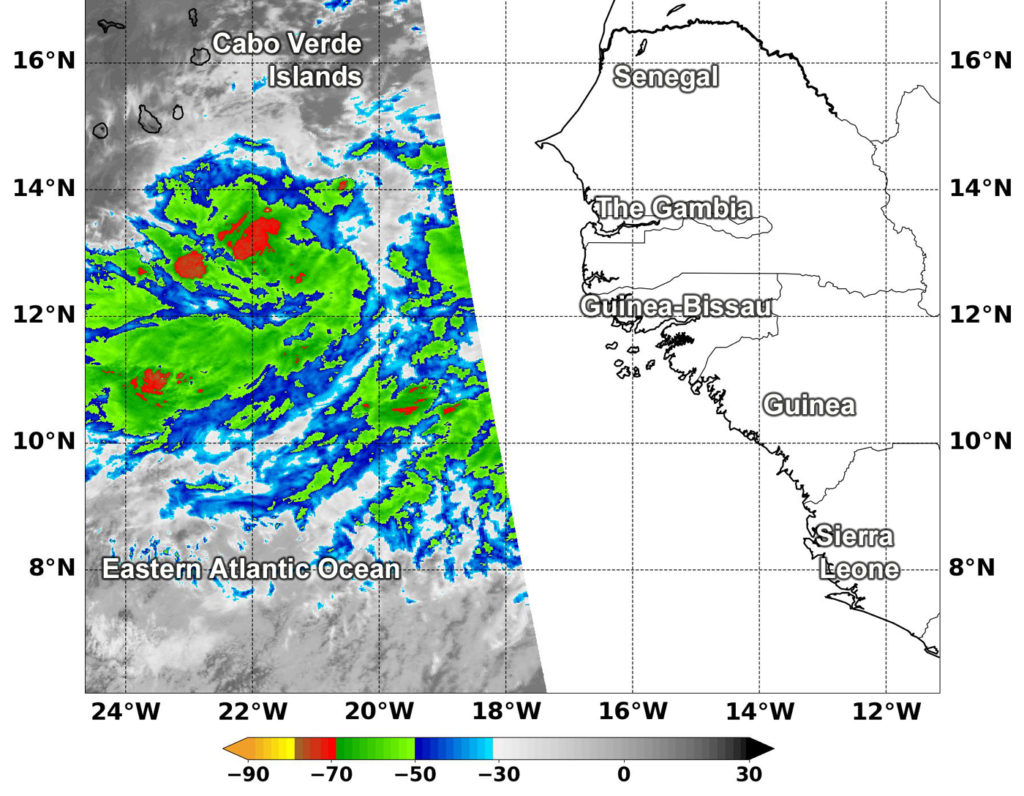
Aug. 31, 2018 – NASA Finds a Less Elongated Potential Tropical Cyclone Six
NASA-NOAA’s Suomi NPP satellite captured an infrared image of Potential Tropical Cyclone Six that shows the storm is not as “stretched out” as it was the previous day. Despite its lack of organization, a Tropical Storm Warning is in effect for the Cabo Verde Islands of Santiago, Fogo, and Brava.
Tropical storm conditions expected over the southern Cabo Verde islands later today, Aug. 31.
NASA-NOAA’s Suomi NPP satellite flew over Potential Tropical Cyclone Six on Aug. 30 at 11:18 p.m. EDT (Aug. 31 at 0318 UTC). The Visible Infrared Imaging Radiometer Suite (VIIRS) instrument aboard NASA-NOAA’s Suomi NPP satellite provided a visible image that showed the circulation is gradually becoming less elongated. Satellite data revealed that there is still relatively little deep convection near the estimated center of circulation. A few strong storms were found where cloud top temperatures were as cold as or colder than minus 70 degrees Fahrenheit (minus 56.6 degrees Celsius).
The National Hurricane Center said that “Most of the convection remains confined to the monsoon trough southwest of the center, where low-level convergence is strongest. Therefore, the system is not quite yet being designated as a tropical cyclone.”
At 8 a.m. EDT (1200 UTC), the disturbance was centered near latitude 13.7 degrees north and longitude 21.8 degrees west. The system is moving toward the west-northwest near 12 mph (19 kph), and this motion at a slightly faster forward speed is expected to continue for the next three to four days. On the forecast track, disturbance is expected to move near or over the southern Cabo Verde Islands as a tropical storm later today and tonight.
Maximum sustained winds are near 35 mph (55 kph) with higher gusts. Strengthening is forecast during the next several days, and the disturbance is expected to become a tropical storm later today or Saturday.
NHC said “Environmental conditions are favorable for the system to become a tropical cyclone later today.”
For updated forecasts, visit: www.nhc.noaa.gov
By Rob Gutro
NASA’s Goddard Space Flight Center
Aug. 30, 2018 – NASA Finds Some Strong Storms in Atlantic’s Potential Tropical Cyclone 6
The Northern Atlantic Ocean has only seen five storms so far this hurricane season and satellite data indicates a potential sixth tropical cyclone is forming in the far eastern Atlantic Ocean.
Because of the potential for a tropical cyclone to develop, a Tropical Storm Warning is in effect for Santiago, Fogo and Brava.
Infrared satellite imagery provides temperature data, and when NASA’s Aqua satellite passed over the low pressure area east-southeast of the Cabo Verde Islands, the coldest cloud tops appeared fragmented in four areas,
Cloud top temperatures determine strength of the thunderstorms that make up a tropical cyclone. The colder the cloud top, the stronger the uplift in the storm that helps thunderstorm development. Basically, infrared data helps determine where the most powerful storms are within a tropical cyclone.
The Moderate Resolution Imaging Spectroradiometer or MODIS instrument aboard Aqua provided that infrared data on Aug. 30 at 11:25 a.m. EDT (1525 UTC). MODIS data showed the strongest thunderstorms were north and southwest of the center of circulation. They were as cold as or colder than minus 70 degrees Fahrenheit (minus 56.6 degrees Celsius). NASA research indicates very cold cloud tops with the potential to generate very heavy rainfall.
The NHC noted that the developing system could produce total rain accumulations of 4 to 8 inches across the southern Cabo Verde Islands. These rains could produce life-threatening flash floods.
At 2 p.m. EDT (1800 UTC) on Aug. 30, the National Hurricane Center or NHC said the disturbance was centered near latitude 12.9 degrees north and longitude 19.0 degrees west. The system is moving toward the west near 12 mph (19 km/h), and this general motion with a gradual turn toward the west-northwest is expected to continue during the next few days. On the forecast track, the disturbance is expected to move near or over the southern Cabo Verde Islands on Friday, Aug. 31.
Maximum sustained winds are near 30 mph (45 kph) with higher gusts. Some strengthening is forecast during the next 48 hours, and the disturbance is expected to become a tropical storm during the next day or so.
NHC said “Environmental conditions are favorable for the system to become a tropical cyclone tonight or Friday”
For updated forecasts on this storm, visit: www.nhc.noaa.gov.