Vicky – Atlantic Ocean

Sep. 17, 2020 – NASA Finds a Fading Wispy Tropical Depression Vicky

NASA’s Terra satellite found Vicky to be a shadow of its former self, devoid of precipitation around its low-level center. Any precipitation had been pushed far to the northeast from wind shear. Vicky looked like a wispy ring of clouds on visible satellite imagery and nearby Hurricane Teddy is not helping.

Terra image of Vicky
On Sept. 17 at 9:25 a.m. EDT (1325 UTC), the MODIS instrument aboard NASA’s Terra satellite provided a visible image of Vicky in the eastern North Atlantic Ocean. The image showed a swirl of wispy clouds around the low-level center with the bulk of clouds pushed far to the east-northeast of the center. Credit: NASA/NRL

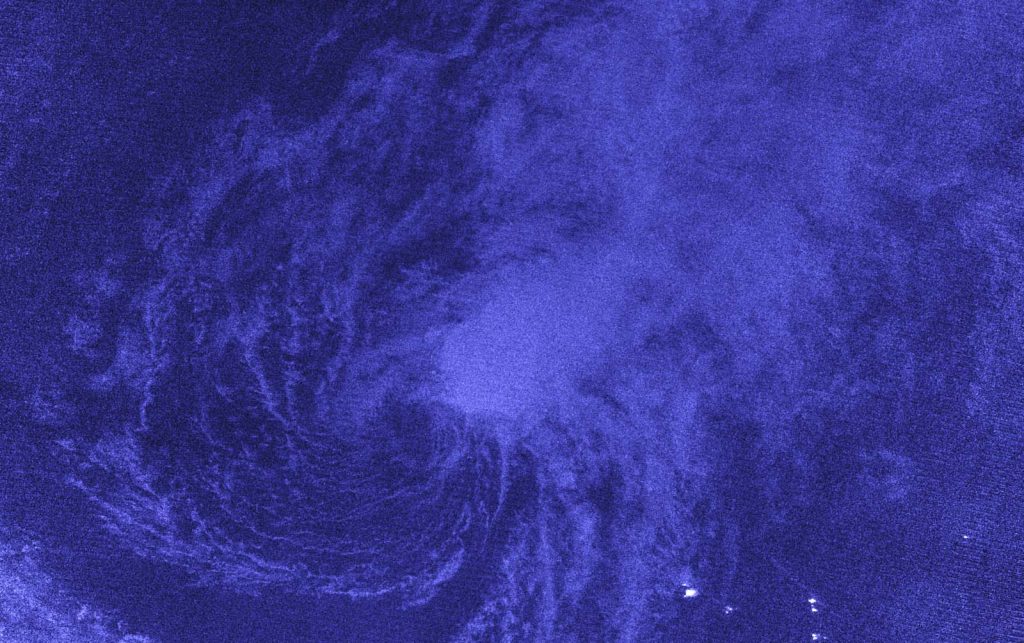
On Sept. 17 at 9:25 a.m. EDT (1325 UTC), the Moderate Resolution Imaging Spectroradiometer or MODIS instrument aboard NASA’s Terra satellite provided a visible image of Vicky in the eastern North Atlantic Ocean. The image showed a swirl of wispy clouds around the low-level center with the bulk of clouds pushed far to the east-northeast of the center.

Dan Brown, a Senior Hurricane Specialist at NOAA’s National Hurricane Center in Miami, Fla. noted at 11 a.m. EDT on Sept. 17, “Vicky is feeling the effects of very strong upper-level winds associated with the outflow of Hurricane Teddy.  These winds have caused the remaining convection to be stripped well away from the center, and recent ASCAT (a scatterometer instrument that measures winds) data indicates that Vicky has weakened to a tropical depression.”

Wind Shear Battering Vicky

Wind shear, that is, outside winds blowing at different directions at different levels in the atmosphere are battering Vicky. The NHC indicated that vertical wind shear of 40 to 50 knots is forecast to continue plaguing Vicky and the cyclone should continue to weaken and become a remnant low later today.

Vicky’s Status on Sept. 17

At 11 a.m. EDT (1500 UTC), the center of Tropical Depression Vicky was located near latitude 21.4 degrees north and longitude 38.2 degrees west. That is about 1,000 miles (1,610 km) west-northwest of the Cabo Verde Islands. The depression was moving toward the west near 14 mph (22 kph). Satellite wind data indicate that the maximum sustained winds have decreased to near 35 mph (55 kph) with higher gusts. The estimated minimum central pressure was 1008 millibars.

Vicky’s Fatal Forecast

A turn toward the west-southwest is expected later today, and that motion should continue through Friday. Additional weakening is forecast during the next day or so, and Vicky is expected to become a remnant low later today. The cyclone is forecast to dissipate Friday night or early Saturday, Sept. 19.

NASA Researches Earth from Space

For more than five decades, NASA has used the vantage point of space to understand and explore our home planet, improve lives and safeguard our future. NASA brings together technology, science, and unique global Earth observations to provide societal benefits and strengthen our nation. Advancing knowledge of our home planet contributes directly to America’s leadership in space and scientific exploration.

For updated forecasts, visit: www.nhc.noaa.gov

By Rob Gutro 
NASA’s Goddard Space Flight Center

Vicky – Atlantic Ocean

Sep. 16, 2020 – NASA Finds Wind Shear Not Letting Up on Tropical Storm Vicky

NASA’s Terra satellite obtained visible imagery of Tropical Storm Vicky as it continued moving through the eastern North Atlantic Ocean fighting strong wind shear. Outside winds are pushing at the storm and weakening it.

Terra image of Vicky
On Sept. 16, 2020 at 8:40 a.m. EDT (1240 UTC), NASA’s Terra satellite provided a visible image of Tropical Storm Vicky battling wind shear in the eastern North Atlantic Ocean. Image Courtesy: NASA/NRL

Terra Sees Wind Shear Tearing Vicky Apart

On Sept. 16, 2020 at 8:40 a.m. EDT (1240 UTC), the Moderate Resolution Imaging Spectroradiometer or MODIS instrument that flies aboard NASA’s Terra satellite captured a visible image of Tropical Storm Vicky battling strong southwesterly wind shear. The image showed wispy clouds had surrounded the center of circulation, while the wind shear was blowing the bulk of clouds and showers to the northeast of the center.

NASA’s Terra satellite is one in a fleet of NASA satellites that provide data for hurricane research.

About Wind Shear

The shape of a tropical cyclone provides forecasters with an idea of its organization and strength. When outside winds, or wind shear batters a storm, it can change the shape of it by pushing much of the associated clouds and rain to one side. Vicky has been in an area with strong southwesterly wind shear.

Dr. Michael Brennan, Branch Chief of NOAA’s National Hurricane Center noted in the 11 a.m. EDT (1500 UTC) Discussion, “Hostile vertical shear of 50 to 60 knots has finally taken a toll on Vicky. A 1227 UTC ASCAT-B overpass showed peak winds of 35 knots north of the center, and that is the basis for the advisory intensity. The strong shear is expected to continue while Vicky moves over marginal 26-27 degrees Celsius sea surface temperatures, so additional weakening is forecast. Vicky should become a tropical depression in around 24 hours before weakening to a remnant low in about 2 days, with dissipation expected by day 3.”

Vicky on Sept. 16

NOAA’s National Hurricane Center (NHC) noted at 5 a.m. EDT (0900 UTC), the center of Tropical Storm Vicky was located near latitude 21.6 degrees north and longitude 33.9 degrees west. Vicky is centered about 755 miles (1,215 km) west-northwest of the Cabo Verde Islands. Vicky is moving toward the west-northwest near 9 mph (15 kph). Maximum sustained winds are near 50 mph (85 km/h) with higher gusts. The estimated minimum central pressure is 1004 millibars.

Weakening Forecast for Vicky

A westward motion is expected to begin later today, followed by a west-southwestward motion by late Thursday [Sept. 17]. Gradual weakening is forecast over the next few days, and the system could become a remnant low on Thursday or Friday.

NASA Researches Earth from Space

For more than five decades, NASA has used the vantage point of space to understand and explore our home planet, improve lives and safeguard our future. NASA brings together technology, science, and unique global Earth observations to provide societal benefits and strengthen our nation. Advancing knowledge of our home planet contributes directly to America’s leadership in space and scientific exploration.

For updated forecasts, visit: www.nhc.noaa.gov

By Rob Gutro 
NASA’s Goddard Space Flight Center

Vicky – Atlantic Ocean

Sep. 15, 2020 – NASA-NOAA Satellite’s “Night Vision” Find Wind Shear Battering Tropical Storm Vicky

Infrared imagery is like having night vision, and NASA-NOAA’s Suomi NPP satellite provided a nighttime view of Tropical Storm Vicky that revealed outside winds are weakening the storm.

Suomi NPP Image of Vicky
NASA-NOAA’s Suomi NPP satellite passed the eastern north Atlantic Ocean overnight on Sept. 15 at 0335 UTC (Sept. 14 at 11:35 p.m. EDT) and captured a night-time image of Tropical Storm Vicky that revealed wind shear was pushing the bulk of its clouds to the northeastern quadrant of the storm. Credit: NASA Worldview, Earth Observing System Data and Information System (EOSDIS)

About Wind Shear 

The shape of a tropical cyclone provides forecasters with an idea of its organization and strength. When outside winds batter a storm, it can change the storm’s shape. Winds can push most of the associated clouds and rain to one side of a storm. Outside winds from the southwest are pushing against Tropical Storm Vicky.

In general, wind shear is a measure of how the speed and direction of winds change with altitude. Tropical cyclones are like rotating cylinders of winds. Each level needs to be stacked on top each other vertically in order for the storm to maintain strength or intensify. Wind shear occurs when winds at different levels of the atmosphere push against the rotating cylinder of winds, weakening the rotation by pushing it apart at different levels.

NASA’s Night-Time View of Vicky’s Wind Shear

The Visible Infrared Imaging Radiometer Suite (VIIRS) instrument aboard Suomi NPP provided a nighttime image of Vicky on Sept. 15 at 0335 UTC (Sept. 14 at 11:35 p.m. EDT) using infrared imagery. That imagery revealed strong southwesterly wind shear was pushing the bulk of its clouds to the northeastern quadrant of the storm.

In the NHC Discussion at 5 a.m. EDT on Sept. 15, Eric Blake, senior hurricane specialist at NOAA’s National Hurricane Center in Miami, Fla. noted, “Vicky remains sheared this morning with strong upper-level winds causing any deep convection to be located northeast of the center. The low-level circulation has also become distorted as well, with new bursts of convection causing the mean circulation to re-form to the north.”

The image was created using the NASA Worldview application at NASA’s Goddard Space Flight Center in Greenbelt, Md.

Vicky’s Status on Sept. 15

NOAA’s National Hurricane Center (NHC) noted at 5 a.m. EDT (0900 UTC), the center of Tropical Storm Vicky was located near latitude 20.3 degrees north and longitude 30.1 degrees west. Vicky is 500 miles (800 km) northwest of the Cabo Verde Islands. Vicky is moving toward the northwest near 9 mph (15 kph), and a turn toward the west-northwest is expected within the next day or so, followed by a turn toward the west. Maximum sustained winds are near 50 mph (85 kph) with higher gusts. The estimated minimum central pressure is 1004 millibars.

Vicky’s Fading Forecast

Weakening is forecast due to strong upper-level winds during the next 48 hours, and Vicky is likely to degenerate into remnant low by Wednesday, Sept. 16.

About NASA’s EOSDIS Worldview

NASA’s Earth Observing System Data and Information System (EOSDIS) Worldview application provides the capability to interactively browse over 700 global, full-resolution satellite imagery layers and then download the underlying data. Many of the available imagery layers are updated within three hours of observation, essentially showing the entire Earth as it looks “right now.”

NASA Researches Earth from Space

For more than five decades, NASA has used the vantage point of space to understand and explore our home planet, improve lives and safeguard our future. NASA brings together technology, science, and unique global Earth observations to provide societal benefits and strengthen our nation. Advancing knowledge of our home planet contributes directly to America’s leadership in space and scientific exploration.

For updated forecasts, visit: www.nhc.noaa.gov

By Rob Gutro 
NASA’s Goddard Space Flight Center

Vicky – Southern Pacific Ocean

Feb. 24, 2020 – NASA’s Aqua Satellite Sees Tropical Cyclone Vicky Dissipating

Three days after American Samoa had tropical storm warnings from Tropical Cyclone Vicky, the storm had moved far to the south and was dissipating in the Southern Pacific Ocean. NASA’s Aqua satellite provided forecasters with a visible image of the fading former tropical cyclone on Feb. 24.

On Feb. 24, 2020 at 0120 UTC (Feb. 23 at 8:20 p.m. EST), the MODIS instrument that flies aboard NASA’s Aqua satellite provided a visible image of the dissipating Tropical Cyclone Vicky in the Southern Pacific Ocean. Credit: NASA/NRL

On Feb 21, the Joint typhoon warning center issued the final warning on Vicky. At 2100 GMT or 4 p.m. EST Vicky had maximum sustained winds near 35 knots (40 mph). At that time, it was located near 17.3 degrees south latitude and 169.7 degrees west longitude about 109 nautical miles north of Niue.

On Feb. 24, 2020 at 0120 UTC (Feb. 23 at 8:20 p.m. EST), the Moderate Imaging Spectroradiometer or MODIS instrument that flies aboard NASA’s Aqua satellite provided a visible image of the dissipating Tropical Cyclone Vicky in the Southern Pacific Ocean. The Aqua image showed wispy clouds devoid of rainfall, circling a weak center. Vicky’s remnants are expected to dissipate later in the day.

NASA’s Aqua satellite is one in a fleet of NASA satellites that provide data for hurricane research.

Tropical cyclones are the most powerful weather event on Earth. NASA’s expertise in space and scientific exploration contributes to essential services provided to the American people by other federal agencies, such as hurricane weather forecasting.

Rob Gutro
NASA’s Goddard Space Flight Center, Greenbelt, Md.

Vicky – Southern Pacific Ocean

Feb. 21, 2020 – NASA Measures Rainfall Rates in Two American Samoa Tropical Cyclones

There are two tropical cyclones affecting American Samoa in the South Pacific Ocean on Feb. 21. Tropical Storm Vicky has triggered warnings, while Tropical Cyclone 18P continues to develop. The Global Precipitation Measurement mission or GPM satellite provided a look at the rainfall rates occurring in both storms.

GPM image of Vicky
The GPM’s core satellite passed over the South Pacific Ocean on Feb. 20 at 10:20 p.m. EDT (0220 UTC, Feb. 21). GPM found heaviest rainfall (orange) occurring in both Tropical Cyclone 18P and Tropical Storm Vicky, falling at rates of 1 inch (25 mm) per hour. Light rain appears around those heavier rainfall areas and throughout the rest of the tropical cyclones (light blue), falling at less than 0.2 inches (less than 5 millimeters) per hour. Credit: NASA/NRL

Vicky is located to the southeast of American Samoa and 18P is located to the northwest. American Samoa is a U.S. territory covering seven islands and atolls. The capital city of Pago Pago is located on Tutuila, the largest island.

The National Weather Service (NWS) in Pago Pago issued a Tropical Storm Warning on Feb. 21 for American Samoa, and coastal waters out to 40 nautical miles including National Marine Sanctuary of American Samoa.

In addition, a High Surf Warning remains in effect that states, “Hazardous surfs of at least 20 feet, with locally higher sets, will impact coastal waters, especially west through south facing shores of all islands due to the intensification of Tropical Storm Vicky south of the islands.” A Flash Flood Watch is also in effect for all of American Samoa.

The GPM’s core satellite passed over the South Pacific Ocean on Feb. 20 at 10:20 p.m. EDT (0220 UTC, Feb. 21). GPM found heaviest rainfall occurring in both Tropical Cyclone 18P and Tropical Storm Vicky, falling at rates of 1 inch (25 mm) per hour. Light rain appeared around those areas and throughout the rest of the tropical cyclones, falling at less than 0.2 inches (less than 5 millimeters) per hour.

On Feb. 21 at 4 a.m. EST (0900 UTC), Vicky was located near latitude 15.7 degrees south and longitude 170.7 degrees west, about 84 nautical miles south of Pago Pago, American Samoa. Vicky was moving to the south and had maximum sustained winds 40 knots (46 mph/74 kph).

Vicky is gradually weakening and the Joint Typhoon Warning Center expects it to weaken below tropical cyclone strength before passing near Niue within 24 hours.

Tropical cyclones/hurricanes are the most powerful weather events on Earth. NASA’s expertise in space and scientific exploration contributes to essential services provided to the American people by other federal agencies, such as hurricane weather forecasting.

GPM is a joint mission between NASA and the Japan Aerospace Exploration Agency, JAXA.

For updated forecasts from the NWS in Pago Pago, visit: https://www.weather.gov/ppg/?lang=english

By Rob Gutro
NASA’s Goddard Space Flight Center