AGU2011: How Shifting Storm Tracks Are Amplifying Climate Change


Tropical cyclones and hurricanes generate the most headlines, but it’s mid-latitude storms churning through heavily populated parts of North America, Europe, and Asia that make the weather most of us actually experience.

Climate models predict that these mid-latitude storms should shift poleward and that the intensity and frequency of the storms could change as global temperatures rise, but actual evidence of such a shift has been difficult to pin down. However, a recently published analysis of 25 years of cloud data captured by satellites offers a compelling piece of evidence that suggests storm tracks are indeed shifting.

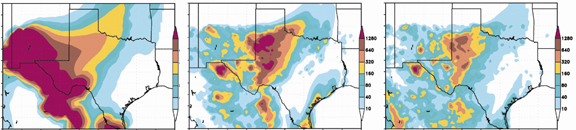
The research, led by (former) Scripps Institute of Oceanography scientist Frida Bender, shows that storms tracks have shifted poleward, narrowed, and grown less cloudy since 1983, particularly in the Southern Hemisphere. The analysis, based on data from the International Satellite Cloud Climatology Project, finds that storm tracks have shifted by about 0.4 degrees over the last 25 years.

What’s more, the analysis suggests that changes in the location and intensity of storms could amplify global warming. The researchers detected what amounts to a 2 percent decline in storm tracks over the 25 year record. The decline in cloudiness is of particular importance because it suggests that intensity of storms is likely decreasing. And since clouds reflect large amounts of sunlight, reduced cloudiness means that ocean surfaces beneath storm systems are likely growing warmer.

Graeme Stephens, the director of NASA’s Center for Climate Science at the Jet Propulsion Laboratory, underscored the importance of the study in a piece published by Nature Climate Change noting:

Bender and colleagues’ study reminds us of the importance of changes in the large-scale clouds associated with frontal storms in storm-track regions. Not only do the polewards shifts in storm-track location profoundly affect precipitation patterns in mid-latitude regions, but associated changes in cloudiness also exert a significant positive feedback on global warming.

Text by Adam Voiland. Frida Bender presented a poster about the topic  at an American Geophysical Union Meeting on Dec. 6, 2011. The full paper is available here. Video of Midwest tropical storm originally published by NASA’s Earth Observatory. 

The Curious Case of Lake Superior's Shrinking Cloud Street Droplets


Parallel lines of cumulus clouds often appear when frigid, dry winds rush over comparatively warm bodies of water. NASA satellites have observed the striking cloud formations – which atmospheric scientists call “cloud streets” — over the Hudson Bay, Greenland Sea, Bering Sea, and the Amery Ice Shelf a number of times in the past.

Recently, University of Wisconsin scientist Steve Ackerman was combing through data from NASA’s MODIS instrument as part of an effort to catalog and classify different cloud types. Something about the street clouds in this image of Lake Superior (above) struck him as peculiar. We caught up with him during a poster session at an American Geophysical Union meeting in San Francisco to find out more.

WoE: What are we looking at here?

Ackerman: These are cloud streets. They’re really quite interesting clouds. They occur when you get cold air blowing over warm water. You get them frequently over the Great Lakes and off the East Coast as well.

WoE: What was it about this particular cloud street set that you found notable?

Ackerman: We actually looked at a series of these, and what we found was that the clouds start small, grow in altitude, get thicker optically, and then do something quite strange and unexpected.

WoE: Strange and unexpected? Please explain…

Ackerman: Yes, often what happens is that the size of the cloud droplets grow as we’d expect at first, but then partway across the lake the size of the particles starts to decrease.

WoE: And that’s surprising?

Ackerman: Yes, we have no idea why they’d do that. They should be getting progressively bigger as they move across the lake and pick up moisture.

WoE: About how big are these cloud droplets, and how do they change over time?

Ackerman: They start off at about 5 microns. (For reference, human hair is about 100 microns.) They grow up to about 20 microns, and then they drop down to 10 microns.

WoE: How long does that process take?

Ackerman: About four hours.

WoE: Why do think it’s happening? 

Ackerman: We’re really not sure. Perhaps dry air is coming in from above.

WoE: Is this the only time you’ve observed this phenomenon?

Ackerman: It’s pretty rare. We found it in the MODIS imagery in the five years that we looked about 15 times.

WoE: What makes a peculiar phenomenon like this worth studying?

Ackerman: The next step is to work with cloud modelers and to see if they’re modeling things well enough to explain what’s going on. If the models can’t recreate unusual events like these cloud streets, we know they’re not getting things right. We need models to get the global climate right, and also the weather prediction right. 

The top image comes from the Moderate Resolution Imaging Spectroradiometer (MODIS).  The other two images are courtesy of Steve Ackerman.

–Adam Voiland, NASA’s Earth Science News Team

Speaking of Contrails…

The prospect of a renegade missile transfixed newscasters last week after a videographer captured imagery of an unusual contrail near the coast of California. The now notorious plume initially baffled commentators as it seemed to point vertically into space and appeared larger than a standard airplane contrail.

The reality, which trickled out in the days following the uproar, turned out to be far less dramatic than some of the more inventive theories circulating. Most experts now say the mysterious plume was the product of a jet. The time of day and the particular trajectory of the jet conspired to create the illusion.

Sure, it might seem like a letdown, but here at What on Earth we would argue that jet contrails are perfectly fascinating in their own right. Where on Earth do they come from? The cirrus-cloud like condensation trails form when water vapor condenses and freezes around tiny airborne particles called aerosols that spill from jet engines. 

NASA Langley Research Center, in Hampton, Va., hosts a thorough website that’s well-worth a look for those who happen to be contrail-curious. Langley points out, for example, that contrails are hardly monolithic, noting that there are actually three major varieties of contrails: short-lived, persistent, and persistent spreading.  Here’s how Langley describes the three types: 

Short-lived contrails look like short white lines following along behind the plane, disappearing almost as fast as the airplane goes across the sky, perhaps lasting only a few minutes or less. The air that the airplane is passing through is somewhat moist, and there is only a small amount of water vapor available to form a contrail. The ice particles that do form quickly return again to a vapor state.

Persistent (non-spreading) contrails look like long white lines that remain visible after the airplane has disappeared. This shows that the air where the airplane is flying is quite humid, and there is a large amount of water vapor available to form a contrail. Persistent contrails can be further divided into two classes: those that spread and those that don’t. Persistent contrails look like long, narrow white pencil-lines across the sky.

Persistent spreading contrails look like long, broad, fuzzy white lines. This is the type most likely to affect climate because they cover a larger area and last longer than short-lived or persistent contrails.

Meanwhile, Our Changing Planet, a book co-edited by a number of NASA scientists that offers a good overview of remote sensing, devotes a chapter to climate impacts of the ubiquitous artificial clouds. Via Our Changing Planet:

Persistent contrails also play a role in climate because they reflect sunlight and trap infrared radiation just like their naturally formed cousins.  Thus, the presence of a contrail cluster in an otherwise clear sky can diminish the amount of solar energy reaching the surface during the daytime and increase the amount of infrared radiation absorbed in the atmosphere at all times of day. Currently, the overall impact appears to be a warming effect, but research is continuing to unravel the role of this phenomenon in climate change.    

Another interesting tidbit from Our Changing Planet:

Persistent contrails can often grow into natural-looking cirrus clouds within a few hours, a phenomenon that is best observed from space.  Although they typically last for only 4-6 hours, some clusters have been observed to last more than 14 hours and travel thousands of kilometers before dissipating. These persistent contrails are estimated to have caused cirrus cloud cover to rise by three percent between 1971 and 1996 over the United States and are well-correlated with rising temperatures, though not the only cause of them. Increasing traffic in nearly every country of the world will cause a rise in global cirrus coverage unless the upper troposphere dries out or advances in air traffic management and weather forecasting or in aircraft propulsion systems can be used to minimized contrail formation.   


Indeed. Take a look at this mesmerizing data visualization of just a mere day of air traffic…


–Adam Voiland, NASA’s Earth Science News Team


Photo above of contrails in a star pattern by John Pertig, courtesy of NASA Langley Research Center.

Reading the Sky

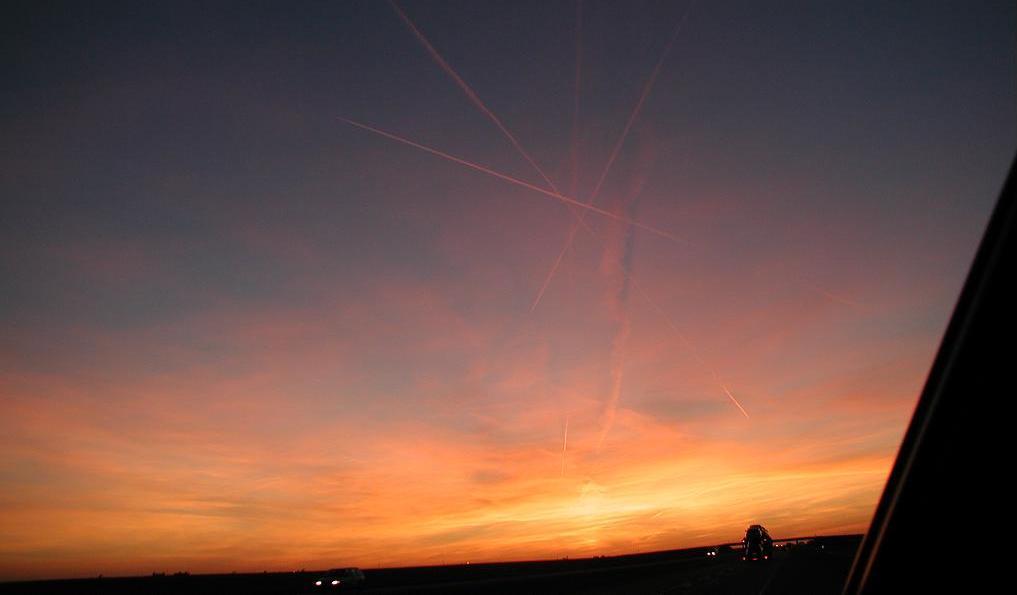
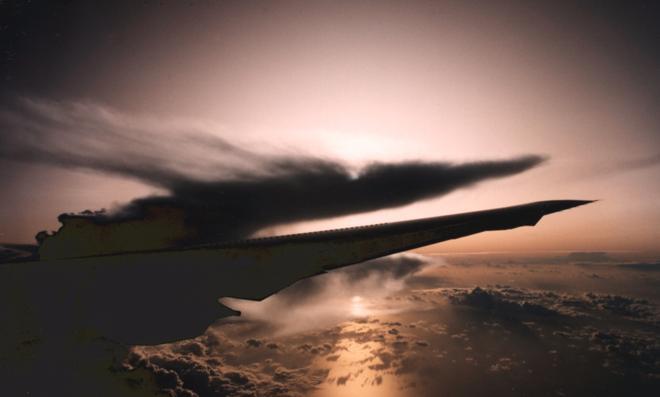
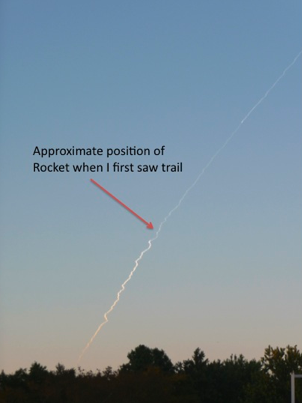
Recently, a colleague and I caught a glimpse of an odd-looking contrail stretching across the sky. As we stood there and studied it, my colleague made in interesting observation.

“That’s the trail from a rocket launch,” he said. He was referring to a launch from NASA’s Wallops Flight Facility, which is about 70 miles northeast of our location at NASA Langley in Hampton, Va.

A contrail is formed when hot, humid air from exhaust mixes with cold, dryer air at high altitudes. The condensation trail forms a cloud that shows the passage of the aircraft (or, in this case, a spacecraft). Contrails can change and move easily, and by studying them we can determine how they affect Earth’s energy budget.

It can be hard to read the sky correctly because the curvature of the Earth produces some confusing optical effects. In this case, our ground perspective about 70 miles from the launch made the trail appear at first as a regular contrail crossing the sky horizontally.

But as I continued to watch, it became clear that this was no ordinary contrail. Rather than continuing across the sky, the trail clearly became higher and higher until it vanished entirely as the rocket left the bulk of the atmosphere behind.

Aside from that high arc, this trail had some other odd features. Unlike a typical contrail, which is usually pretty smooth, this one looked narrow and wiggly. Those wiggles, I discovered, were the result of adjustments in the pointing of the rocket as it zoomed through the atmosphere. This is apparent in the video of the launch.

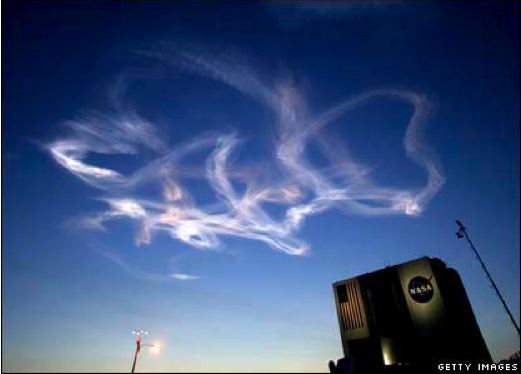
The winds were relatively light that evening, so about 45 minutes later the trail was still clearly visible overhead. However, there was just enough wind to twist the contrail into something that could have been left behind by a crazed aerobatic pilot.

I searched the web and found the picture on the left from a Shuttle launch, which gives you some idea of what we saw.

From my point of view on the ground, there was nothing to tell me that those loops weren’t a horizontal set of circles made by a plane flying at a constant altitude. But since I knew that a rocket had left the trail, I could correctly interpret them as a spiral up to higher levels of the atmosphere.

While this experience is an extreme example, it points out the perspective problems at work whenever we look up at the sky.

Nonetheless, our Earthly perspective is valuable to learning more about clouds’ behavior, and with the help of satellites, we can get a little closer to understanding how clouds affect our climate system.

— By Dr. Lin Chambers, NASA Langley Research Center

— Top photo courtesy of Allen Kilgore, NASA Langley Research Center

Soaring for Science

NASA's Global Hawk autonomous plane

The newest bird in NASA’s flock — the unmanned Global Hawk — took off at 7 a.m. Pacific time today (April 2) from Dryden Flight Research Center at Edwards Air Force Base in California. The flight is the first airborne checkout of the plane since it was loaded with 11 science instruments for the Global Hawk Pacific (GloPac) mission.

Pilots are also streamlining processes to coordinate the workload while the nearly autonomous plane is flying at altitudes above 60,000 feet (almost twice as high as a commercial airliner). Operators and mission researchers are using the day to make sure all instruments are operating properly while in flight — particularly at the cold temperatures of high altitude — and communicating clearly with the plane and ground controllers. Mission participants expect to begin collecting data when actual GloPac science flights begin over the Pacific Ocean later this month.

GloPac is the Global Hawk’s first scientific mission. Instruments will sample the chemical composition of air in Earth’s two lowest atmospheric layers — the stratosphere and troposphere — and profile the dynamics and meteorology of both. They also will observe the distribution of clouds and aerosol particles. The instruments are operated by scientists and technicians from seven science institutions and are funded by NASA and the National Oceanic and Atmospheric Administration (NOAA).

Paul Newman, the co-mission scientist for GloPac, has been blogging about the mission on Earth Observatory’s “Notes from the Field” site. Here are a few excerpts to whet your appetite…

…There is an old Latin quote: “Maxima omnium virtutum est patientia.” Or “patience is the greatest virtue.” When it comes to mounting science instruments on an aircraft, you need to continually return to that quote…

…During the integration this week, we’ve had to cut holes into the aircraft. I told Chris Naftel, the Global Hawk project manager, that we had to cut some holes into the plane for the Meteorological Measurement System. Chris replied: “I don’t want to hear anything about the holes. It pains me!” In spite of Chris’ pain, the little holes are critical for measuring winds. You’re now asking, what? Little holes? For winds? It’s actually a very slick little measurement that relies on the work of Daniel Bernoulli, a Dutch mathematician who lived in the 1700s…

Read more here …

Can Something Out in Space be Good for Your Health on Earth?

An animation from Morain’s Center, viewable online by local residents, captured a storm crossing southeast Arizona and southwest New Mexico on Jan. 6-8, 2008. This clip, part of a 48-hour dust forecast, centers on the hour of peak dust concentration in the towns of Wilcox and Silver City. Credit: Morain/Earth Data Analysis Center

Stanley Morain is not an asthmatic. But like a lot of other healthy people, his lungs are sensitive to dust in the air in his hometown of Albuquerque. Dust makes him cough. It makes his eyes tear. It makes him pretty miserable.

Morain believed that if he — a healthy individual — is affected by the dust storms common to the American southwest, then hundreds of thousands of asthmatics must be affected far more severely when millions of tiny particles nestle into their respiratory systems.

His career has led him to a spot as director of the Earth Data Analysis Center at the University of New Mexico, where he has encouraged his colleagues and students to follow their hearts in the projects they pursue. He’s set the example by spending 10 years using NASA satellite data to create daily dust forecasts to improve health alerts.

I caught up with Morain a few days before he left for the American Meteorological Society’s annual meeting, where he gave a talk Tuesday about his work. He’s especially excited about decisions by the United Nations and the Joint Board of Geospatial Information Societies to publish his latest dust modeling work this spring.

WhatOnEarth: How did you decide to focus your career on using satellite sensors to improve public health?

Morain: The thought first struck me years ago, before I got my doctorate in biogeography and before I was awarded my first NASA research grant in 1964. I’ve always been fascinated by the geographic aspects of health even when I worked on NASA projects as dissimilar as lunar landers in the 1960s. I found we could combine information technology and modeling to learn more about health problems like heart attacks, Valley Fever, and hantavirus pulmonary syndrome that frequently strikes and kills young, otherwise healthy people within 24 hours.

WhatOnEarth: The Centers for Disease Control estimate 16.4 million adults and 7 million children in the U.S. suffer from asthma. How do your dust alerts help them?

Morain: Well, we’re not yet operational on a large-scale basis. That would take a commercial firm stepping in to make our alerts available nationwide. But, in my own backyard, the alerts are helping asthmatics plan for the worst days. Dust is a real problem here. When people know dust is headed their way, they can adapt their plans to minimize time outdoors or increase the dosage of some asthma medications. We’re making the alerts available, by way of summaries of dust and air quality conditions, to everyone from school nurses to TV news broadcasters to epidemiologists who are concerned about how long-term dust exposure affects the overall population.

WhatOnEarth: How do NASA satellites play into the development of the alerts?

Morain: There are environmental triggers for diseases like asthma. Very fine pollutant particles called aerosols are key examples of such triggers. NASA satellites like Terra and Aqua have instruments that can “see” the path dust takes. When you merge dust modeling information from the satellites with the National Weather Service weather forecasting model, you get a product that tells you when a weather event will bring dust along with it. The product becomes the basis for our daily dust alerts.

Three generations of model improvements for a dust storm across New Mexico and Texas on 15-16 December, 2003 illustrate (left) model performance before and (middle) after satellite data were included; and (right) the same storm modeled by the higher resolution, weather forecasting model Morain’s team uses. Credit: Morain/Earth Data Analysis Center

— Gretchen Cook-Anderson, NASA’s Earth Science News Team

Flying high with NASA's Joanne Simpson

Joanne Simpson, the first woman to earn a PhD in meteorology, didn’t just break into a field where women weren’t welcome. She broke the door down and accumulated a list of scientific achievements that’s rare for any scientist, regardless of gender.

Early in her career, she made the key insight that narrow cumulonimbus clouds–she called them “hot towers” — are the engines that drive tropical circulation and help sustain the eyes of hurricanes. Later, she became one of the first scientists to develop a cloud model, an advance that ultimately sparked a whole new branch of meteorology. She spent decades with NASA, helping to lead the Tropical Rainfall Measurement Mission, a satellite that’s led to key insights about how hurricanes start and how dust affects precipitation. And she was a key proponent for the upcoming Global Precipitation Measurement (GPM), the follow up satellite to TRMM.

No stranger to controversy, she stirred up a scientific furor when she sought to test the validity of her cloud model by experimenting with cloud seeding. Even well into her eighties, Simpson didn’t shy from vigorous debate about the scientific basis of global warming.

In March, at the age of 86, Simpson passed away in Washington, D.C. In a recent interview with the Discovery Channel, a producer asked her what was the most fascinating thing about studying the atmosphere. “In my case, it’s the clouds,” she said without hesitation. “There are some beautiful ones out there right now,” she said while gesturing toward the window.

In tribute to Simpson’s efforts to understand clouds, we’ve chosen four of our favorite cloud images from a series of images that Simpson donated to the NOAA Photo Library and likely took. The photographs were taken from NASA’s DC-8 during the TOGA-COARE project in the 1990s.

Joanne Simpson Portrait Information: Illustration by Martin Mueller of NRC and NASA GSFC via NASA’s Earth Observatory.


Puffy fair weather cumulus clouds and hints of reefs are visible below the right wing of NASA’s DC-8. Credit: NOAA Photo Library/Dr. Joanne Simpson Collection


A towering example of a showering anvil cloud roils over the Pacific Ocean. Credit: NOAA Photo Library/Dr. Joanne Simpson Collection


Dusk falls over the Pacific Ocean with a large cumulonimbus cloud in the distance. Credit: NOAA Photo Library/Dr. Joanne Simpson Collection

— Adam Voiland, NASA’s Earth Science News Team