A ‘Dizzying Dance in the Air’ for Science

by Joy Ng / WESTERN COLORADO /

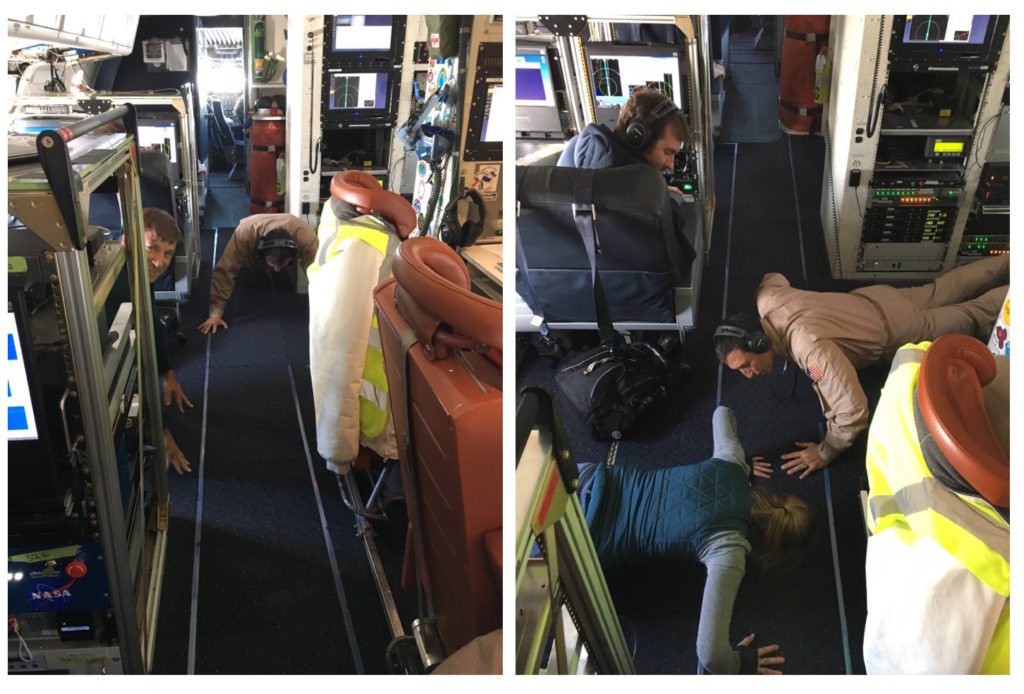
As I walked down the aisle of a plane with a camera clasped between my two sweaty palms, I had two thoughts on my mind: First, my footsteps feel very heavy; second, I hope I can film without vomiting. As you might guess, this was no ordinary flight.
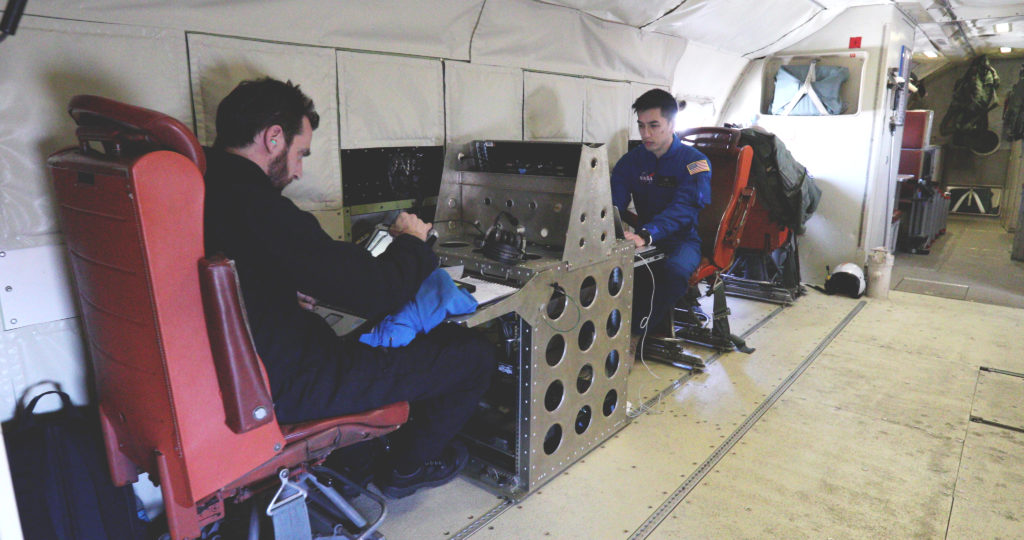
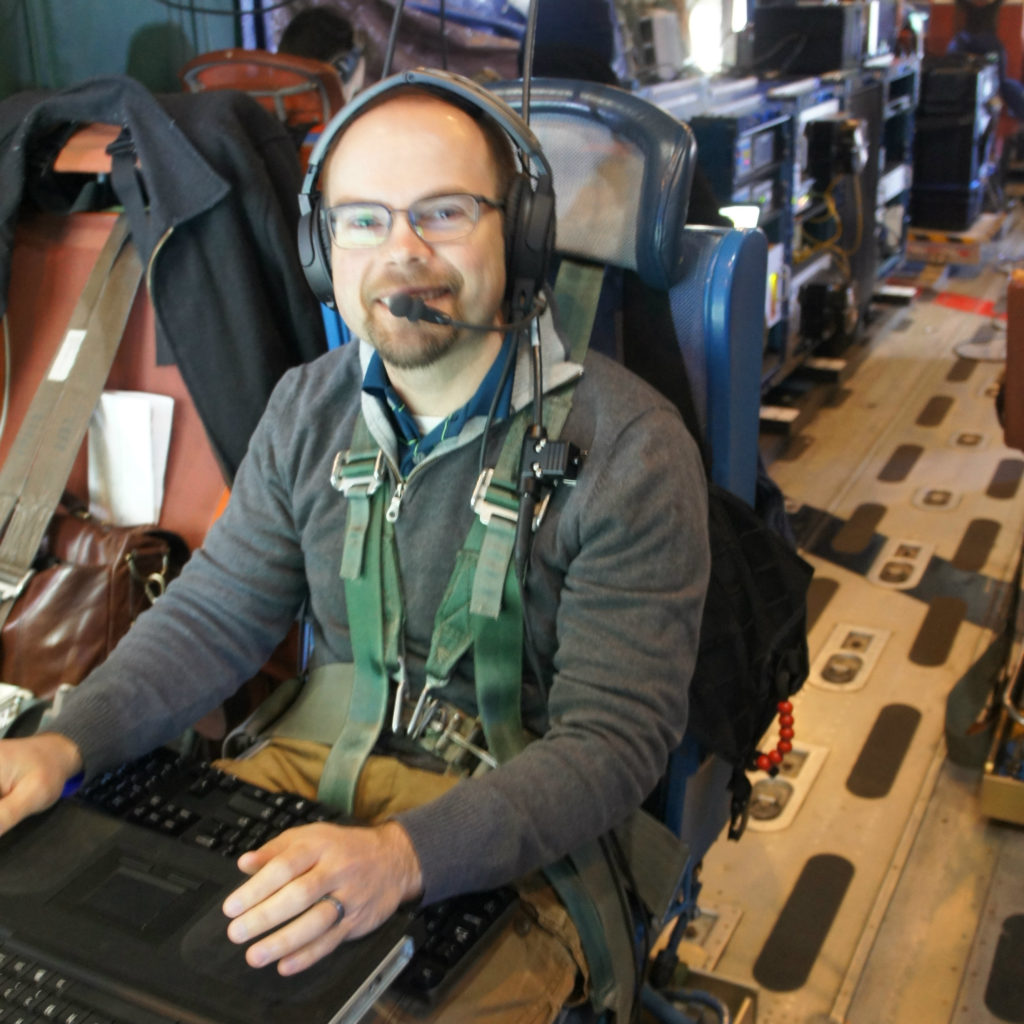
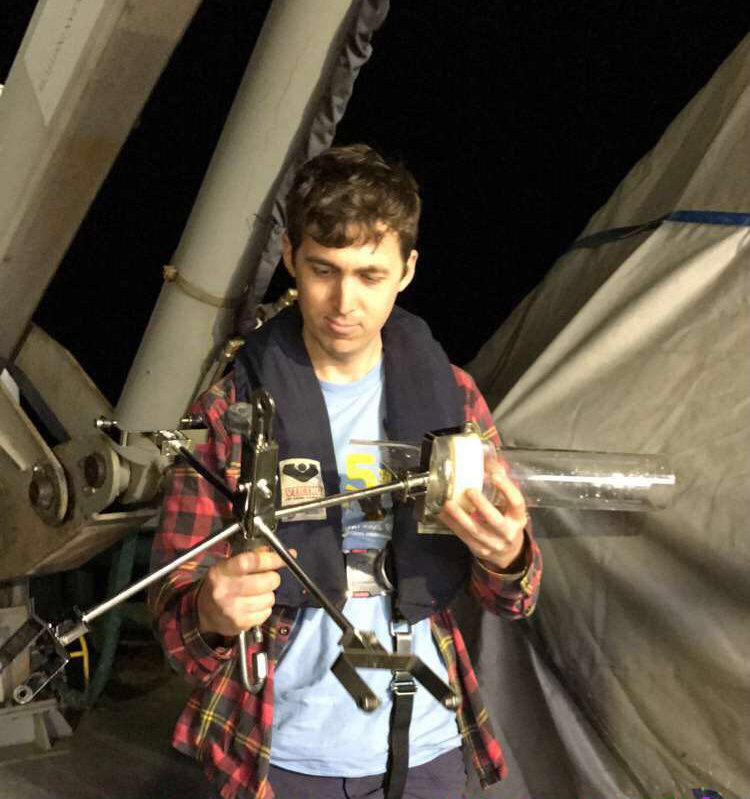
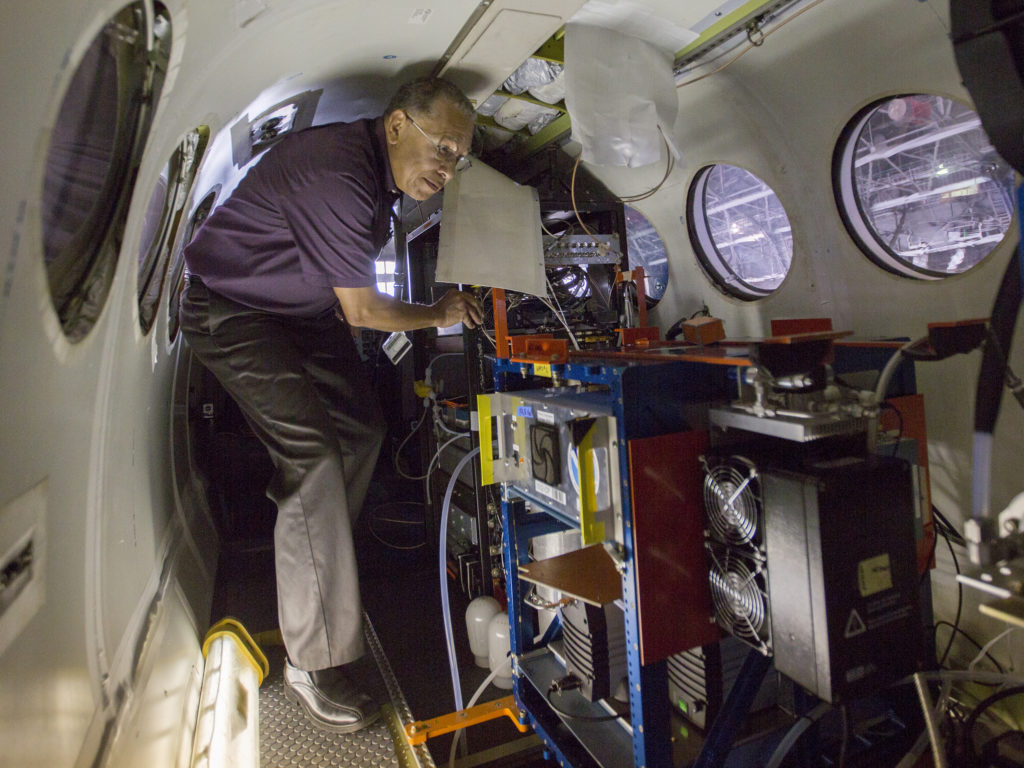
Scientists Alex Coccia (left) and Albert Wu during a SnowEx science flight over Colorado. Credit: NASA/Joy Ng

Why did this flight feel like a nauseating roller coaster ride? The Navy’s P-3 Orion aircraft was outfitted with a variety of instruments that required various flying maneuvers to collect data. The plane flew back and forth in a straight line and around in tight circles. It was literally a dizzying dance in the air.
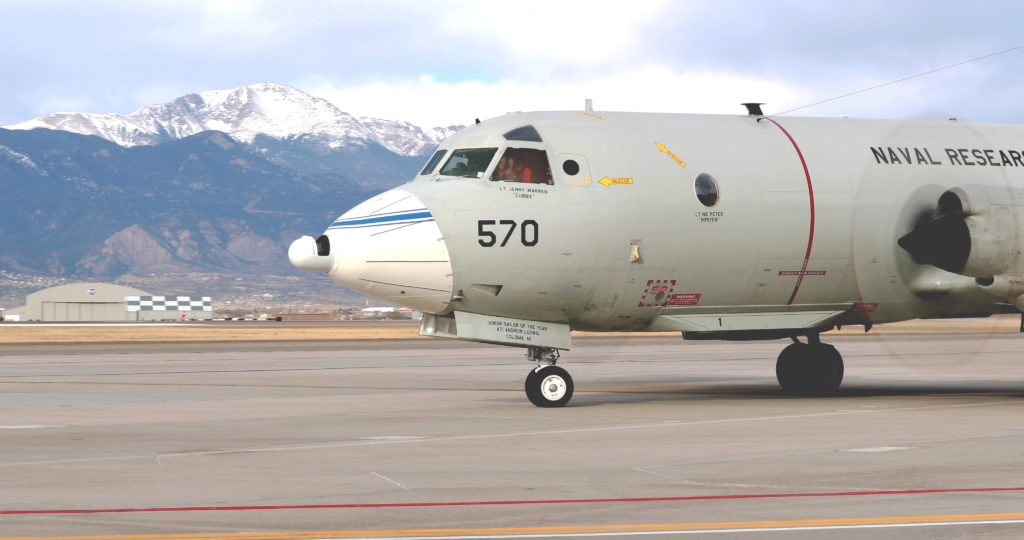
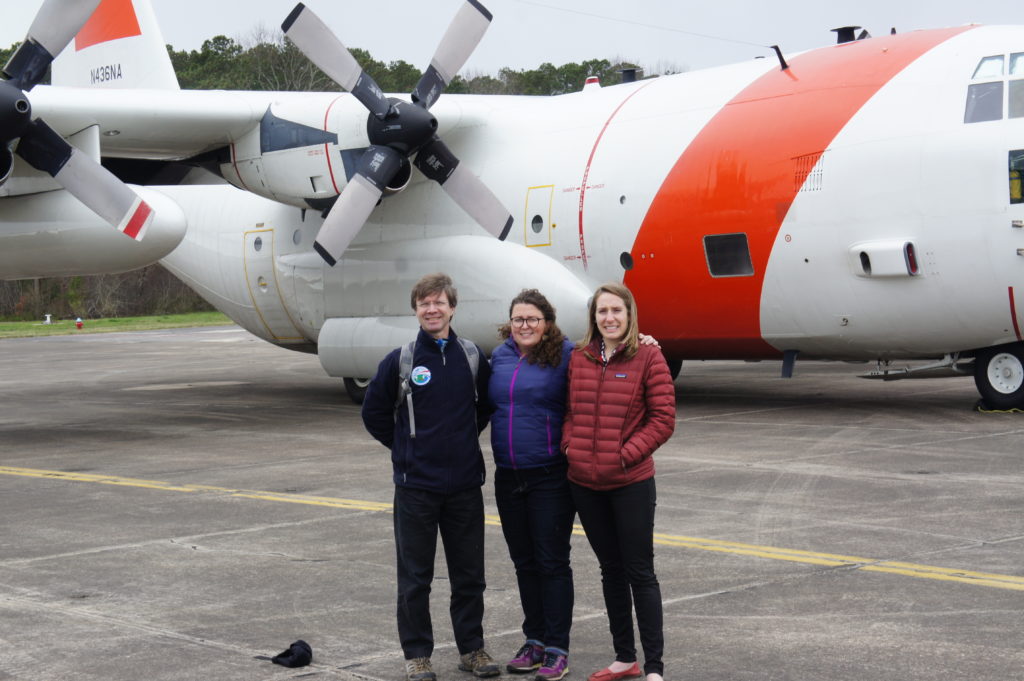
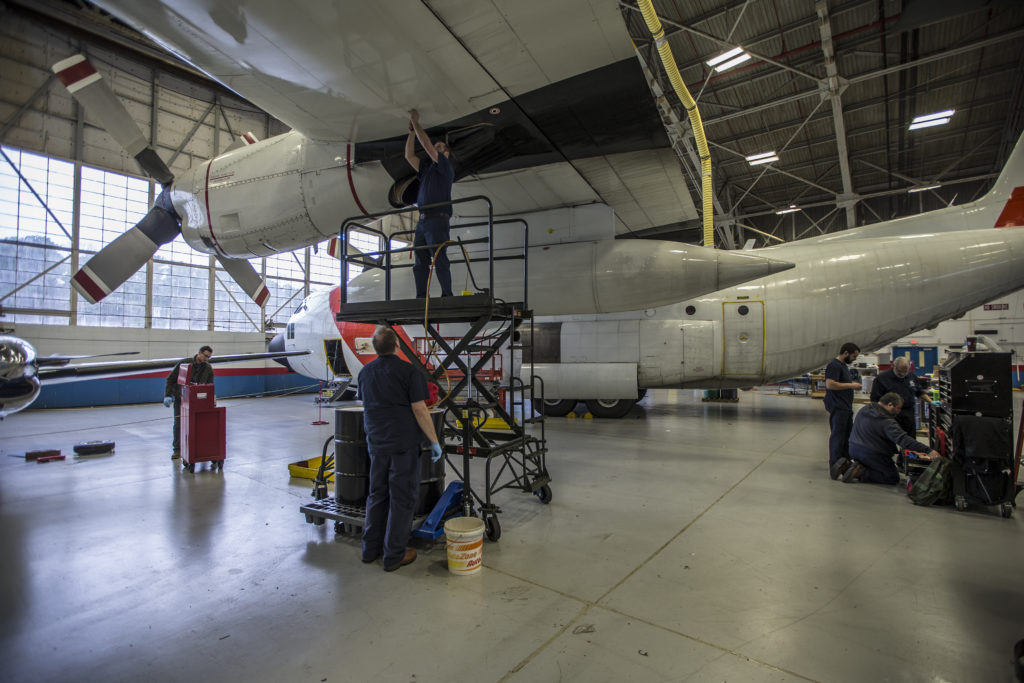
The P-3 Orion aircraft in the Peterson Air Force Base in Colorado Springs just before take-off. Credit: NASA/Joy Ng
The P-3 Orion aircraft at Peterson Air Force Base in Colorado Springs just before take-off. Credit: NASA/Joy Ng

This science flight was carried out as part of a new NASA-led campaign called SnowEx. At the moment, we have satellites that can see snow cover but no instruments in space that can accurately measure how much water they hold. Such a measurement is important, considering that roughly one-sixth of the world’s population relies on snow for their water resources. The campaign is exploring instruments and technologies for measuring snow that may eventually result in a snow-observing satellite.

One of the biggest land areas where snow falls is boreal forest, so SnowEx chose its first flights over the forests of Grand Mesa and Senator Beck Basin in western Colorado. Because leaves and branches can act like obstacles for some snow-measuring instruments, scientists are using these forests to investigate what combination of instruments can successfully measure snow over this kind of terrain.
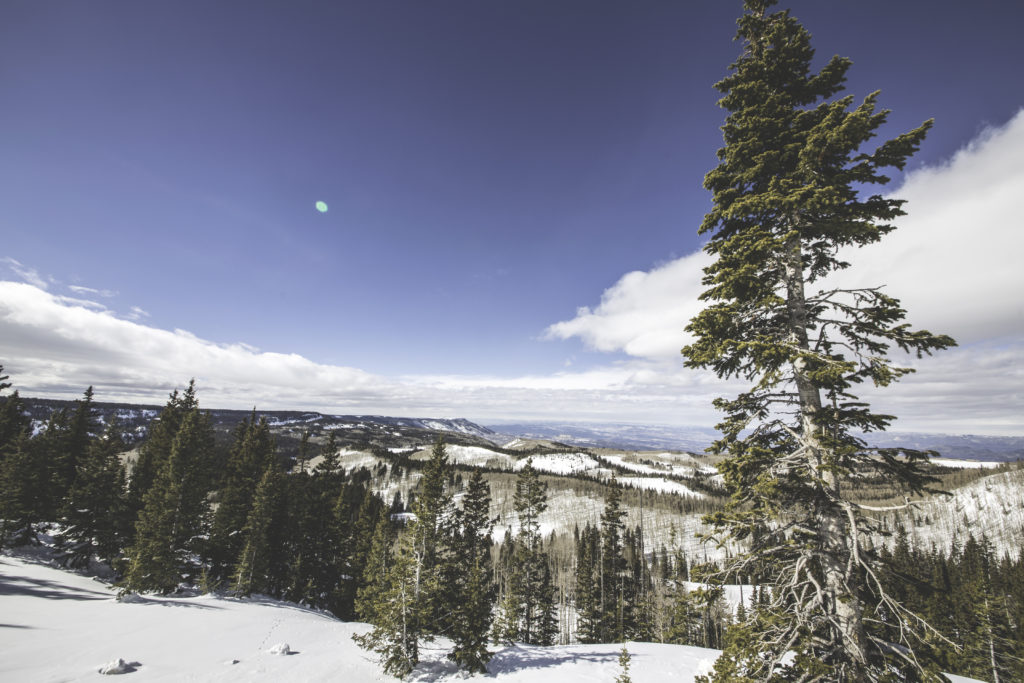
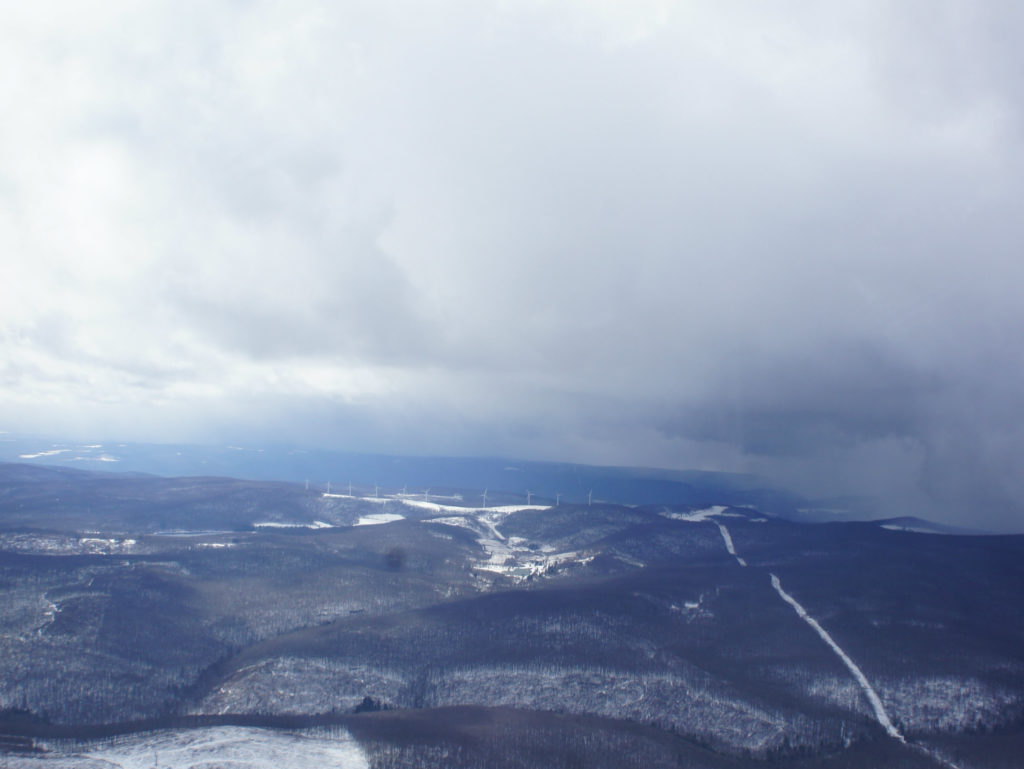
The Grand Mesa in Colorado is one of the sites for this year’s SnowEx campaign. Credit: Ryan Cook
Grand Mesa in Colorado is one of the sites for this year’s SnowEx campaign. Credit: Ryan Cook

At the same time, scientists are working on ‘ground-truthing’ the airborne measurements. This involves more than 100 scientists measuring snow depth and density on the ground to get accurate snow measurements that can validate the measurements taken by the airborne instruments.
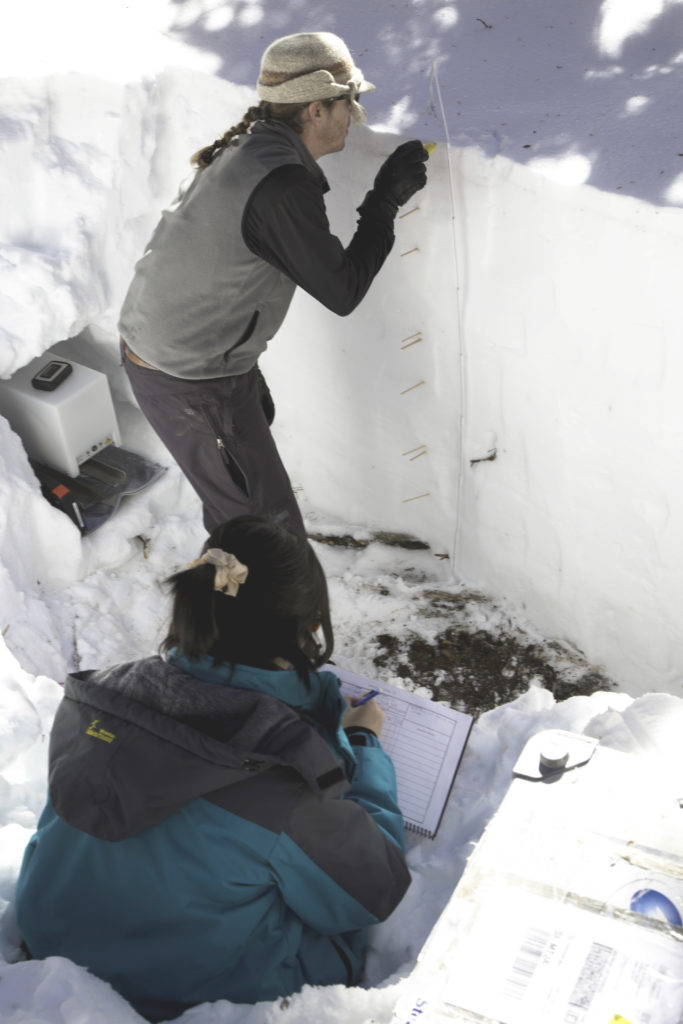
Travis Roth, Oregon State University looks at snow consistency at various depths as Jinmei Pan, Ohio State University logs data. Credit: Ryan Cook
Travis Roth, Oregon State University, looks at snow consistency at various depths as Jinmei Pan, Ohio State University, logs data. Credit: Ryan Cook

Collecting these in-flight measurements is tricky. Each instrument works at specific altitudes, over specific types of snow, and only in certain types of weather. This means that the aircrew and scientists have to work together to come up with a detailed flight plan—one that can change day to day—that allows all instruments to collect data successfully.
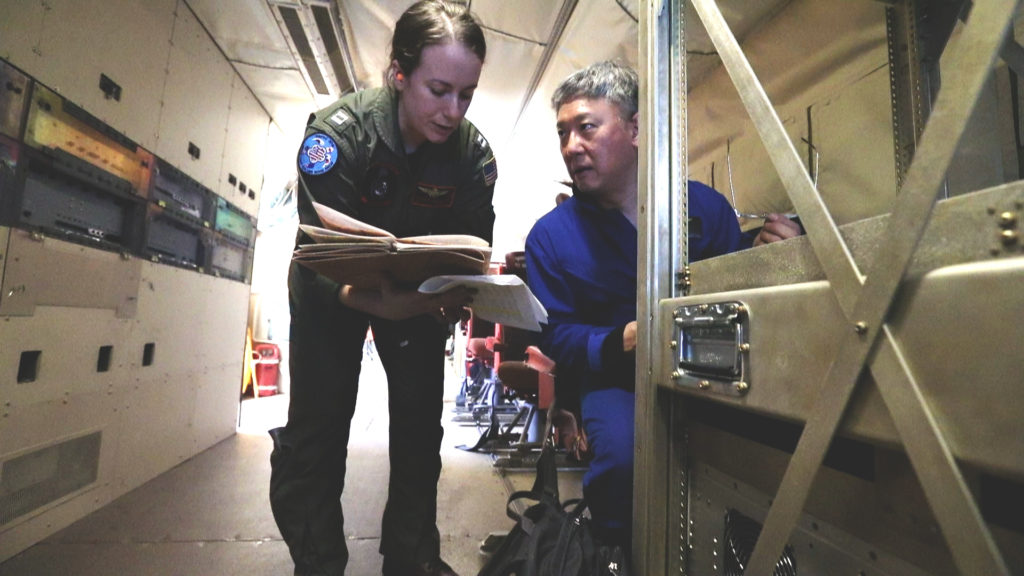
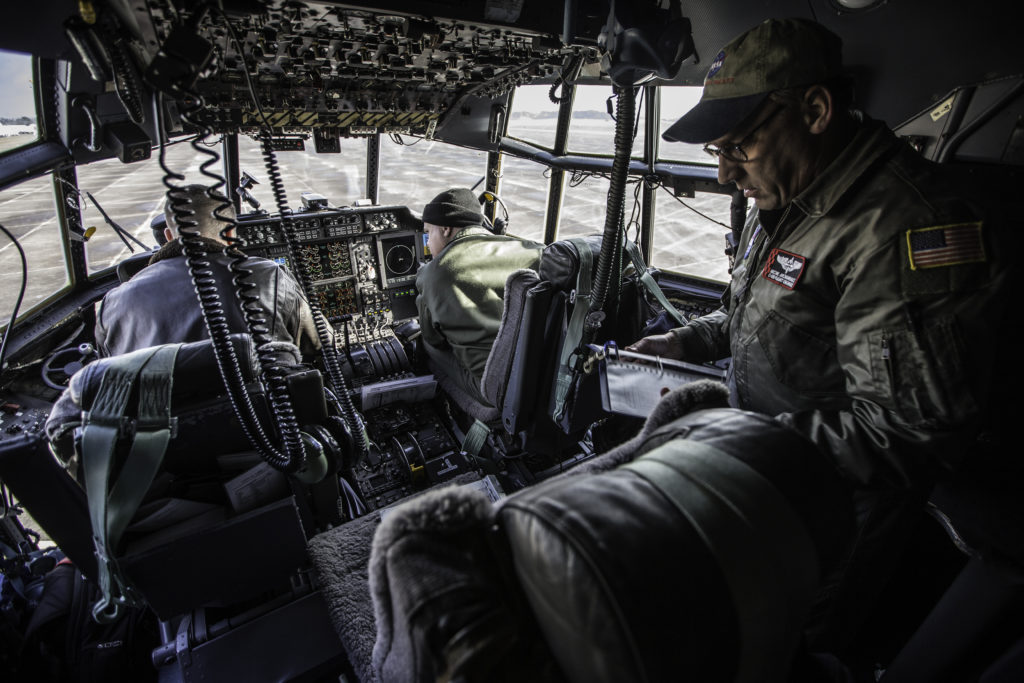
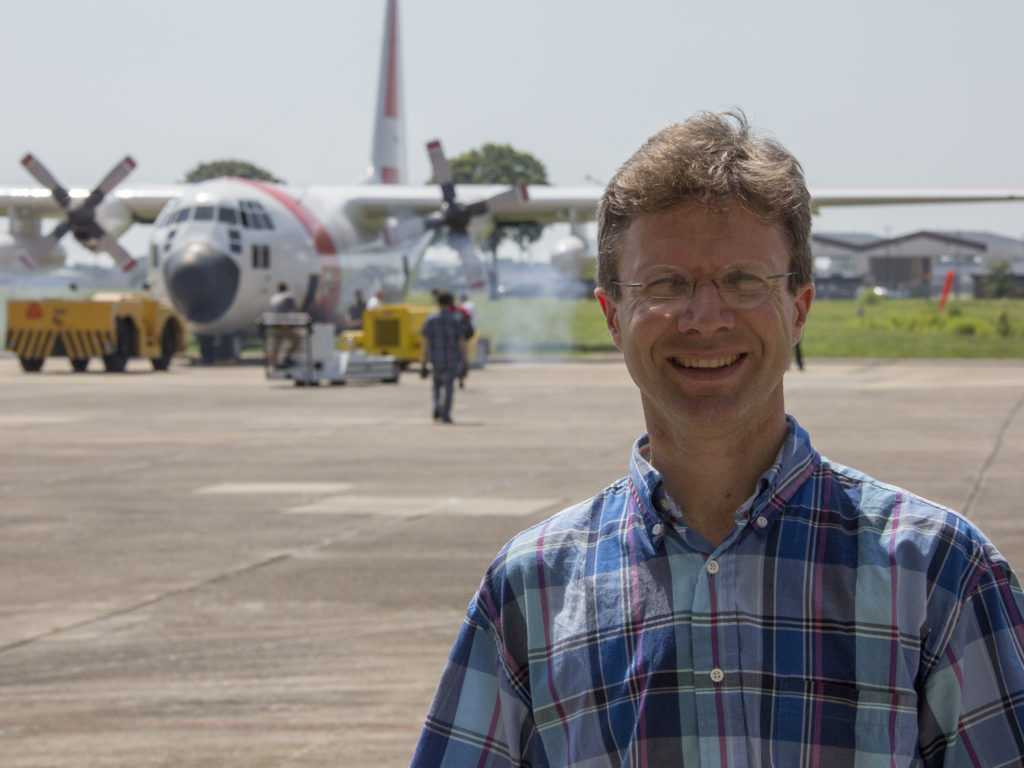
Lt. Denise Miller from the U.S. Navy speaks with Principle Investigator Edward Kim during a science flight. Credit: NASA/Joy Ng

While I was on the plane, most of the scientists were in seats next to their instruments. I, on the other hand, was swerving side to side as I did my own little dance to capture my shots. It’s not the ideal film set. The light is constantly changing. Every surface of the plane is vibrating and it’s very loud. In these conditions, I had one priority in mind: stabilization. Luckily, I used a handheld gimbal—an electronic device that counteracts any minor movements—that allowed me to film smooth shots while my feet were to the contrary.
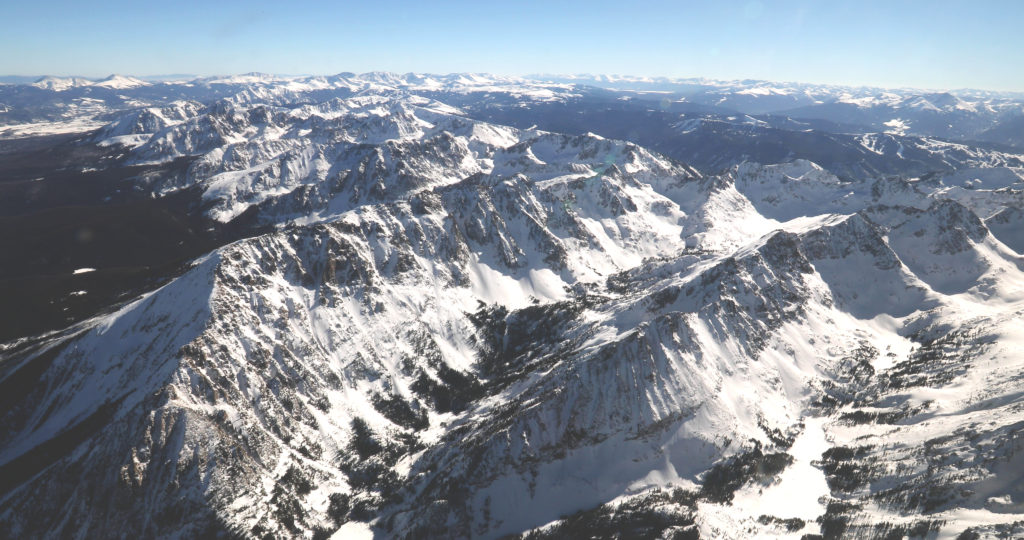
The view outside of the P-3 Orion aircraft during a science flight. Credit: NASA/Joy Ng

I managed to capture some great footage and discovered that, for me, the mountaintop views were a good remedy for any motion-induced mishaps.

Sights from the ACT-America Winter Field Campaign

by Joe Atkinson / HAMPTON, VIRGINIA /

Atmospheric Carbon and Transport-America, or ACT-America, wrapped up its winter field campaign Friday, March 10, with a final set of flights out of coastal Virginia.

The campaign, which is looking at how weather systems and other atmospheric phenomena affect the movement of carbon dioxide and methane in the atmosphere around the eastern half of the United States, began Feb. 1 with two weeks of flights out of Shreveport, Louisiana. The base of operations moved twice: to Lincoln, Nebraska, then to Virginia.

ACT-America employs two aircraft outfitted with several science instruments—a C-130 based at NASA’s Wallops Flight Facility on Virginia’s Eastern Shore and a B-200 based at NASA’s Langley Research Center in Hampton, Virginia.

Principal Investigator Ken Davis of Penn State took lots of photos during the six-week field excursion. Here are a few of the sights he and a couple of the other team members captured. All photos courtesy of Davis except where noted.

Fire in the Southeast

Credit: Ken Davis
Credit: Penn State/Ken Davis

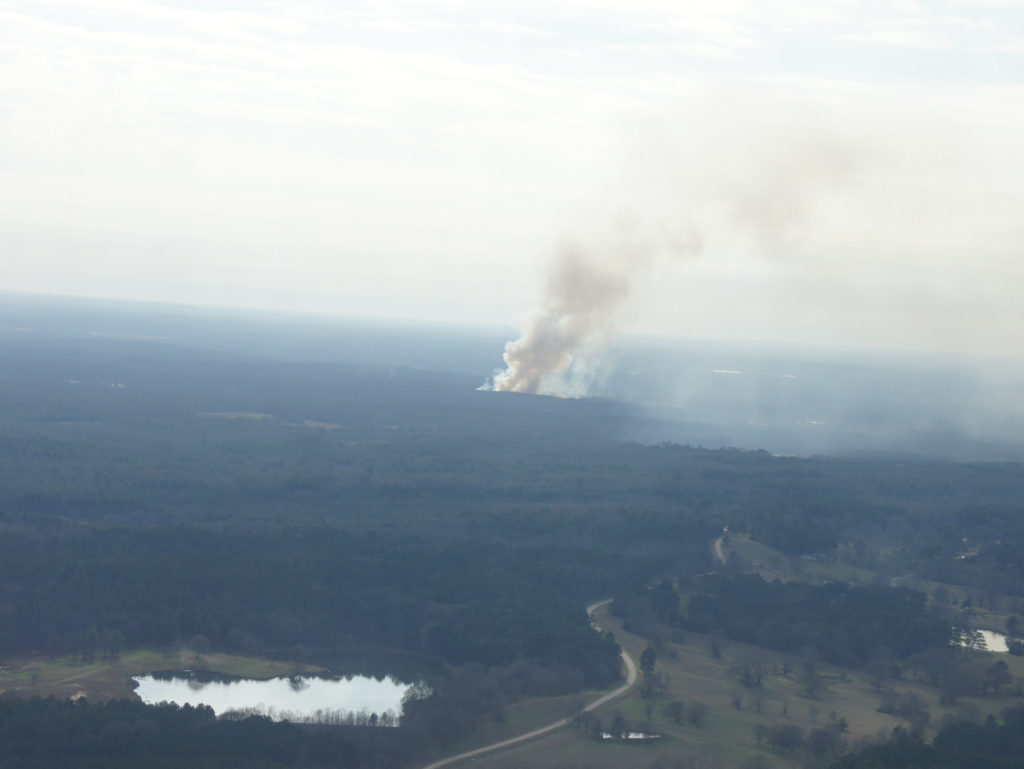
During a flight out of Shreveport, Davis took this picture of smoke rising from a fire somewhere in Alabama or Mississippi. According to Davis, there were a few fires in Gulf Coast forests in early February. Some of the most noteworthy ones were in Arkansas. “We did encounter elevated CO2 over Arkansas,” he said, “probably caused in part by the biomass burning we passed over.” 
Gulf Coast Flow

SONY DSC
Credit: Penn State/Ken Davis

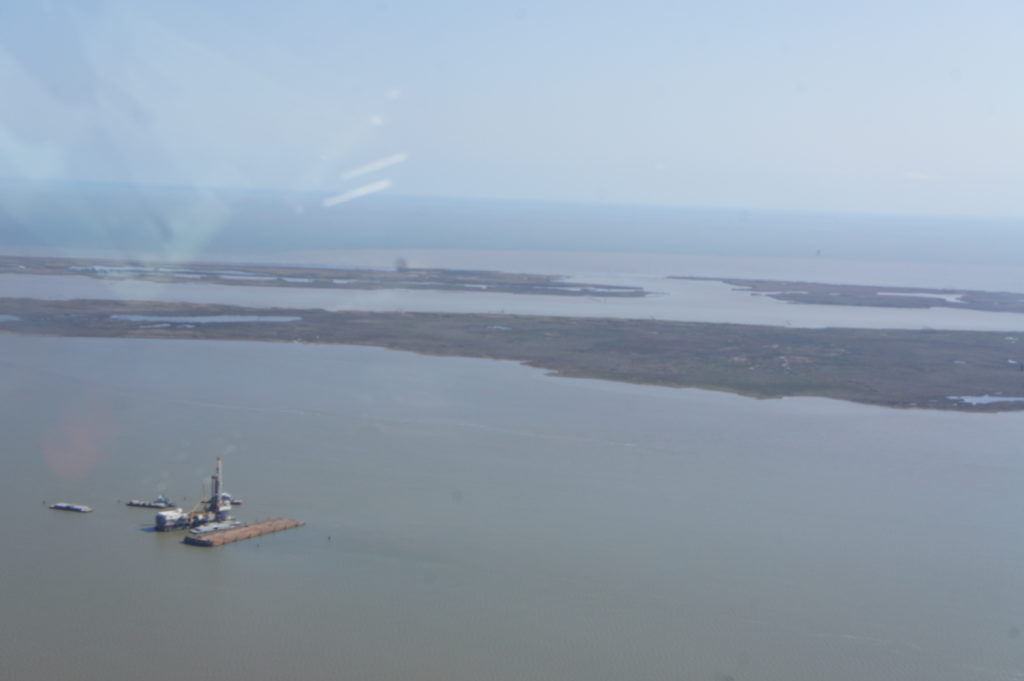
Along the Gulf Coast, Davis took this photo of what he believed to be an offshore oil facility. Facilities like this one could be sources of methane, but ACT-America wasn’t specifically attempting to detect emissions from offshore oil. Of greater interest was air flowing from the Gulf of Mexico onto the continent. “There is often onshore flow from the Gulf across the midwestern and southeastern U.S.,” he said. “That was what we wanted to measure this day.” 

Squares of White

Credit:
Credit: Bing Lin

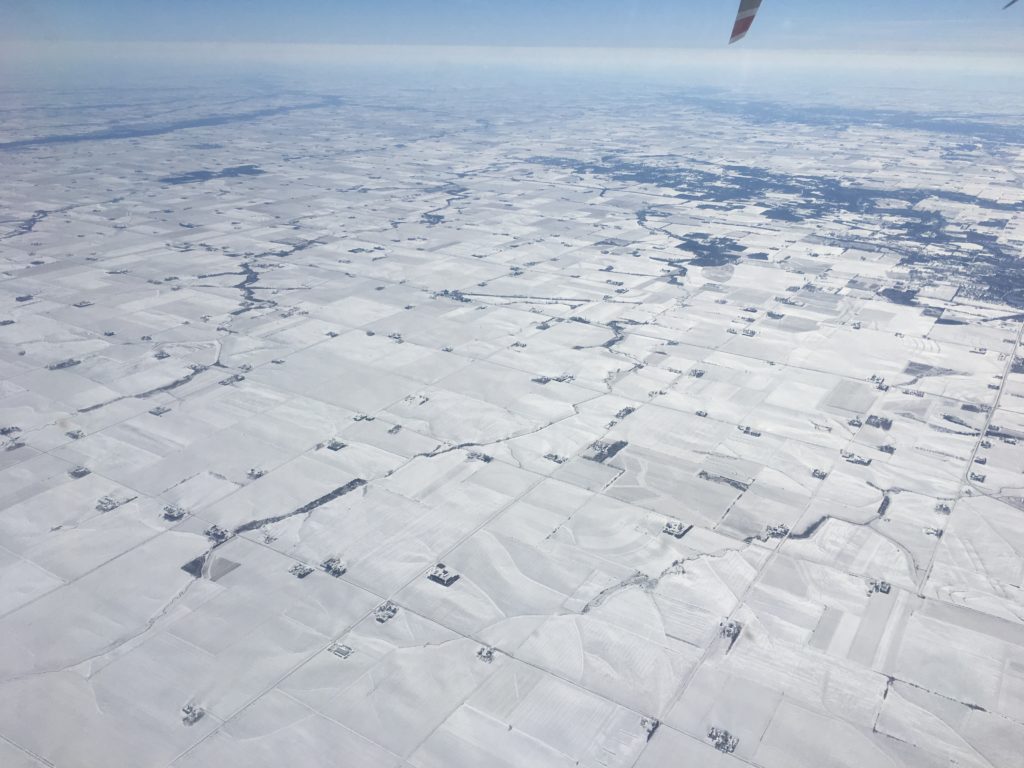
The campaign moved to Lincoln, Nebraska, in mid-February. During that midwest leg, a storm system brought a blanket of snow to the region, making for serene scenes like this one, photographed by Project Scientist Bing Lin.

Satellite Flight

Credit: Penn State/Ken Davis

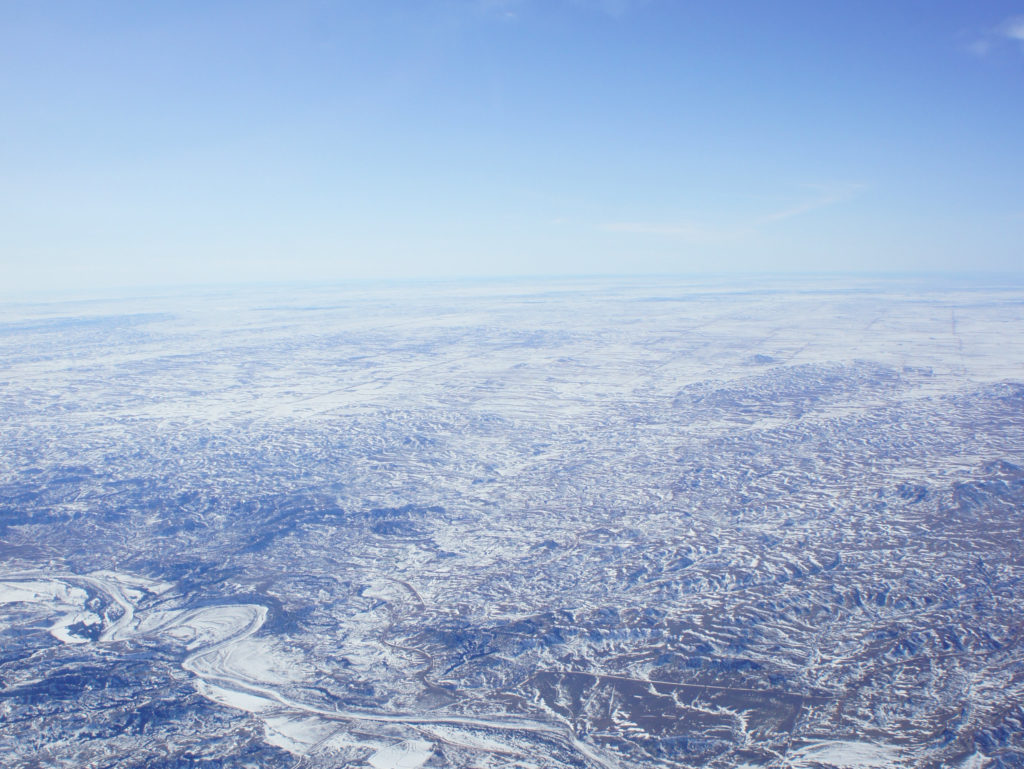
Davis took this photo over the midwest during a flight to validate remote sensing data from the Orbiting Carbon Observatory-2 (OCO-2) satellite. OCO-2 uses near infrared reflection to make its measurements of carbon dioxide. Snow is dark in the near infrared, though, meaning it’s not reflective, so satellite validation flights like this one can help researchers see how well OCO-2 is working as it collects measurements while orbiting over snow-covered land.

Down and Outlaws?

Credit: Cate Easmunt

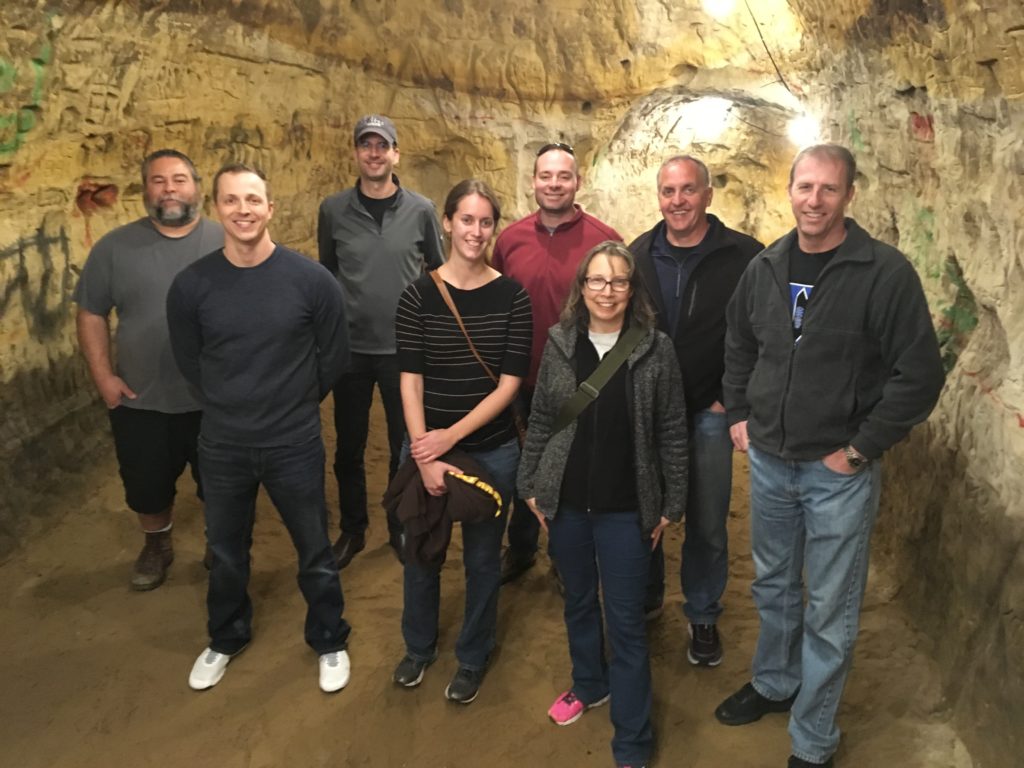
During a down day in Lincoln, a few folks from the team toured a brewery that sits above a 5,000-square-foot cave. Pictured, from left to right, are Bill Ziegelbauer, Nathan Blume, Dirk Richter, Rebecca Pauly, Matthew Elder, Cate Easmunt, Mike Wusk and Greg Slover. According to a local legend, outlaw Jesse James may have used the cave as a hideout after a heist in Minnesota. No outlaws on the ACT-America team, though. They all left the cave after the tour was over. We think. Photo courtesy of Cate Easmunt.

Reunited and … You Know the Rest

Credit: Penn State/Ken Davis

During the Mid-Atlantic leg of the campaign, Davis posed for this photo at Wallops with Hannah Halliday of NASA Langley and Bianca Baier of the National Oceanic and Atmospheric Administration. Halliday and Baier, who had both been taught by Davis at Penn State, operated instruments on the flights. “I didn’t know we’d all be in the field together,” said Davis, “and I was smart enough to get a couple of photos.”

Coal Country

Credit: Penn State/Ken Davis

Flights over the Appalachian Mountains in southwest Pennsylvania and eastern West Virginia allowed ACT-America researchers to measure carbon emissions upwind and downwind of coal and gas extraction activities in the region.

Keeping Warm

Credit: Penn State/Ken Davis

ACT-America Project Manager Mike Obland of NASA Langley wears long sleeves to keep warm on one of the flights over the Mid-Atlantic. Even on relatively warm days, temperatures on the C-130 can get chilly, particularly at higher altitudes.

That’s a Wrap

Credit: Cate Easmunt

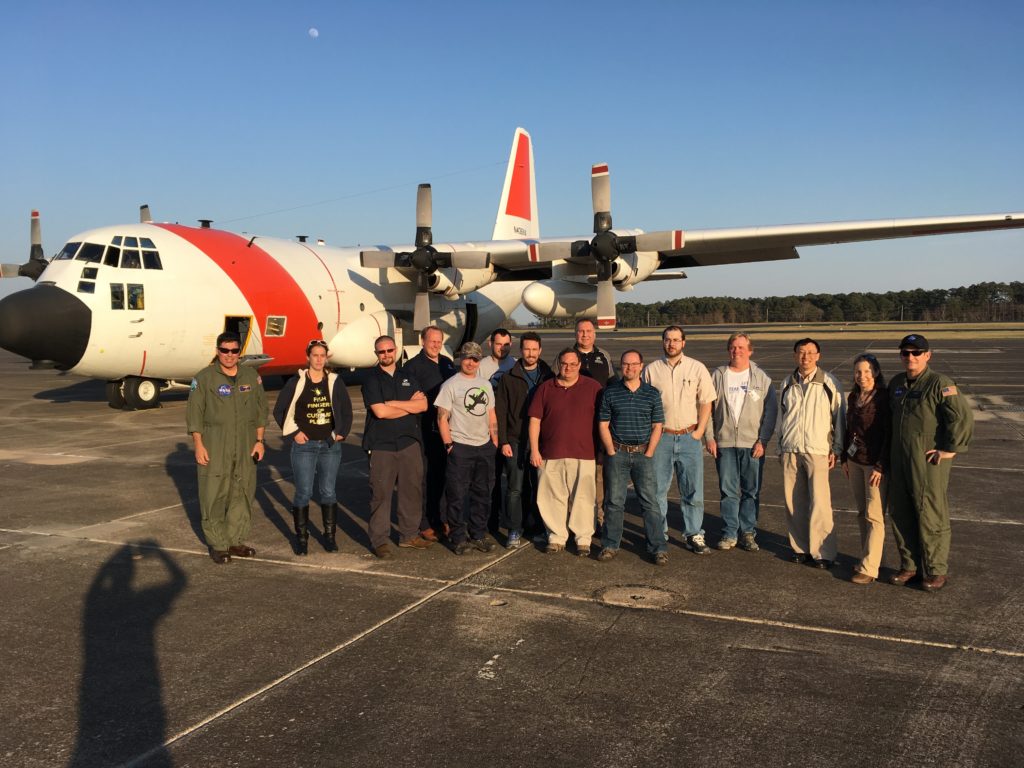
As the winter field campaign came to a close in Virginia, team members posed for this group photo by the C-130. Photo courtesy of Cate Easmunt.

ACT-America will return for a second 2017 field campaign in the fall.

Working Around the Weather

Steve Dollar (UH) heads to a benthic validation site on Maui. Credit: Stacy Peltier, BIOS
Steve Dollar (UH) heads to a benthic validation site on Maui. Credit: BIOS/Stacy Peltier

by Ali Hochberg / HONOLULU, HAWAII /

Understanding our planet and how it functions, as well as the impacts that human activities have on it, requires frequent and extended forays into the field to yield valuable data and observations. The COral Reef Airborne Laboratory (CORAL) investigation is a prime example. The three-year mission, funded by the NASA Earth Venture Suborbital-2 program, is conducting airborne remote sensing campaigns, along with in-water field validation activities, across four coral reef regions in the western and central Pacific Ocean.

“The objective is to conduct coral reef science at the ecosystem scale to find out the relationship between reef condition and the biogeophysical factors we think impact reefs,” said Eric Hochberg, CORAL principal investigator from the Bermuda Institute of Ocean Sciences, St. George’s, Bermuda. “With that understanding, we can build models to help scientists, resource managers and politicians gain a new perspective on reef function and better predict how natural and human processes will shape the future of reefs.”

When CORAL traveled to Hawai‘i last month for its second field campaign, it already had nearly a year of the mission under its belt. The Operational Readiness Test (ORT) took place in Hawai‘i last summer and the team completed a successful first field campaign in Australia’s Great Barrier Reef last fall. During both, communications between the airborne and field teams were streamlined, field operations and equipment deployments were tested and refined, and team members gained valuable experience working with both equipment and each other.

Eric Hochberg (BIOS), Bob Carpenter (CSUN) and Yvonne Sawall (BIOS) hold a team meeting before heading out to the field. Credit: NASA/James Round

Even with years of planning and preparation, however, such ventures are always undertaken with the knowledge that some variables are out of the researchers’ control. For the CORAL team, there was one thing they couldn’t prepare for in Hawai‘i: the weather.

While the in-water field teams can—and do—work in what are often considered adverse conditions, the weather can still take a toll on the instruments left in the water to collect data.

“Our metabolism work on the fore reef of Kāneʻohe Bay was going well until a large north swell wrapped around to the windward side and toppled one of our gradient flux instrument stands,” said Robert Carpenter, CORAL co-investigator from California State University Northridge and leader of the reef metabolism team. “Luckily, it happened during the night before we were going to pick the instruments up, so we did not lose any data and the instruments were not damaged. Because of the swell, we continued the remainder of our data collection in the back reef and lagoon. So much for a calm time of the year!”

Brandon Russell (UCONN) checks instrumentation before a field deployment. Credit: BIOS/Stacy Peltier

Unlike the in-water teams, the airborne operations for CORAL require substantially fairer conditions. The PRISM (Portable Remote Imaging Spectrometer) instrument that forms the backbone of the CORAL science is housed in the belly of a Gulfstream-IV airplane that flies over survey areas at an altitude of 28,000 feet. In order to obtain the most accurate spectral data possible from the seafloor, the airplane must fly in relatively cloudless skies with low surface winds over clear waters.

“One of the biggest operational challenges that the CORAL Hawai‘i campaign faces is the weather,” said CORAL project engineer Ernesto Diaz from NASA’s Jet Propulsion Laboratory, Pasadena, California. “For optimal data, a clear line of sight between the sun and the coral reefs is necessary, making clouds CORAL’s biggest enemy. Hawai‘i’s tropical location, the drastic topography differences within each island, and the trade winds, are some of the factors that make forecasting clear weather days particularly tricky. A clear day over an entire island is uncommon so we usually plan for collections over portions of the islands that have the best clear sky forecast, i.e. windward, or leeward sides. All of these factors make a successful data collection flight very rewarding.”

CORAL scientists also had to contend with a significant rain event over the region in late February as a slow-moving storm system dumped rain on the islands for two straight days and caused urban flooding in many areas. These floodwaters, originating on land and emptying into the surrounding ocean, led to a significant amount of soil runoff in areas. The additional sediment in the waters reduced water clarity and, as a result, impacted the ability of the PRISM instrument to “see through” the water to the seafloor.

A view from the water of the lush vegetation on Maui. Credit: BIOS/Stacy Peltier

Despite these challenges, the CORAL team was able to complete in-water validation activities in Kāneʻohe Bay and collect flight lines over the Big Island (the island of Hawai‘i), Maui, O‘ahu, Kaua‘i, Ni‘ihau, Moloka‘i, Lana‘i, and Kaho‘olawe. The benthic team also visited Maui and the Big Island to gather data for various benthic communities not represented in Kāneʻohe Bay.

“It was nerve-racking checking the weather forecasts each day and following the progress of the airplane, hoping for clear skies and calm waters over the different islands where we needed PRISM data,” said Hochberg. “We got some good breaks, though, and the Hawai‘i campaign was successful. Next month we get to start it all over again in Guam and Palau. I’m looking forward to it!”

Bowing Before the Wind

View of the cockpit of the DC-8 in flight. Credit: NASA/Michael Prather
View of the DC-8 cockpit in flight. Credit: NASA/Michael Prather

by Ellen Gray / CHRISTCHURCH, NEW ZEALAND /

The Atmospheric Tomography, or ATom, mission’s world survey of the atmosphere can’t fly the order of its locations in reverse.

Its flight plan begins with traveling from California to Alaska and the North Pole before flying south down the center of the Pacific Ocean by way of Hawaii to New Zealand. From New Zealand, they cross east to Chile before ascending north up the Atlantic to Greenland.

It’s this southernmost crossing from Christchurch, New Zealand, to Punta Arenas, Chile, that’s a one-way street.

“The plane can’t make it from Punta Arenas to New Zealand because the winds are too strong,” said Róisín Commane, an atmospheric scientist at Harvard University who is part of the ATom mission.

The winds that travel from west to east above the Southern Ocean around Antarctica are among the strongest in the world. With few land masses to slow them down, they blow unimpeded.

Leg #6 for ATom is from Christchurch, New Zealand to Punta Arenas, Chile, flying the gusty Southern Ocean that encircles Antarctica. Credit: NASA

Those strong winds led to complications for the ATom team as they were preparing for their Feb. 10 flight from Christchurch to Punta Arenas. In a small hotel conference room around a cell phone and computers sharing a screen from weather forecasters back at NASA’s Goddard Space Flight Center, Steve Wofsy, ATom’s project scientist, peered at a circular weather system at the end of their flight path. The system created an eddy in the prevailing west-east wind that coincided with their arrival in Punta Arenas. The concern around the table was that strong winds would be blowing perpendicular to the runway when the plane was trying to land, potentially pushing it sideways.

The DC-8 can handle this kind of crosswind up to about 25 knots, or 28 miles per hour. Above that, for safety the pilots would have to divert to a back-up landing site. The closest in Chile was in the range of the same weather system—and likely to have the same crosswinds. The other was in Argentina two hours away, which would require fuel reserves that would take away from the number of profiles of the atmosphere they could do on the crossing, one of the main reasons for this mission. It would also require a second flight to get the team back to Punta Arenas the day after the system passed.

Project Scientist Steve Wofsy getting ready to board NASA's DC-8 at 5:30am. Credit: NASA
Project Scientist Steve Wofsy getting ready to board NASA’s DC-8 at 5:30am. Credit: NASA

It was a disruption that Wofsy didn’t want to take on after an already difficult 10-hour flight with an 8-hour time change. From their experience on ATom’s first deployment in 2016, they knew from experience that the jet lag on this leg of the trip was brutal.

After three mornings watching the updated forecasts and NASA ground personnel talking with local weather forecasters in Punta Arenas, the morning of their scheduled departure from New Zealand arrived. The forecast hadn’t changed much. There was a 20-25 percent chance that the winds would be too strong and the plane would have to divert, said Wofsy. After a last early morning meeting with the pilots and forecasters, they made the decision to scrub the flight and wait a day for the storm to pass.

By the next day the system had indeed moved on, and the runway in Chile was safe for landing. The ATom team departed after their extra day in Christchurch and with. an adjusted schedule that would give them one less day in Punta Arenas. But on a mission dependent on good weather, that’s the way the wind blows.


Grit Factor and Teamwork

Noah Walcutt, University of Rhode Island, inspects mangled sediment traps recovered from the first sampling site. Shark damage was later confirmed. Credit: University of Rhode Island/Melissa Omand

by Stephanie Schollaert Uz, North Pacific Ocean

Shark attack. Rough weather. Intermittent technology. These are just a few of the challenges of shipboard research on the R/V Falkor. Yet the science continues with unbelievable tenacity on the 28-day Sea to Space Particle Investigation.

When Melissa Omand’s sediment traps, deployed to measure sinking particles, were returned from the sea bent and broken at the end of the first 4-day sampling site, she was briefly discouraged. She wondered whether her experiment to collect data with an iPhone was jeopardizing established collection methods. The iPhone housing is big and heavy and could have swung into the other three sediment-collecting tubes and smashed them.

Then one of the line handlers showed me a shard that got stuck in his finger—later revealed under the microscope of the resident taxonomist as part of a shark’s tooth and confirmed by shark experts ashore. Shark bite marks were also noticed on the more rugged, indefatigable wire walker. Several ship’s crew volunteered their time and talent to rebuild the sediment traps stronger and better. After that, the refurbished sediment traps survived deployment and collected stunning data at the next station.

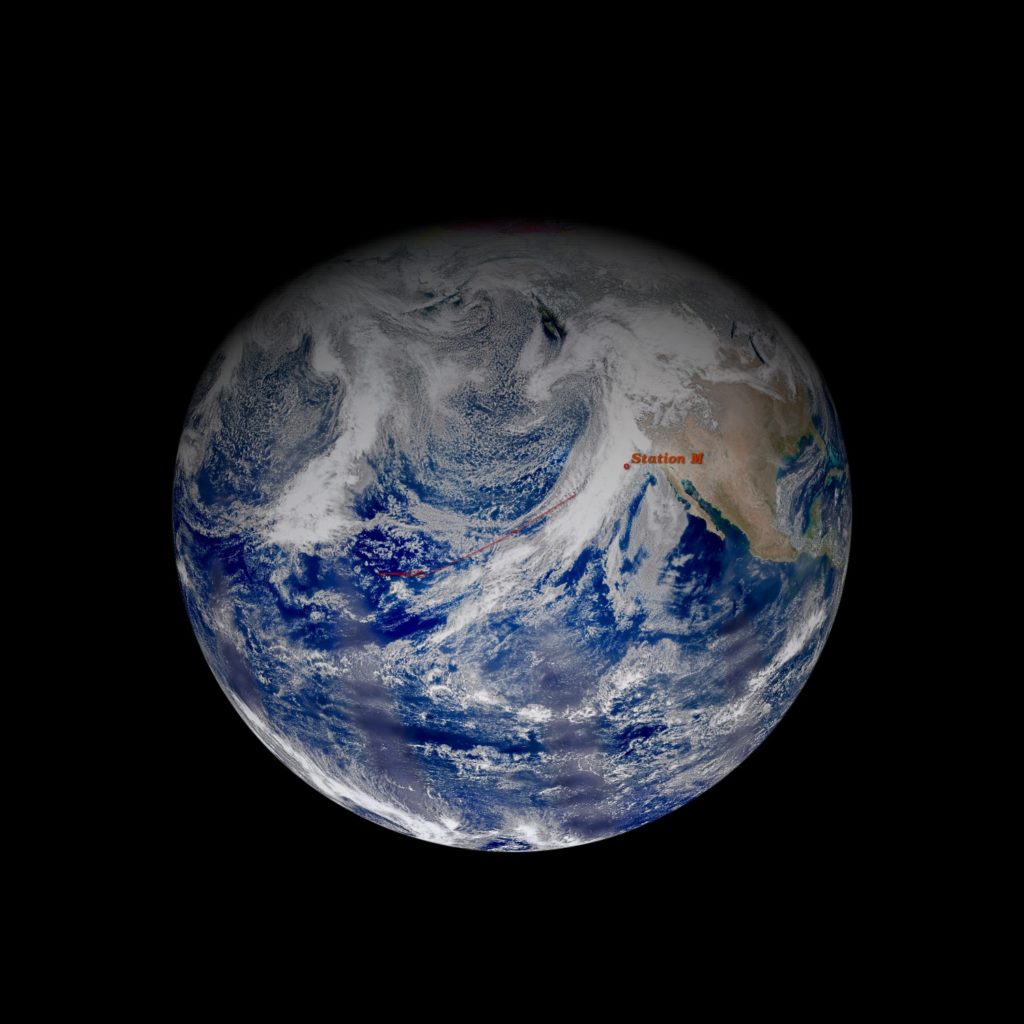
Hemispheric view by Suomi-NPP VIIRS on Feb 9, 2017 in true color. Clouds and atmospheric particles are white; ocean is blue. The ship’s track is shown in the red line. Station M is our last sampling site. Credit: NASA/Norman Kuring

As those on the U.S. West Coast are well aware, the past month has seen a constant procession of low pressure weather systems across the Pacific. One of the main goals of this cruise is to collect data that can later be used to tune ocean color satellite measurements. Rough weather at sea is more than an inconvenience: it makes it unsafe to use the light sensor we put in the water to compare to satellite measurements. Persistent clouds obscure satellite coverage of our area—making match-ups between in-water measurements and satellite data impossible anyway.

To avoid the bad weather and high seas we would have encountered on our original planned cruise track nearly straight north, the ship’s captain worked closely with the chief scientist to revise our plans and head east.

As we started work at our second site, however, we lost all internet. The ship’s IT coordinator found a broken satellite antenna that caused the internet not to work during certain ship headings. Again, the captain worked closely with the science party to modify the course track for on-site sampling that would also permit internet connectivity.

In spite of everyone’s best attempts to maximize our bandwidth, we still experienced repeated drop-outs during the NASA Earth Facebook live event we conducted from the ship on Feb 6. It felt like the movie Groundhog Day, with repeated re-introductions as we reconnected to the event again and again. Thankfully, we had help from NASA JPL colleagues ashore and an engaged audience who remained online and sent excellent questions and follow-up questions afterward.

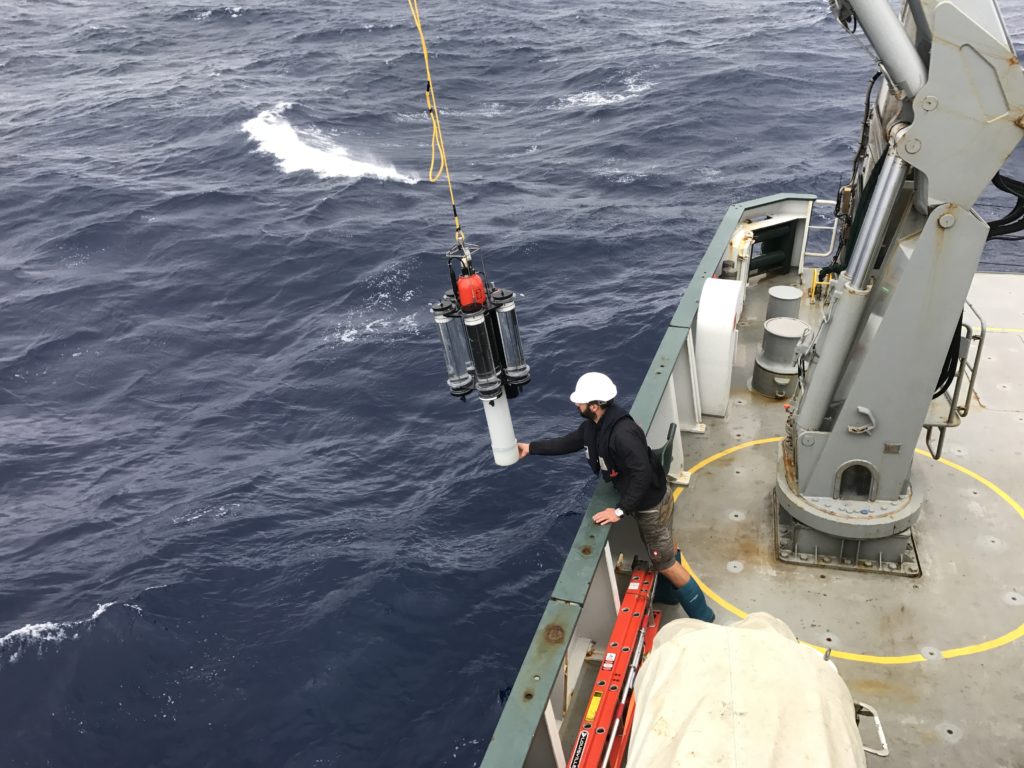
Another challenge was finding and recovering the sediment traps from the second sampling site as it was issuing a weak and intermittent GPS signal between large waves. All hands on deck kept look-out during the wind and rain until its little orange top was spotted. The crew skillfully maneuvered the ship along-side and caught the instrument’s yellow handling line to lift it back aboard with a crane.

IMG_0673
In heavy seas, Philipp Günther, Falkor’s chief officer, retrieves sediment traps that were deployed around 150 meters deep to collect sinking ocean particles. Credit: NASA/Stephanie Schollaert Uz

Over and over again during this expedition, we experience challenges that are solved through teamwork between the science party and ship’s crew. The novel data being collected here would not be possible without this persistence and collaboration.

Participating in this field campaign to improve the quality of ocean color satellite measurements are five of us from NASA Goddard’s Ocean Color group, plus NASA- and NSF-funded scientists from other organizations. In addition to improving current satellite measurements, data collected here will assist in the development of algorithms for NASA’s first hyper spectral satellite, Plankton, Aerosol, Cloud, ocean Ecosystem (PACE), scheduled to launch in 2022.

R/V Falkor ship-time is generously provided by the Schmidt Ocean Institute, a philanthropic organization led by Google CEO Eric Schmidt and his wife, Wendy Schmidt. For #Sea2Space cruise track and updates: https://schmidtocean.org/cruise/sea-space-particle-investigation/

Super Bowl Sunday in the Atmosphere’s Mixing Bowl

Mission manager Tim Moes and Operations Engineer Matt Berry support the Falcons aboard NASA's DC-8 flying laboratory on the ATom flight leg from Fiji to New Zealand, Feb. 6, 2017. Credit: NASA/Ellen Gray
Mission manager Tim Moes and Operations Engineer Matt Berry support the Falcons aboard NASA’s DC-8 flying laboratory on the ATom flight leg from Fiji to New Zealand on Feb. 6, 2017. Credit: NASA

by Ellen Gray / CHRISTCHURCH, NEW ZEALAND /

Good communication is key to keeping the 44 scientists and aircrew happy on NASA’s DC-8 aircraft. The team is in close quarters for a month-long journey around the world to survey the atmosphere on NASA’s Atmospheric Tomography, or ATom, mission. On the plane they keep in touch with each other via headset and with scientists supporting the mission back home via satellite chat room.

But on Feb. 6, on the other side of the International Date Line (Feb. 5 in the United States), as the team made their transit from Nadi, Fiji, to Christchurch, New Zealand, one topic was forbidden—updates on the Super Bowl.

Róisín Commane, an atmospheric scientist and Patriots fan at Harvard University in Cambridge, Massachusetts, did a rough poll. Half the people on the plane followed football, and they were nearly evenly split between Patriots and Falcons fans. And all of them wanted to see the game unspoiled.

On the ground in Christchurch, Quincy Allison, the logistics coordinator with NASA’s Earth Science Project Office out of Ames Research Center, had already arranged with hotel staff to record the game and play it in a conference room after the ATom team got in that evening.

Meanwhile, during their Super Bowl news blackout, the team continued to make measurements to better understand our atmosphere. The ATom mission is the most comprehensive survey of the atmosphere to date, with 22 science instruments measuring more than 200 gases and air particles and an itinerary that has it tracing from the North Pole down the Pacific Ocean to Christchurch, then cutting across to the southern tip of Chile, then traveling back up the center of the Atlantic to Greenland and the Arctic. Along the way they’re island hopping between flights, with only a day or two on the ground before moving on. Christchurch, at about halfway, is their longest stopover at three days and also their major resupply point.

Gathering data to help understand the atmospheric chemistry that drives air quality around the globe is worth the grueling pace for Commane, who likened the atmosphere to a different kind of bowl.

Atmospheric chemist Róisín Commane on the stairs of DC-8. Air intake valves stubble the outside of the plane to draw air into the instruments while in flight. Nadi, Fiji, Feb 6 2017. Credit: NASA
Atmospheric chemist Róisín Commane on the stairs of NASA’s DC-8. Air intake valves stubble the outside of the plane to draw air into the instruments while in flight. Nadi, Fiji, Feb 6 2017. Credit: NASA

“It’s like a mixing bowl,” she said. The air over the oceans is theoretically clean, but winds, especially in the Northern Hemisphere, carry pollution from industry or fires from continent to continent. Looking at some of their data in the middle of the Pacific Ocean, she said they saw signs of fires. “I said, ‘Where did this come from?’” she recalled. The weather and wind models said Africa, where agricultural fires are common in the summer and fall. “That’s on the opposite side of the world.”

Clouds above the Pacific Ocean on the way from Fiji to New Zealand. Feb 6, 2017. Credit: NASA
Clouds above the Pacific Ocean on the way from Fiji to New Zealand on Feb 6, 2017. Credit: NASA

Air doesn’t stay in one place, and as it travels, the hundreds of different gases and particles that make up the air encounter new ones generated in different areas, and they chemically react with each other. Some of the pollutants are scrubbed out of the atmosphere this way, disappearing or transformed into new gases. These are the processes that the ATom science team is interested in learning more about, in addition to just knowing how much pollution is really out there over the ocean.

A lack of measurements gives people a false sense that everything is okay, said Commane. “We think we don’t need to do better,” she said. Poor air quality is something she doesn’t want anyone to live with, whether it’s generated at home or is a wind-driven import. “You might not always be able to see it, but when you’re in it you can feel it. You can taste it.”


From One Seasonal Extreme to Another

The crew of the C-130, including flight engineer Archie Archambault, foreground, prepare to depart Wallops for Shreveport, Louisiana — the first stop for ACT-America’s winter field campaign. Credit: NASA/Patrick Black

by Joe Atkinson / HAMPTON, VIRGINIA /

Last year, the first in a series of five flight campaigns for Atmospheric Carbon and Transport-America, or ACT-America, sent researchers into the field at the blazing peak of summer.

The flights were investigating how weather systems and other atmospheric phenomena affect the movement of carbon dioxide and methane in the atmosphere around the eastern half of the United States.

This year, those same researchers are doing it all again. And this time, they’re heading out during the deepest, coldest part of winter. Flights out of Shreveport, Louisiana, begin February 1. In coming weeks, ACT-America’s base of operations will move twice — once to Lincoln, Nebraska, and then to coastal Virginia.

A crew makes final preparations to NASA’s C-130H at Wallops Flight Facility on Virginia’s Eastern Shore ahead of ACT-America’s winter field campaign. Credit: NASA/Patrick Black

So why trade one seasonal extreme for another?

“Because the carbon budget, especially when it comes to carbon dioxide, is highly seasonal,” said Ken Davis, ACT-America prinicpal investigator from Penn State University.

From summer to winter, the exchange of carbon dioxide between the biosphere on land and the atmosphere goes through some big changes.

“The biosphere is growing vigorously in the summer, taking carbon dioxide out of the atmosphere,” said Davis from his office at Penn State. “In the winter, it’s slowly breathing out — not a lot, because it’s cold. But it is slowly exhaling all winter long.”

The transport of greenhouse gases through the atmosphere can be quite different in winter as well. The jet stream plunges deeper south and tends to bring with it more intense storms. Those mid-latitude cyclones cause vigorous mixing of the gases in the atmosphere.

One thing that tends to stay relatively steady from season to season — human carbon emissions from the extraction and burning of fossil fuels.

What makes ACT-America unique is that it marks the first time aircraft outfitted to take advanced measurements of greenhouse gases have collected continuous data on how greenhouse gases are transported through the atmosphere by weather systems.

Previous measurements studying greenhouse gases have mostly come from tower-based measurement stations and satellites (one of ACT-America’s goals is actually to verify data coming in from NASA’s Orbiting Carbon Observatory-2 satellite), or from aircraft flying in fair weather conditions when atmospheric transport is relatively simple.

The campaign will use instruments on a C-130H based out of NASA’s Wallops Flight Facility on Virginia’s Eastern Shore and a King Air B-200 based out of NASA’s Langley Research Center in Hampton, Virginia.

Charles Howell, electronics engineer, makes final adjustments to the electrical system of NASA’s King Air B-200 at Langley Research Center in Hampton, Virginia. Credit: NASA/David C. Bowman

Davis believes the data the ACT-America team is collecting could help paint a much more detailed picture of what’s happening with greenhouse gases in the U.S.

“It’s our vision to enable the research community to monitor over time and space carbon dioxide and methane fluxes,” he said. “For example, if forests in the eastern U.S. become stressed by droughts and begin to de-gas their carbon stocks into the atmosphere, we want be able to detect it from atmospheric data and know quickly that we have a problem. And if measures are taken to reduce methane emissions from agriculture, and oil and gas extraction, we want to be able to verify that they’re proving effective.”

Breaking up the Intensity

Amid the flurry of activity that comes with being in the field, Ken Davis, principal investigator for ACT-America from Penn State, finds moments of calm in running and exploring nature. Credit: NASA/David C. Bowman

That long-term vision motivates Davis as he faces what he refers to as “the intensity of the field deployment.”

To keep the intensity manageable, he finds little ways to decompress. The Penn State professor is an avid runner. Last summer, when he wasn’t on a flight or planning a flight or doing something related to the campaign, it wasn’t unusual to catch Davis in his unofficial uniform: a T-shirt, shorts and running shoes. That’s not likely to change for this flight campaign, regardless of the weather.

“That’s been my thing for a long time,” he said. “Get outside, go for a run.”

Davis also hopes to slow down and enjoy his surroundings — particularly in Virginia.

Last July wasn’t exactly the best time for that. From his temporary home base at Wallops, Davis ventured out to visit nearby Chincoteague National Wildlife Refuge and Assateague Island National Seashore. The area is known for its pristine beaches, herds of wild ponies and migratory bird populations.

Unfortunately, when it’s warm, the area is also known for its hungry mosquitoes.

So Davis hopes the winter season will not only bring changes to concentrations of greenhouse gases, but also to concentrations of blood-sucking insects.

“We went out there in the summer and were eaten alive,” he said. “But I like the place and it should be fun to see it in the winter when we won’t be eaten alive.”

Why Ocean Particles? Why NASA?

by Stephanie Schollaert Uz / NORTHERN PACIFIC OCEAN /

Rolling with the waves on the research vessel Falkor, we’re searching for particles—primarily microscopic marine plants called phytoplankton, which play an important role in supporting life on Earth. Ocean phytoplankton come in many sizes, colors and types. This diversity determines their roles in the marine food web and our ability to distinguish them from Earth-observing satellites.

With improved optical instrumentation, we hope to regularly monitor their unique spectral signatures, or colors, from space. The collection of high-quality measurements taken at sea is essential for achieving that goal. Among the international team of 14 scientists and an artist-at-sea aboard this ship, many are using new technology and methods for the first time.

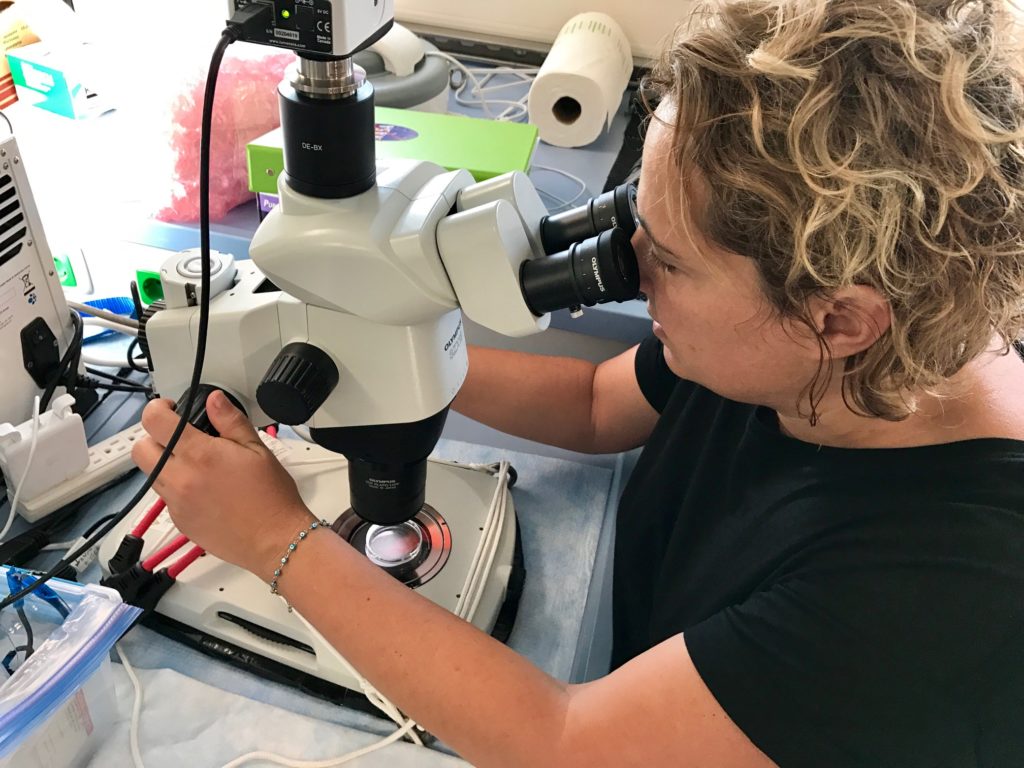
Zrinka Ljubesic, University of Zagreb, is observing phytoplankton and swimming zooplankton in sea water samples through the microscope. Credit: Stephanie Schollaert Uz/NASA
Zrinka Ljubesic, University of Zagreb, is observing phytoplankton and swimming zooplankton in sea water samples through a microscope. Credit: Stephanie Schollaert Uz/NASA

We sailed out of Honolulu on Thursday, January 26, and will end the expedition, called the Sea to Space Particle Investigation, in Portland, Oregon, next month. Our first stop to test instruments and collect samples was near the Marine Optical Buoy (MOBY) off Lanai, which has been measuring ocean color to calibrate NASA satellite data for 20 years.

Cloud-free skies at MOBY meant that I could take indirect measurements of atmospheric particles using a hand-held sun photometer. Knowing what’s in the sky is important for correcting satellite measurements of ocean color. About 90 percent of the signal satellites receive comes from the atmosphere. These sky measurements may also provide clues about the presence of mineral aerosols that fertilize phytoplankton blooms when they fall out of the air.

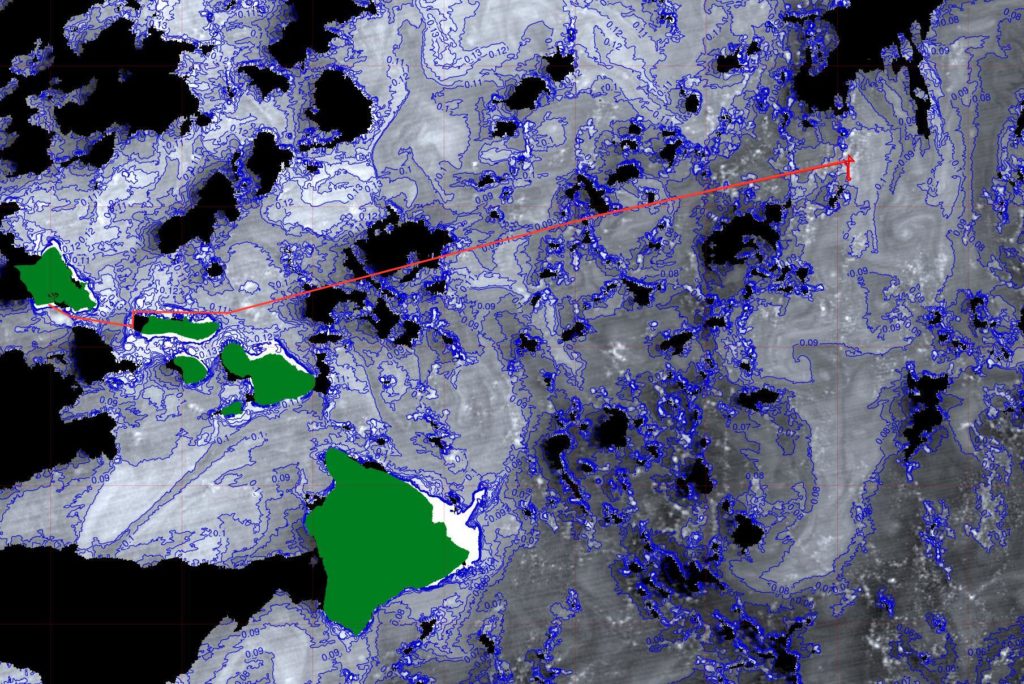
Hawaiian Islands in green with chlorophyll concentrations contoured at 0.1 mg m-3 intervals from the Suomi-NPP VIIRS at 22:54 UTC on Jan 27, 2017. The ship’s track is shown in the red line. Credit: Norman Kuring/NASA
The Hawaiian Islands are shaded green, and chlorophyll concentrations are contoured at intervals of 0.1 milligrams per cubic meter from the Suomi-NPP VIIRS at 22:54 UTC on Jan 27, 2017. The ship’s track is shown in the red line. Credit: Norman Kuring/NASA

Participating in this field campaign to improve the quality of ocean color satellite measurements are five of us from NASA Goddard’s Ocean Color group, including chief scientist Ivona Cetinic, plus NASA-funded scientists from other organizations. In addition to improving current satellite measurements, data collected here will assist in the development of algorithms for NASA’s first hyper spectral satellite called Plankton, Aerosol, Cloud, ocean Ecosystem, or PACE, scheduled to launch in 2022.

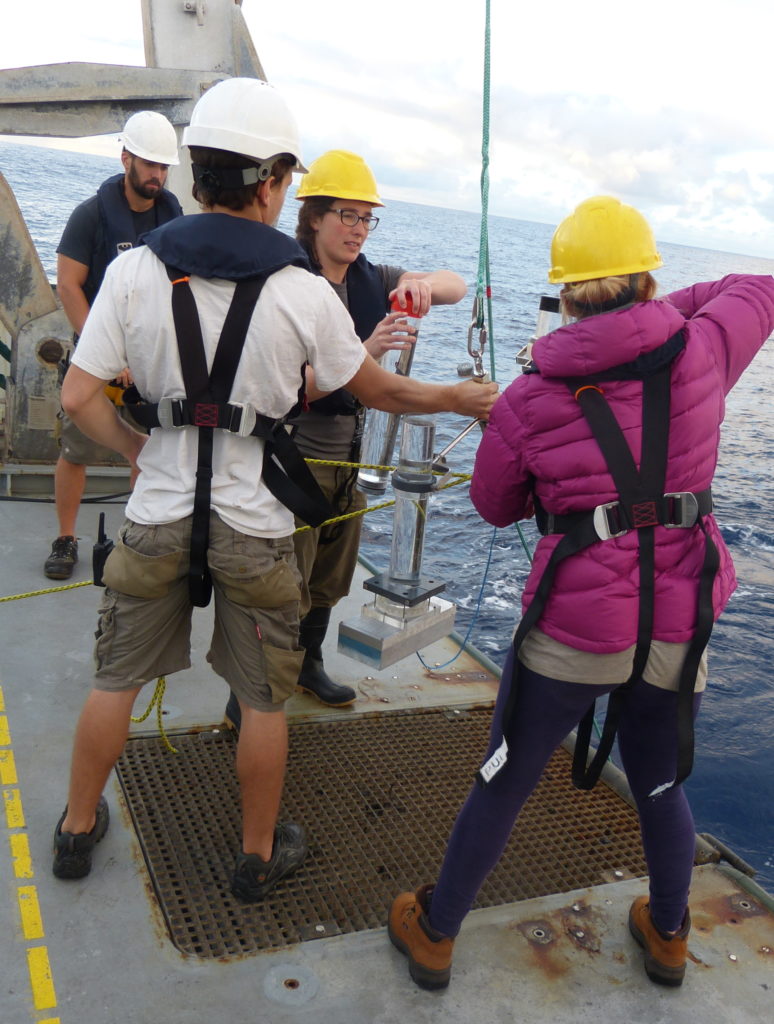
Scientists in yellow hard hats: Colleen Durkin (left) of Moss Landing Marine Lab and Melissa Omand of the University of Rhode Island (URI) ready sediment traps assisted by R/V Falkor crew members. The aluminum block below one trap includes an iPhone camera programmed for time lapse image collection by Omand and Noah Walcutt, both of URI, for use in holographic research by Ben Knorlein, Brown University. Credit: Zrinka Ljubesic, University of Zagreb
Scientists in yellow hard hats: Colleen Durkin (left) of Moss Landing Marine Lab and Melissa Omand of the University of Rhode Island (URI) ready sediment traps assisted by R/V Falkor crew members. The aluminum block below one trap includes an iPhone camera programmed for time lapse image collection by Omand and Noah Walcutt, also of URI, for use in holographic research by Ben Knorlein, Brown University. Credit: Zrinka Ljubesic, University of Zagreb

The expedition also includes scientists funded by the National Science Foundation who are conducting basic research into the variability of sinking particles, sometimes called marine snow. Two different types of sediment traps are being deployed to capture sinking particles, such as fecal pellets, aggregates and shells from certain phytoplankton, that will be identified under the microscope in the lab and through DNA sequencing.

A video clip of the Wirewalker being deployed from the RV/Falkor. Credit: Stephanie Schollaert Uz/NASA

Meg Estapa of Skidmore College uses sediment traps mounted to a neutrally buoyant float that drifts around 150 meters deep near the base of the wind-mixed surface layer. Melissa Omand of the University of Rhode Island (URI) has sediment traps that also drift at a depth of 150 meters but is tethered to a surface buoy. A Wirewalker cycles up and down between them every 10 minutes measuring physical and biological indicators such as temperature, oxygen and phytoplankton fluorescence.

The traps go with the flow for four days as we sample the ocean down to 500 meters deep in a 20-square-kilometer box around them. The crew is extremely helpful and supportive of our research—even when it involves such duties as collecting water samples in the dead of night.

R/V Falkor ship time is generously provided by the Schmidt Ocean Institute, a philanthropic organization led by Google CEO Eric Schmidt and his wife, Wendy Schmidt. Ironically, the main challenge is insufficient internet bandwidth. We’re all struggling to maintain minimal connection to the networked world. To distract us from our separation anxiety, however, is an incredible neverending menu of amazing food that one scientist compared to a wedding feast.

For #Sea2Space cruise track and updates: https://schmidtocean.org/cruise/sea-space-particle-investigation/

Ready to Go to Sea? Heck, Yes!

by Stephanie Schollaert Uz / GREENBELT, MARYLAND /

On January 20, as our nation’s capitol kicks into full inauguration frenzy, I’ll be catching a flight in the pre-dawn hours and heading west to the middle of the Pacific Ocean. I have never been more excited to head out to sea! Guilt about leaving my family for a month-long research cruise aside, I have been studying the ocean from a chair for too long and jumped at the chance to participate in this expedition.

Carlie Wiener of the Schmidt Ocean Institute with a Lego model of the research vessel Falkor, the platform for the ‘Sea to Space Particle Investigation’. Credit: Stephanie Schollaert Uz
Carlie Wiener of the Schmidt Ocean Institute with a Lego model of the research vessel Falkor, the platform for the Sea to Space Particle Investigation. Credit: Stephanie Schollaert Uz

I spent the early part of my career at sea plying the North and South Atlantic and the Mediterranean Sea: first as a Naval meteorology and oceanography officer and then as an oceanography researcher. More recently, my research has involved the nearly continuous view that satellites afford. Satellites are great because they view the entire ocean, nearly every day! But they only see the surface of the ocean, and sometimes we need to know what’s happening underneath, in the interior of the ocean, or how small-scale dynamics in the ocean are related to the surface signatures that we can detect from satellites. That is why NASA needs measurements collected at sea, and I’m looking forward to getting a close look at all the new in situ instruments in action.

The main goals of this expedition are to observe and characterize ocean phytoplankton (kinds, size, function) and sinking carbon. Measurements we collect about particles in the ocean and atmosphere will be used to tune, or ‘ground-truth,’ ocean color satellite observations. There is a lot of diversity among microscopic phytoplankton, and NASA is designing a satellite to distinguish major kinds. Data from this cruise will contribute toward that effort.

FlowCam microscopic images of diatoms (left), dinoflagellates (center & right). Credit: Harry Nelson/Fluid Imaging Technologies, Inc.
FlowCam microscopic images of diatoms (left), and dinoflagellates (center & right). Credit: Harry Nelson/Fluid Imaging Technologies, Inc.

How have I been preparing for this field campaign? Personally, I began preparing months ago by re-reading “The Never-ending Story” by Michael Ende with my ten-year-old, as the ship is named for the luckdragon Falkor. I visited my dentist and doctor to avoid any distraction in the middle of the ocean by a minor illness, such as a toothache, or a major emergency that could cost the expedition precious days at sea. More recently I have been collecting proper gear for the weather and conditions we expect between the tropics and North Pacific: water-proof overalls and jacket, steel-toed boots. Friends who’ve been to sea more recently also advised packing other details I’d forgotten, like shower shoes. With all the wintertime weather we could get, I’m packing motion-sickness medicine in case of high seas.

My sea bag - no space to store suitcases at sea – packed for the tropics and the foul weather anticipated in the North Pacific. Credit: Stephanie Schollaert Uz/NASA
My sea bag – no space to store suitcases at sea – packed for the tropics and the foul weather anticipated in the North Pacific. Credit: Stephanie Schollaert Uz/NASA

Professional preparations also started months ago. My scientific contribution to the campaign will include monitoring physical variables (temperatures, currents, sea-surface heights) that indicate dynamical processes bringing nutrients from the depths toward the surface ocean to fertilize phytoplankton blooms. I’ve been talking to colleagues at NASA Goddard, JPL and NOAA who provide continuous near-real-time satellite and computer model information for this region that we can access during the cruise.

When we have cloud-free skies, I will take measurements of atmospheric particles using a hand-held sun photometer loaned to me by the Maritime Aerosol Network group at NASA Goddard. Knowing what’s in the sky is important for correcting satellite measurements of the ocean’s surface – about 90% of the signal satellites receive comes from the atmosphere. These sky measurements may also provide clues about the presence of mineral aerosols that fertilize phytoplankton blooms when they fall out of the air.

Current sea-surface temperatures with the approximate track of the R/V Falkor from Hawaii to the Pacific Northwest. Credit: PO.DAAC/NASA

I’m also helping the field campaign with science communication through my role as communications coordinator for the Plankton, Aerosol, Cloud, ocean Ecosystem (PACE) Project – NASA’s first hyperspectral ocean color satellite. In conjunction with our hosts at the Schmidt Ocean Institute, we’re planning news stories, blogs and events on social media such as a Facebook Live event on @NASAEarth, February 6, at 2pm EST. Data collected during this field campaign and several others (e.g. CORAL, NAAMES, KORUS-OC) will be used to improve products derived from satellite measurements.

How am I feeling? Ready for this adventure and extremely grateful to the Schmidt Ocean Institute for sponsoring this research, to the scientists who wrote the proposal that was selected for this expedition, especially Ivona Cetinic, the chief scientist, who invited me to participate, and to my family for enabling me to take this month-long trip. Mostly though, I’m grateful to live in a society that values scientific inquiry and exploration. The more we know about Earth and the dynamic processes that support life, the better we can predict and prepare.

NASA IceBridge: Fit to Fly

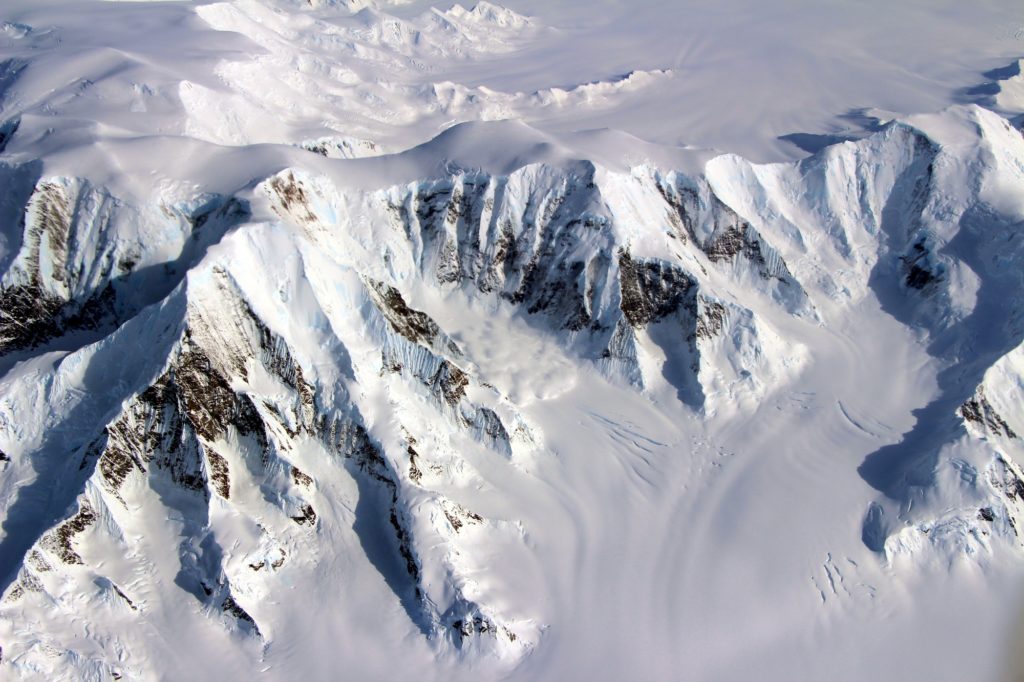
The Mountains of Alexander Island as seen from the NASA DC-8 on October 15, 2016.  The curious feature near the floor of the valley at center may be a small patch of fog, or it may be an avalanche in progress. Credit: NASA/John Sonntag
The Mountains of Alexander Island as seen from the NASA DC-8 on October 15, 2016. The curious feature near the floor of the valley at center may be a small patch of fog, or it may be an avalanche in progress. Credit: NASA/John Sonntag

by Emily Schaller / PUNTA ARENAS, CHILE /

Imagine a 12-hour flight that takes off and lands in exactly the same place. Now imagine willingly boarding that flight six days per week. This is the routine that NASA’s Operation IceBridge team in Punta Arenas, Chile, follows for six weeks every fall in order to collect data on Antarctica’s changing ice sheets, glaciers and sea ice. Operation IceBridge’s mission is to collect data on changing polar land and sea ice and maintain continuity of measurements between ICESat missions. The original ICESat mission ended in 2009, and its successor, ICESat-2, is scheduled for launch in 2018.

Our DC-8 flying laboratory can’t land on the icy surface of Antarctica, so instead we base our operations as close as we can get—near the southern tip of Chile. The schedule is grueling but incredibly important for maintaining a yearly record of Antarctica’s changing ice.

What is it like inside the airplane every day for those 12-hour flights?

There are generally about 25 of us aboard, including pilots and crew and a team of scientists and engineers who operate a variety of instruments measuring the thickness and extent of ice sheets.

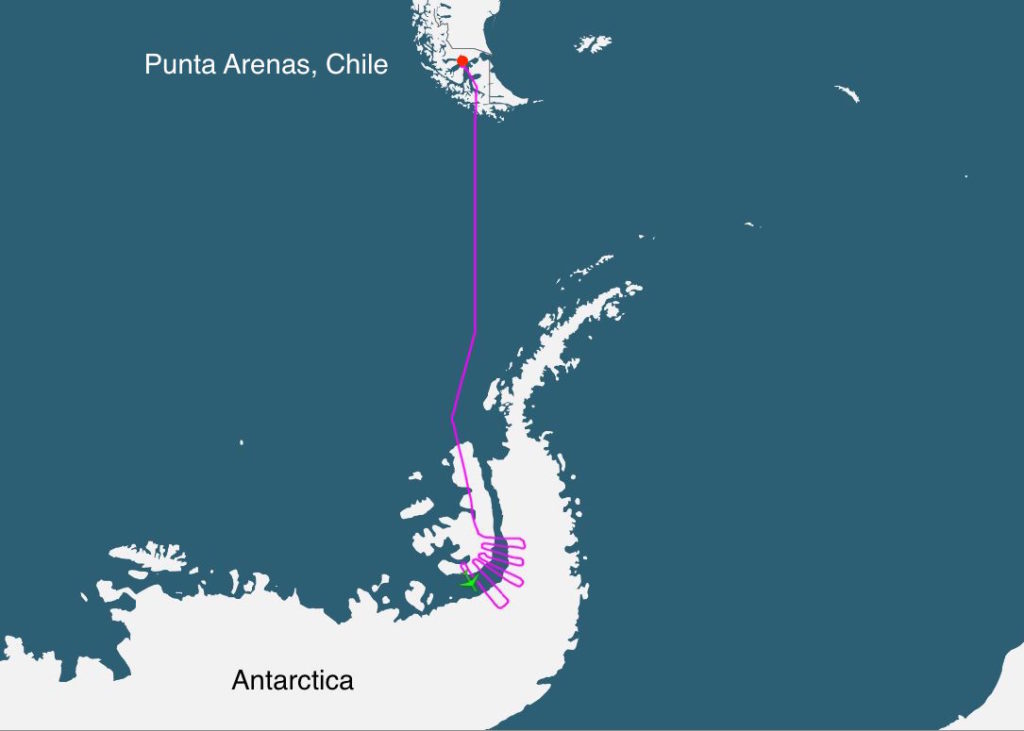
Operation IceBridge's DC-8 flight track from October 14, 2016, showing the position of the aircraft (green icon) over Antarctica about half way through the 11-hour science flight.  The DC-8 takes off and lands at Punta Arenas, Chile.
Operation IceBridge’s DC-8 flight track from October 14, 2016, showing the position of the aircraft (green icon) over Antarctica about half way through the 11-hour science flight. The DC-8 takes off and lands at Punta Arenas, Chile. Credit: NASA

Much of the roughly 12-hour flight is spent flying to and from Antarctica, with the meat of the science in the middle hours of the flight (between 3-9 hours after takeoff, if our mapping target of the day is near the Antarctic coast, or between 4-8 hours after takeoff if our mapping target is closer to the pole).  Most of the instruments do not collect data until we get to Antarctica, so this leaves hours of downtime at the beginning and end of each flight for many of the people aboard (except for the pilots and navigators, of course!).  We often fill this time with outreach and educational activities, as our airplane’s satellite data system allows us to live chat with classrooms back in the United States and all over the world.  Over the past 4 years, nearly 5,000 students in K-12 classrooms across the US and in Canada, Mexico and Chile have connected directly with our IceBridge teams in-flight.

In order to keep ourselves in shape and build team morale, an informal airborne Antarctic workout club has formed to help pass the time during our long flights. Originally inspired by a Navy tradition of dropping and doing 25 pushups on the hour, every hour, our DC-8 version of this tradition persists on many missions due to the encouragement of DC-8 Navigator Walter Klein, Operations Engineer Matt Berry and by IceBridge Project Manager John Woods.

Pushups_DC8_Antarctica
On October 15, 2016, while flying over Antarctica on the NASA DC-8, members of the Workout Club Above Antarctica get moving. Left: John Woods and Walter Klein. Right: Emily Schaller and Walter Klein. Credit: NASA/Emily Schaller

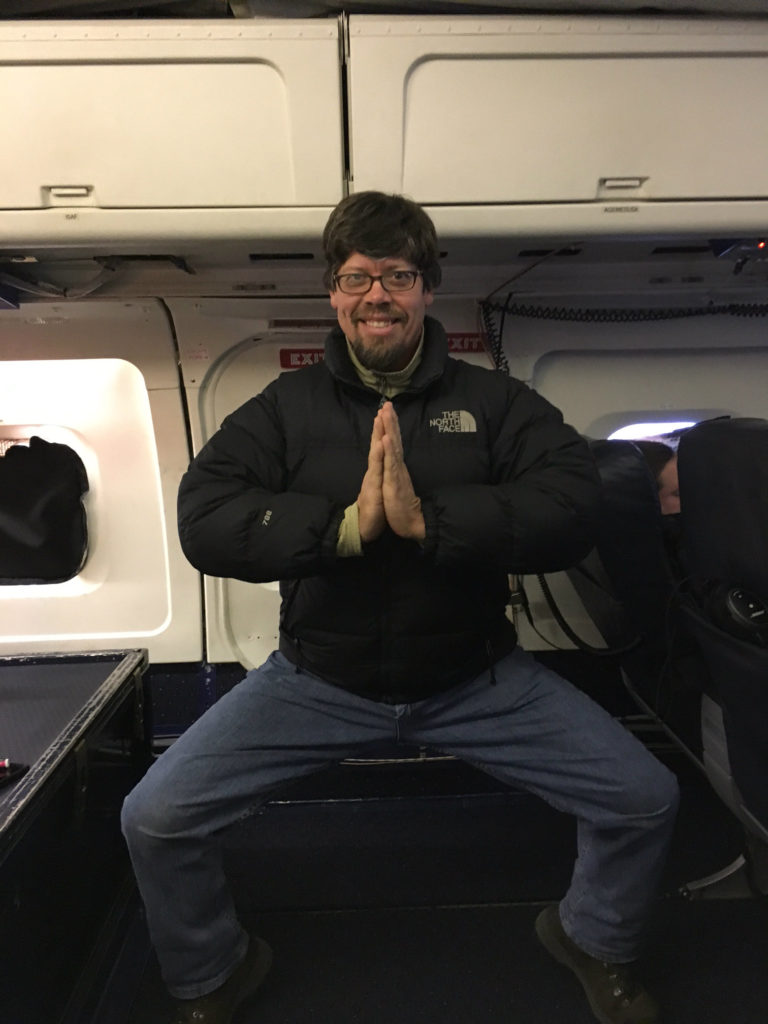
On recent IceBridge flights, in addition to (or in place of) pushups (depending on the person), the on-the-hour exercise also includes squats, stretching, yoga and ballet.

 IceBridge instrument scientist, Eric Fraim, aboard the DC-8 during an hourly exercise break, practices a Barre3-inspired pose above Antarctica. Credit: NASA/Emily Schaller

IceBridge instrument scientist, Eric Fraim, aboard the DC-8 during an hourly exercise break, practices a Barre3-inspired pose above Antarctica. Credit: NASA/Emily Schaller

While not everyone gets up every hour due to their various duties, there are usually a few people nearly every hour doing activities to keep the blood flowing and their minds and bodies engaged during the long daily flights over Antarctica.

NASA IceBridge Antarctica: We are fit to fly!