On Sept. 7, NASA’s Global Precipitation Measurement, or GPM, core observatory satellite flew over Hurricane Florence, capturing a 3D image as the storm’s clouds started to break apart before reforming. Credits: NASANASA’s Earth Science Disaster Program is using the vantage point of space to provide important information to disaster responders before and after Hurricane Florence approaches the Carolinas.
Before the storm makes landfall, the space agency is utilizing data from satellites, such as Soil Moisture Active Passive (SMAP) to home in on areas that are saturated with water and Global Precipitation Measurement (GPM) to track rainfall rates across the body of the storm, in order to help determine which areas are at greater risk for flooding. The potential for landslides are also evaluated by looking at those factors in addition to land topography.
The crew aboard the International Space Station stared down the menacing eye of what was then Category 4 Hurricane Florence on Sept. 12 as it moved across the Atlantic Ocean and toward the East Coast of the United States. Credits: NASAAstronauts aboard the International Space Station are also taking advantage of their one-of-a-kind vantage point a few hundred miles above Earth as they snap photos of the hurricane with handheld digital cameras. These wide-field, panoramic images help inform the size, scale, and location of the storm based on the ISS orbital ground track location, and multiple images taken over time relays important data on its evolution and life cycle.
As the storm hits the coasts and marches inland, NASA’s continually updated flood extent maps, derived from radar-based satellites that can “see through” clouds, will identify inundated areas, and the latest in flood modeling will anticipate for decision makers where flooding may occur next. This information is important for a number of decisions pertaining to evacuation routes, supply chains, and resource and relief allocation.
To provide situational awareness for first responders and other government authorities, in the storm’s aftermath NASA will maintain flood extent maps drawn from data collected by the Moderate Resolution Imaging Spectroradiometer (MODIS) aboard the Terra and Aqua satellites as well as the Landsat satellite, a joint mission of NASA and the U.S. Geological Survey.
Composite image of the continental U.S. at night, 2016. Credits: NASA Earth Observatory images by Joshua Stevens, using Suomi NPP VIIRS data from Miguel Román, NASA’s Goddard Space Flight CenterAnother tool in the recovery effort is NASA Goddard Space Flight Center’s Black Marble product suite, which can report daily on whether the power is on over over large swaths of land. Such information is important for understanding the extent of the damage, especially in remote and isolated areas that might not have robust communications systems in place. The technology was demonstrated during the response and recovery efforts following Hurricanes Irma and Maria in Puerto Rico, as it helped local communities strengthen their resilience by identifying preexisting infrastructure vulnerabilities across the island’s housing, transportation, and energy sectors.
Click here to watch NASA Administrator Jim Bridenstine and NASA Disasters Program Manager David Green discuss how the space agency is assisting federal and state partners in preparing for and responding to Hurricane Florence.
Preparing for Hurricane Florence
Hurricane Florence is expected to bring heavy wind and rain to large parts of the East Coast in the coming days. The federal government released recommendations for how to prepare and evacuate.
Sep. 17, 2018 – NASA Catches Tropical Cyclone 01S’s Last Breath in So. Indian Ocean
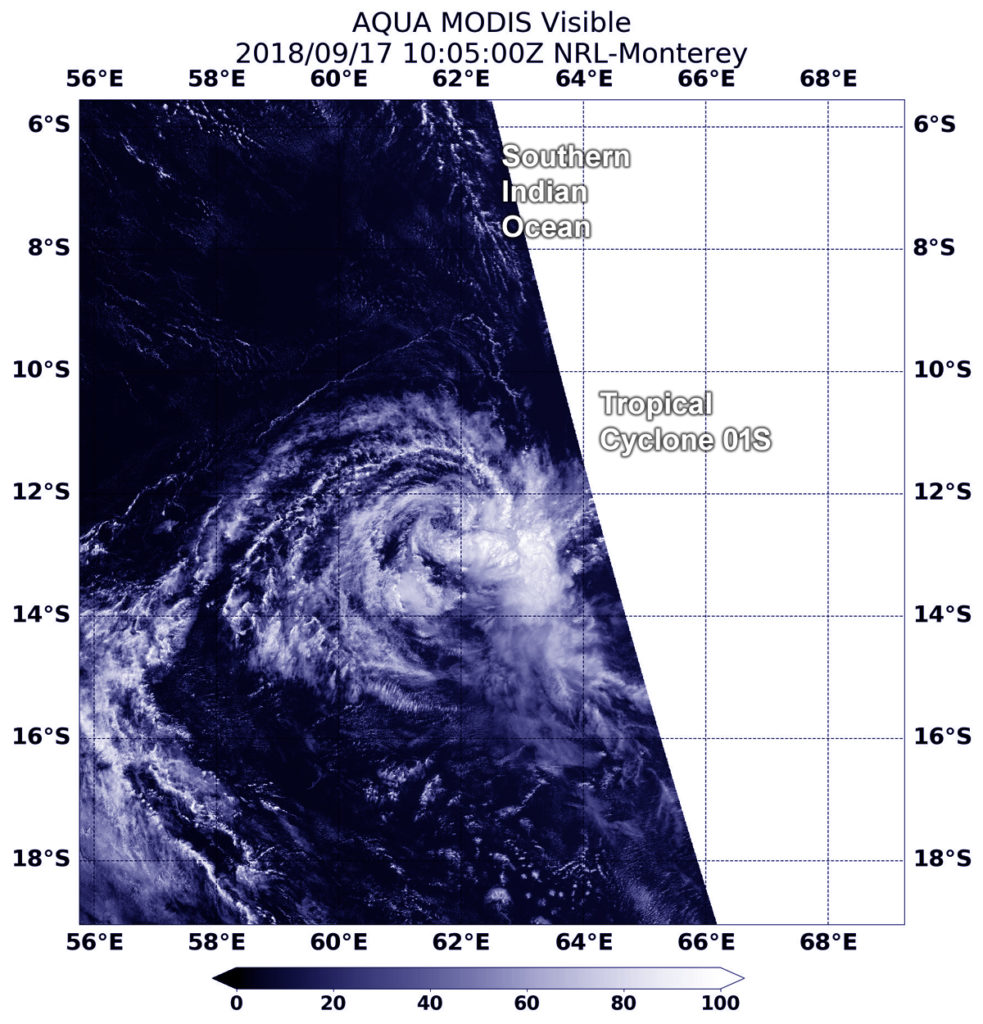
The first tropical cyclone of the Southern Indian Ocean season, 01S, formed on Sept. 15 and was already fizzling two days later. Visible satellite imagery from NASA’s Aqua satellite revealed recently developed tropical cyclone 01S was already fading.
At 6:05 a.m. EDT (1005 UTC) on Sept. 17, the MODIS instrument aboard Aqua captured a visible image of Tropical Depression 01S in the Southern Indian Ocean. Visible satellite imagery shows a few cloud swirls pivoting around a mean center with only a small amount of strongest thunderstorms displaced east of the center. Credit: NASA/NRL
At 6:05 a.m. EDT (1005 UTC) on Sept. 17, the Moderate Resolution Imaging Spectroradiometer or MODIS instrument aboard Aqua captured a visible image of Tropical Depression 01S. The MODIS image shows a few cloud swirls pivoting around a mean center with only a small amount of strongest thunderstorms displaced east of center.
The Joint Typhoon Warning Center or JTWC issued their final advisory on 01S on Sept. 17 at 0300 UTC (Sept. 16 at 11 p.m. EDT). At that time Tropical Cyclone 01S was located near 12.3 degrees south latitude and 63.6 degrees east longitude or 592 miles northeast of Port Louis, Mauritius. 01S was moving to the west and had maximum sustained winds 30 knots (34.5 mph/55.5 kph). However, the winds were weakening and 01S is forecast to dissipate soon.
Sep. 20, 2018 – NASA Created Rainfall Analysis for Super Typhoon Mangkhut
At NASA’s Goddard Space Flight Center in Greenbelt, Md. data was used to create a map of rainfall generated by Super Typhoon Mangkhut.
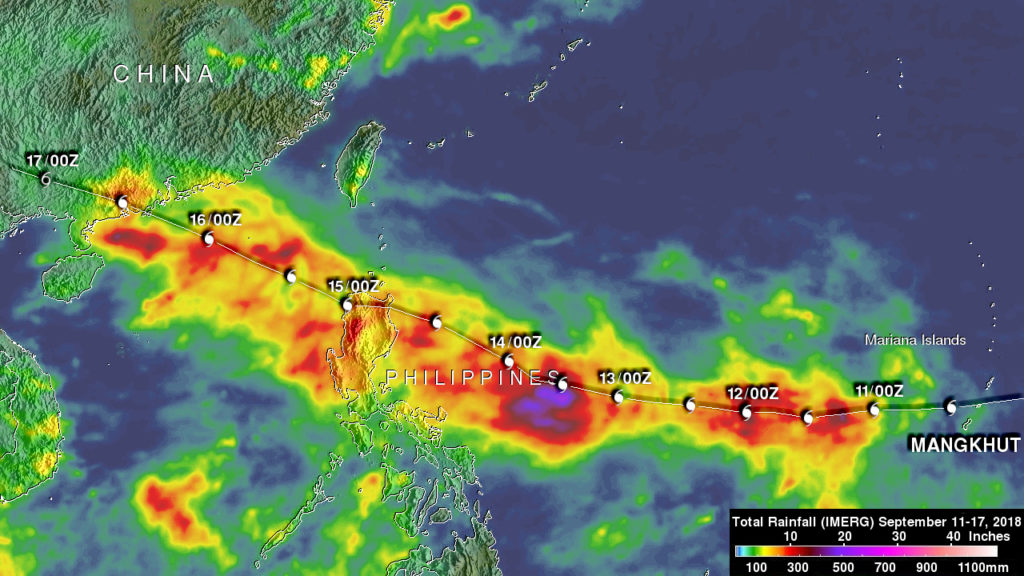
The NASA analysis showed IMERG rainfall estimates over the western Pacific Ocean during the period from September 11-17, 2018. Rainfall totals above 300 mm (11.8 inches) were often indicated along Mangkhut’s path. The highest rainfall accumulation estimates of over 700 mm (27.6 inches) were shown by IMERG south of Mangkhut’s track in the Philippine Sea. Credit: NASA/JAXA, Hal Pierce
Compared to hurricane Florence, that stalled over the state of North Carolina, super typhoon Mangkhut moved fairly quickly across the western Pacific. Mangkhut killed at least 81 people in the Philippines. The typhoon’s rainfall caused a landslide in the northern Philippines that killed at least 66 people. At least four people in China and one person in Taiwan were also reported victims of Mangkhut. When it was moving between the Marianas and the Philippines the typhoon had sustained winds reported at 155 knots (178 mph). Wind speeds of 135 knots (155 mph) were reported when it hit Hong Kong. This made it the most intense tropical cyclone in Hong Kong’s history.
The NASA rainfall accumulation analysis was derived from NASA’s Integrated Multi-satellitE Retrievals for GPM data (IMERG). GPM is the Global Precipitation Measurement mission satellite, managed by both NASA and the Japan Aerospace Exploration Agency.
The NASA analysis showed IMERG rainfall estimates over the western Pacific Ocean during the period from September 11-17, 2018. Rainfall totals above 300 mm (11.8 inches) were often indicated along Mangkhut’s path. The highest rainfall accumulation estimates of over 700 mm (27.6 inches) were shown by IMERG south of Mangkhut’s track in the Philippine Sea. Credit: NASA/JAXA, Hal Pierce
IMERG data are used to calculate estimates of precipitation from a combination of space-borne passive microwave sensors, including the GMI microwave sensor onboard the GPM satellite, and geostationary IR (infrared) data. The analysis showed IMERG rainfall estimates over the western Pacific Ocean during the period from September 11-17, 2018. During that period typhoon Mangkhut moved west of Guam to the Philippines and then over the South China Sea into southeastern China. Rainfall totals above 300 mm (11.8 inches) were often indicated along Mangkhut’s path. The highest rainfall accumulation estimates of over 700 mm (27.6 inches) were shown by IMERG south of Mangkhut’s track in the Philippine Sea.
Sep. 18, 2018 – 7-Day Animation of Mangkhut Affecting the Philippines
In the past week, Typhoon Mangkhut has affected the Philippines, mainland China, and Hong Kong, as shown in this 7-day animation of NASA’s satellite-based IMERG precipitation product.
The upper frame shows the storm-total accumulation starting at 0000 UTC on September 11, 2018 (8 p.m. EDT on Sept. 10). Storm-total accumulations in excess of 4 inches stretched from Manila to the northern tip of Luzon Island where the rainfall triggered deadly landslides.
The lower frame shows the short-term accumulation in a 3-hour period that slides from the beginning to the end of the 7-day-long movie. The sliding 3-hour accumulation clearly shows how Mangkhut’s compact eyewall prior to its Philippines landfall was replaced by a much larger, ragged eyewall thereafter. In some cases, interactions with mountainous islands greatly reduce a tropical cyclone’s rainfall, but in this case, Typhoon Mangkhut was too powerful to succumb to these mountain interactions.
NASA’s GPM or Global Precipitation Measurement mission satellite provides information on precipitation from its orbit in space. GPM is a joint mission between NASA and the Japan Aerospace Exploration Agency or JAXA. GPM also utilizes a constellation of other satellites to provide a global analysis of precipitation that are used in the IMERG calculation.
At NASA’s Goddard Space Flight Center in Greenbelt, Maryland, those data are incorporated into NASA’s IMERG or Integrated Multi-satellitE Retrievals for GPM. IMERG is used to estimate precipitation from a combination of passive microwave sensors, including the Global Precipitation Measurement (GPM) mission’s core satellite’s GMI microwave sensor and geostationary IR (infrared) data. IMERG real-time data are generated by NASA’s Precipitation Processing System every half hour and are normally available within six hours.
Credit: NASA/JAXA/NASA Goddard Scientific Visualization Studio
Sep. 17, 2018 – Warnings Were Up for Hong Kong for Typhoon Mangkhut After Landfall
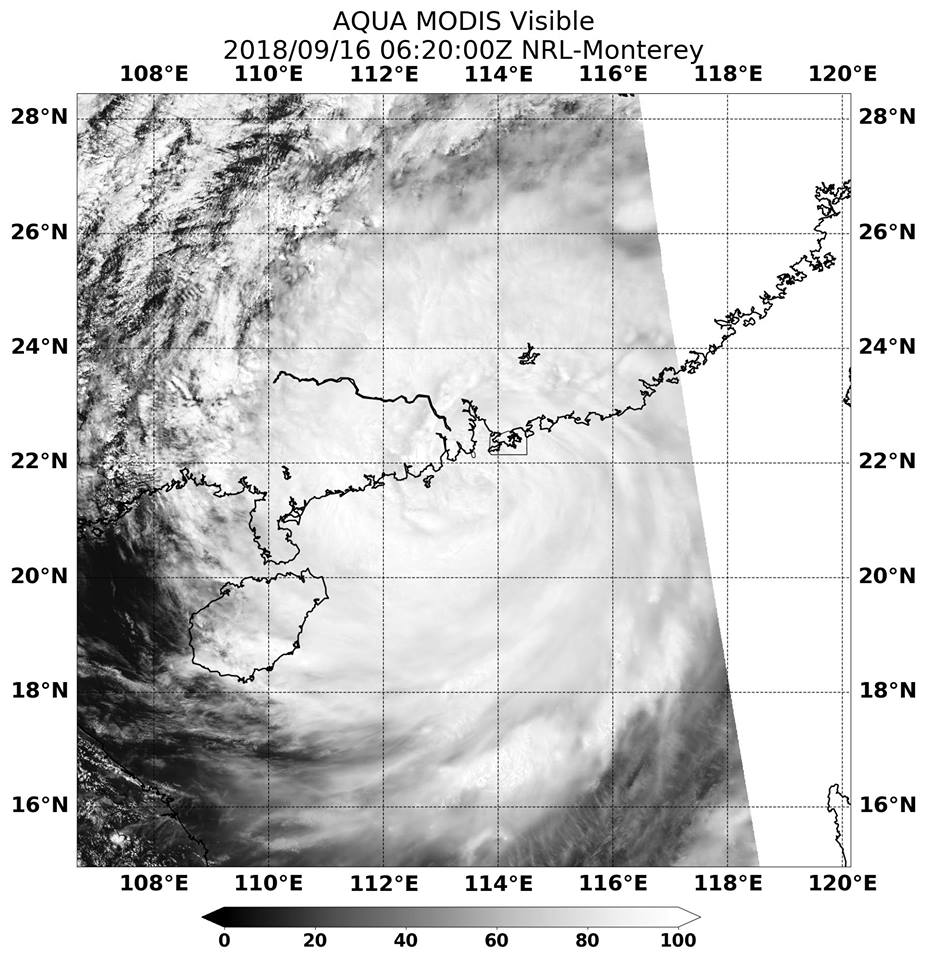
On Sunday, Sept. 16, Typhoon Mangkhut had made landfall in southern China and Hurricane signal #10 was still in force. NASA’s Aqua satellite passed over the storm and captured an image that showed the storm after landfall.
NASA’s Aqua satellite provided a visible look at the storm on Sept. 16 on 2:20 a.m. EDT (0620 UTC) after it made landfall in China. The image showed the cloud-filled center of the storm over the coast. Credit: NASA/NRL
A Red Alert, the most severe warning was issued by authorities in southern China.
At 5 a.m EDT (0900 UTC) on Sunday, Sept. 16, Mangkhut was centered near 21.6 north latitude and 113.6 east longitude, about 54 miles southwest of Hong Kong. Mangkhut was moving to the west-northwest at 17 knots and had maximum sustained winds 80 knots (92 mph/148 kph)
NASA’s Aqua satellite provided a visible look at the storm on Sept. 16 on 2:20 a.m. EDT (0620 UTC) after it made landfall in China. The image showed the cloud-filled center of the storm over the coast. The storm brought surges as high as 3 meters (approx. 9 feet) around Hong Kong.
On Sunday evening, local time, Typhoon Mangkhut made landfall in southern China’s Guangdong province.
After landfall, the storm moved inland and continued to weaken, dropping very heavy rainfall.
On September 14, 2018, the Visible Infrared Imaging Radiometer Suite (VIIRS) on the Suomi NPP satellite acquired a natural-color image of Mangkhut just after midday. Credit: NASA Earth Observatory images by Lauren Dauphin, using VIIRS data from the Suomi National Polar-orbiting Partnership.
In the early hours of September 15, 2018, Super Typhoon Mangkhut (Ompong) blew into Cagayan Province near the northern tip of Luzon, one of the most populated of the Philippine islands. Local reports described wind speeds of 205 kilometers (130 miles) per hour. The storm stretched nearly 900 kilometers (600 miles) across, with an eye 50 kilometers (30 miles) wide. It is the strongest tropical cyclone in any ocean basin so far this year.
Sep. 14, 2018 #1 – NASA Sees Dangerous Super Typhoon Mangkhut, Eyeing the Philippines
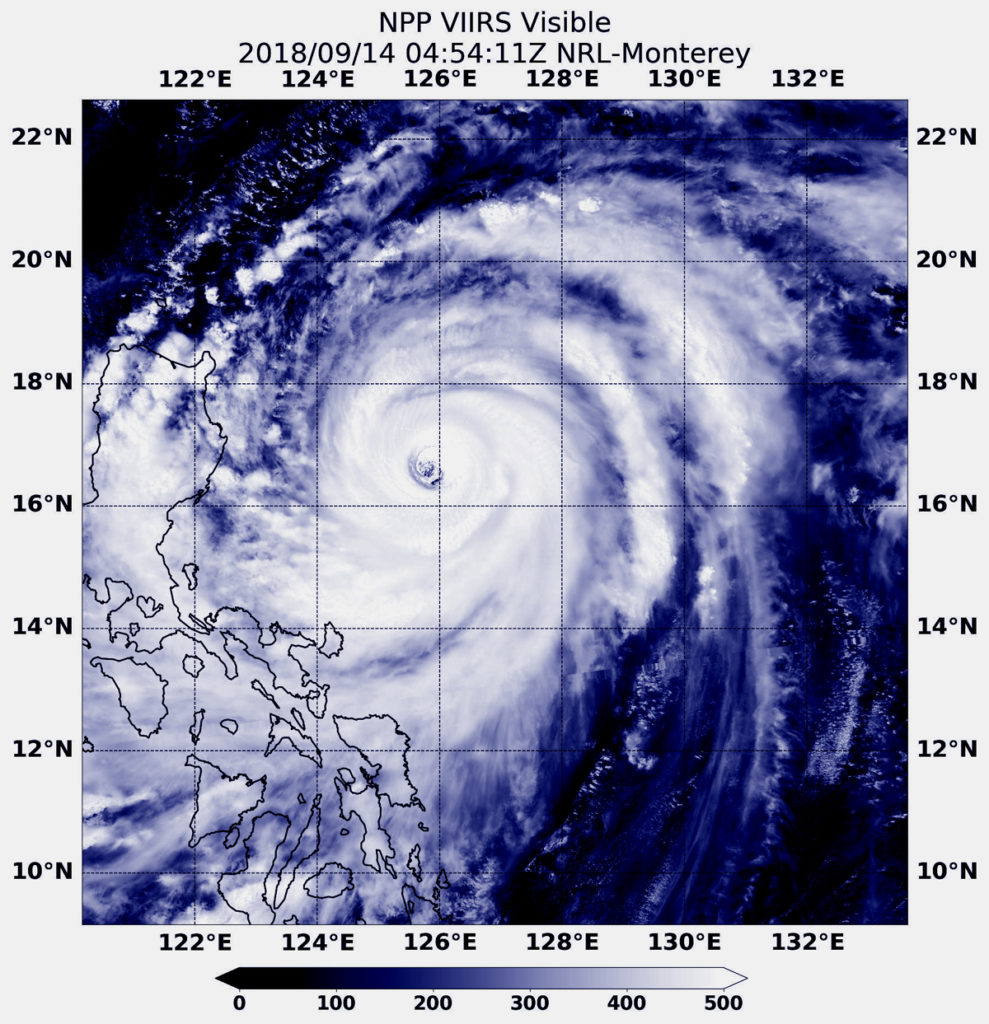
Super Typhoon Mangkhut is a powerful tropical cyclone headed toward the northern Philippines. It is a Category 5 storm on the Saffir-Simpson hurricane wind scale. NASA-NOAA’s Suomi NPP satellite provided a visible image as it passed over the Northwestern Pacific Ocean and stared the storm in its eye.
At 12:54 a.m. EDT (0454 UTC) on Sept. 14, the VIIRS instrument aboard NASA-NOAA’s Suomi NPP satellite captured a visible image of Super Typhoon Mangkhut approaching the Philippines. Credit: NASA/NRL
Many warnings are posted in the Philippines. They include: Public storm warning signal #3 for the Luzon provinces of Batanes, southern Isabela, Ilocos Sur, La Union, Mountain Province, Benguet, Ifugao, Nueva Vizcaya, Quirino, Northern Aurora. Public storm warning signal #2 is in effect for the Luzon provinces of Pangasinan, Tarlac, Nueva Ecija, southern Aurora, Zambales, Pampanga, Bulacan, Northern Quezon incl. Polillo Island. Public storm warning signal #1 is in effect for the Luzon provinces of Bataan, Rizal, Metro Manila, Cavite, Batangas, Laguna, Rest of Quezon, Lubang Is.,Marinduque, Camarines Norte, Camarines Sur, Catanduanes, Albay, Burias Island.
In the Philippines, Mangkhut is known locally as Ompong.
At 12:54 a.m. EDT (0454 UTC) on Sept. 14, the VIIRS instrument aboard NASA’s Aqua satellite captured a visible image of Mangkhut. The image showed a symmetrical storm with a clear eye surrounded by powerful thunderstorms. At the time of the image, the western quadrant of the storm was already spreading over the eastern Philippines.
The Joint Typhoon Warning Center noted on Sept. 14 at 11 a.m. EDT (1500 UTC) Barijat’s maximum sustained winds were near 167 mph (145 knots/268 kph). It was located near 17.4 degrees north latitude and 124.4 east longitude. That’s approximately 245 nautical miles northeast of Manila, Philippines. Mangkhut is moving to the west-northwest.
Mangkhut is moving northwest and is forecast to pass over the north of Luzon as a category 5 equivalent typhoon. After re-emerging over water, the system is forecast to re-strengthen slightly to pass close the south coast of China towards a landfall in northern Vietnam.
Sep. 13, 2018 – NASA Satellite Analyzes Powerful Super Typhoon Mangkhut
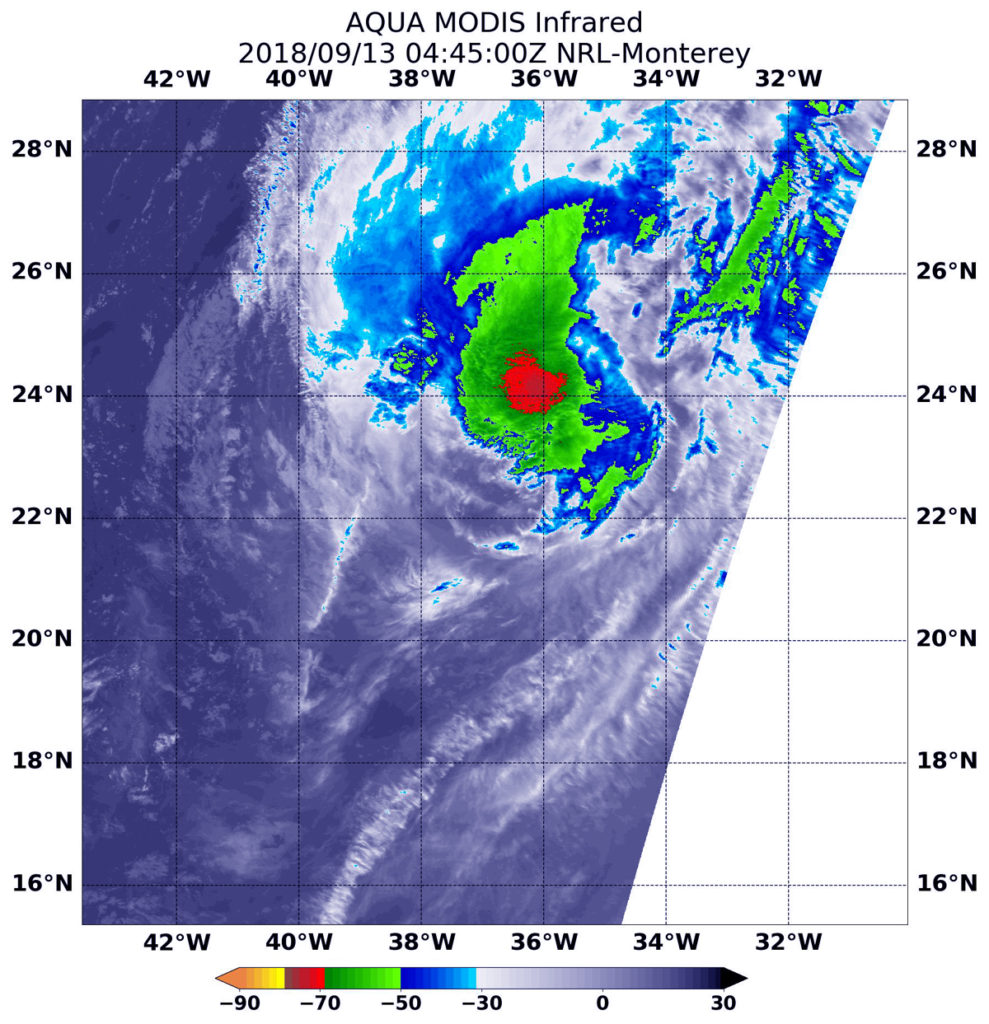
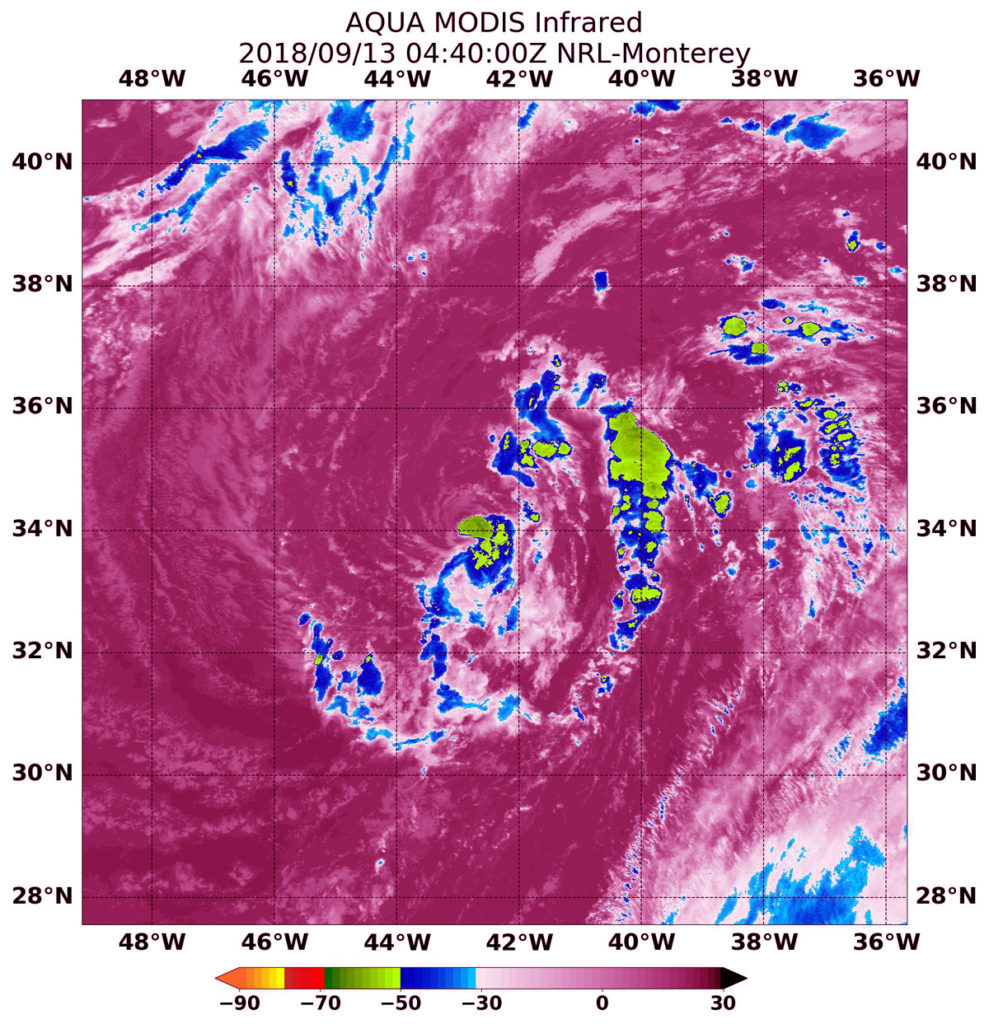
NASA’s Aqua satellite provided an infrared look at powerful Super Typhoon Mangkhut early on Sept. 13 that revealed a large eye surrounded by a large area of powerful storms. Mangkhut is a Category 5 storm.
At 9:35 a.m. EDT (1335 UTC) on Sept. 13, the MODIS instrument aboard NASA’s Aqua satellite looked at Super Typhoon Mangkhut in infrared light as it was approaching the Philippines. MODIS found coldest cloud top temperatures around the eye, as cold as or colder than minus 80 degrees (yellow) Fahrenheit (minus 112 degrees Celsius). Surrounding the eye were thick rings of powerful storms with cloud tops as cold as or colder than minus 70 degrees (red) Fahrenheit (minus 56.6 degrees Celsius). Credit: NASA/NRL
The Joint Typhoon Warning Center noted that “animated enhanced infrared satellite imagery shows deepening or strengthening convection (rising air that forms the thunderstorms that make up a tropical cyclone) with colder cloud tops.” Colder cloud tops mean that the uplift of air has strengthened and pushed cloud tops higher in the troposphere. The higher and colder the cloud top, the stronger the storm and the greater potential for heavier rainfall.
At 9:35 a.m. EDT (1335 UTC) on Sept. 13, the MODIS instrument aboard NASA’s Aqua satellite looked at Typhoon Mangkhut in infrared light as it was approaching the Philippines. MODIS saw that Mangkhut has a 27 nautical-mile-wide eye.
MODIS also found coldest cloud top temperatures around the eye, as cold as or colder than minus 80 degrees Fahrenheit (F)/minus 112 degrees Celsius (C). Surrounding the eye were thick rings of powerful storms with cloud tops as cold as or colder than minus 70F (minus 56.6C).
NASA research has found that cloud top temperatures as cold as or colder than the 70F/56.6C threshold have the capability to generate heavy rainfall.
At 11 a.m. EDT (1500 UTC), the center of Super Typhoon Mangkhut was located near latitude 15.2 degrees north and longitude 128.4 degrees west. That’s about 465 miles east of Manila, Philippines. Super Typhoon Mangkhut was moving toward the west-northwest. Mangkhut’s maximum sustained winds were near 167 mph (145 knots/268 kph) with higher gusts. Mangkhut is a Category 5 hurricane on the Saffir-Simpson hurricane wind scale.
Mangkhut is forecast to make landfall along the northeast coast of Luzon, Philippines around 5 p.m. EDT (2100 UTC) on Sept. 14. Warnings are already in effect.
Sep. 12, 2018 – NASA-NOAA Satellite Stares Down Super Typhoon Mangkhut’s Eye
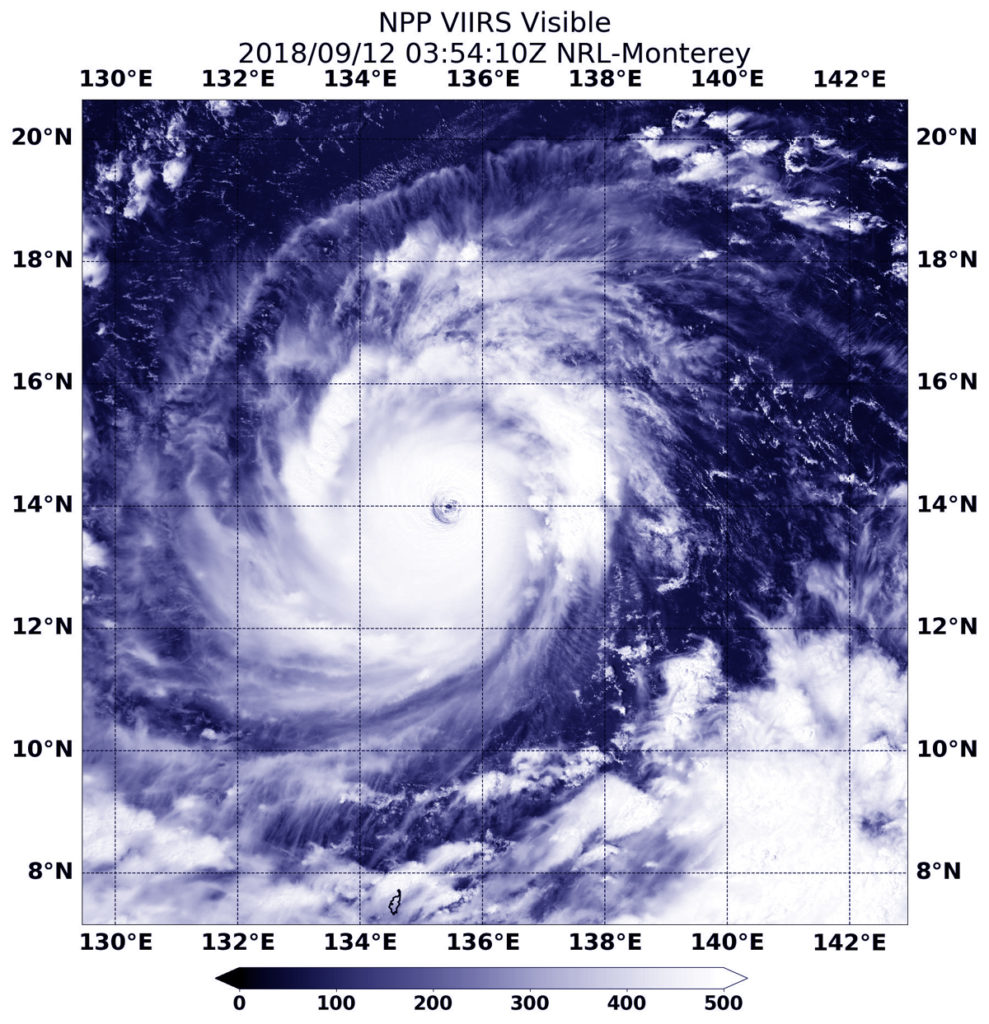
NASA-NOAA’s Suomi NPP satellite passed directly over Super Typhoon Mangkhut from space and stared down its almost 30 nautical-mile-wide eye to the waters of the Northwestern Pacific Ocean. Mangkhut is threatening the northern Philippines where is known as Ompong.
Visible imagery on Sept. 11 at 11:44 p.m. EDT (Sept. 12 at 0354 UTC) from the Visible Infrared Imaging Radiometer Suite (VIIRS) instrument aboard NASA-NOAA’s Suomi NPP satellite flew directly over Super Typhoon Mangkhut and stared into its eye. Credit: NASA/NOAA/NRL
At 10 a.m. EDT (10 p.m. local time, Philippines) on Sept. 12, the eye of Typhoon Mangkhut was located approximately 1,005 km East of Virac, Catanduanes, Philippines near 14.3 degrees north latitude and 133.5 degrees east longitude. Maximum sustained winds were near 172 mph (150 knots/277 kph).
The Philippine Atmospheric, Geophysical, and Astronomical Services Administration (PAGASA) noted that the typhoon continues to threaten Northern Luzon.
On Sept. 13 at 11 a.m. local time (11 a.m. EDT), PAGASA noted that “the province of Catanduanes and Camarines Sur will experience the peripheral effects of Mangkhut within the next day and a half, bringing occasional rains and gusty winds. Possible inclusion to Tropical Cyclone Warning Signal (TCWS) #1over the provinces of Cagayan, Isabela, Aurora, Quirino, Pollilo Islands, Camarines Norte and Albay tomorrow morning (September 13).”
Visible imagery on Sept. 12 at 11:44 p.m. EDT (Sept. 12 at 0354 UTC from the Visible Infrared Imaging Radiometer Suite (VIIRS) instrument aboard NASA-NOAA’s Suomi NPP satellite showed that Mangkhut had a clear eye that enabled the satellite to see through it all the way to the surface of the Northwestern Pacific Ocean. Mangkhut was surrounded by a thick ring of powerful, rotating thunderstorms. The Joint Typhoon Warning Center noted that satellite imagery shows a symmetric and highly consolidated system with strong, compact feeder bands (bands of thunderstorms) spiraling tightly into a sharply-outlined 29 nautical mile wide eye.
The storm is expected to make landfall in the northern tip of Cagayan on Saturday, September 15 and make a second landfall south of Hong Kong, China on Sept. 16.
Sep. 11, 2018 – NASA-NOAA Satellite Tracking Super Typhoon Mangkhut
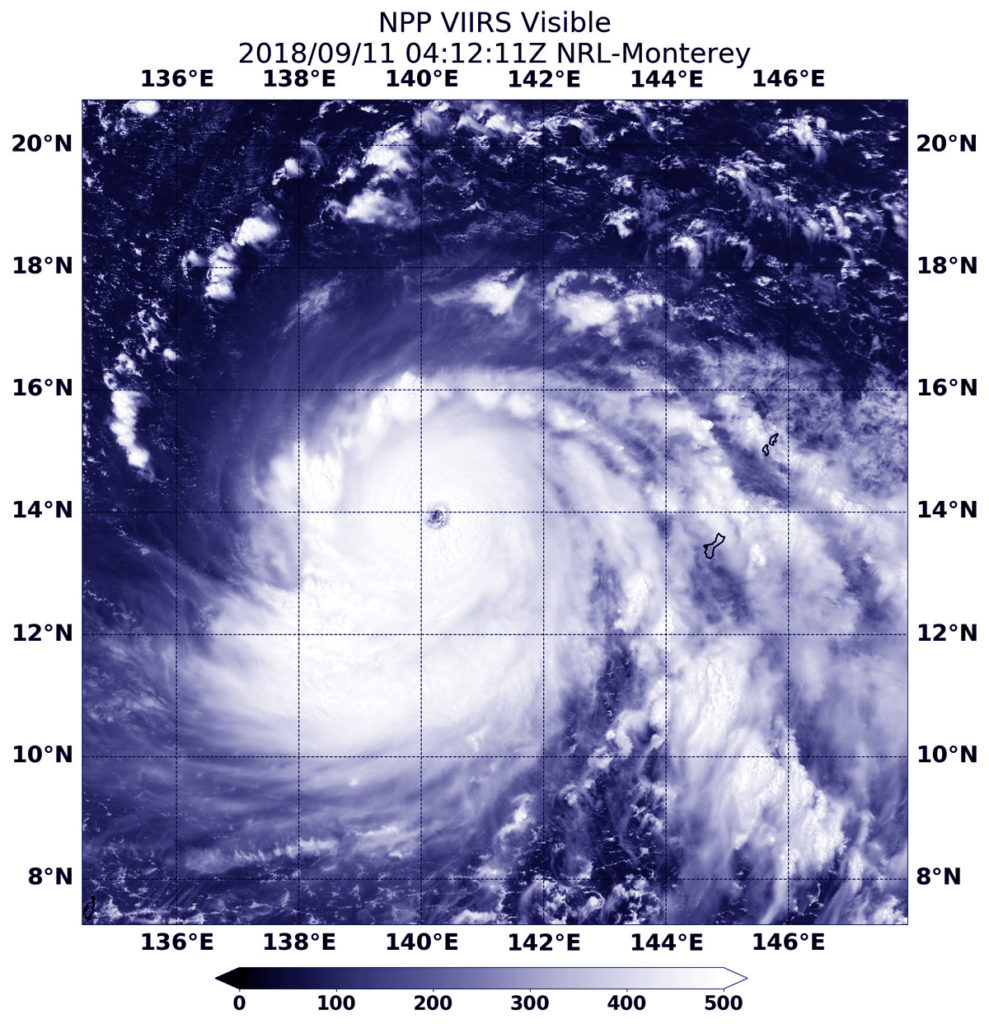
Typhoon Mangkhut had already strengthened into a Super Typhoon when NASA-NOAA’s Suomi NPP satellite grabbed a visible image of the storm in the Northwestern Pacific Ocean on Sept. 11. It is forecast to intensify even more.
On Sept. 11 at 12:12 a.m. EDT (0412 UTC) the VIIRS instrument aboard NASA-NOAA’s Suomi NPP satellite captured a visible image of Super Typhoon Mangkhut moving through the Northwestern Pacific Ocean. Credit: NOAA/NASA/NRL
Fortunately, Mangkhut has moved away from the Marianas Islands and is moving over open ocean so there are no watches or warnings in effect.
On Sept. 11 at 12:12 a.m. EDT (0412 UTC) the Visible Infrared Imaging Radiometer Suite (VIIRS) instrument aboard NASA-NOAA’s Suomi NPP satellite captured visible image of Super Typhoon Mangkhut. The image showed a clear eye surrounded by bands of powerful thunderstorms.
At 5 a.m. EDT (7 p.m. CHST/0900 UTC) on Sept. 11, the eye of Super Typhoon Mangkhut was located near latitude 14.0 degrees north and longitude 139.1 degrees east. That’s about 380 miles west of Guam. Mangkhut is moving west at 17 mph. This westward motion is expected to continue tonight, followed by a turn to the west-northwest on Wednesday and Thursday, bringing Mangkhut near northern Luzon Friday evening.
The National Weather Service in Tiyan, Guam noted that “Maximum sustained winds have increased to 155 mph, making Mangkhut a Category 4 super typhoon. Mangkhut is expected to intensify into a Category 5 super typhoon Wednesday and Thursday.”
Typhoon force winds extend up to 65 miles from the center. Tropical storm force winds extend up to 205 miles northeast of the center and up to 165 miles to the southwest.
Sep. 10, 2018 – NASA Finds Typhoon Mangkhut Lashing Guam and the Northern Marianas Islands
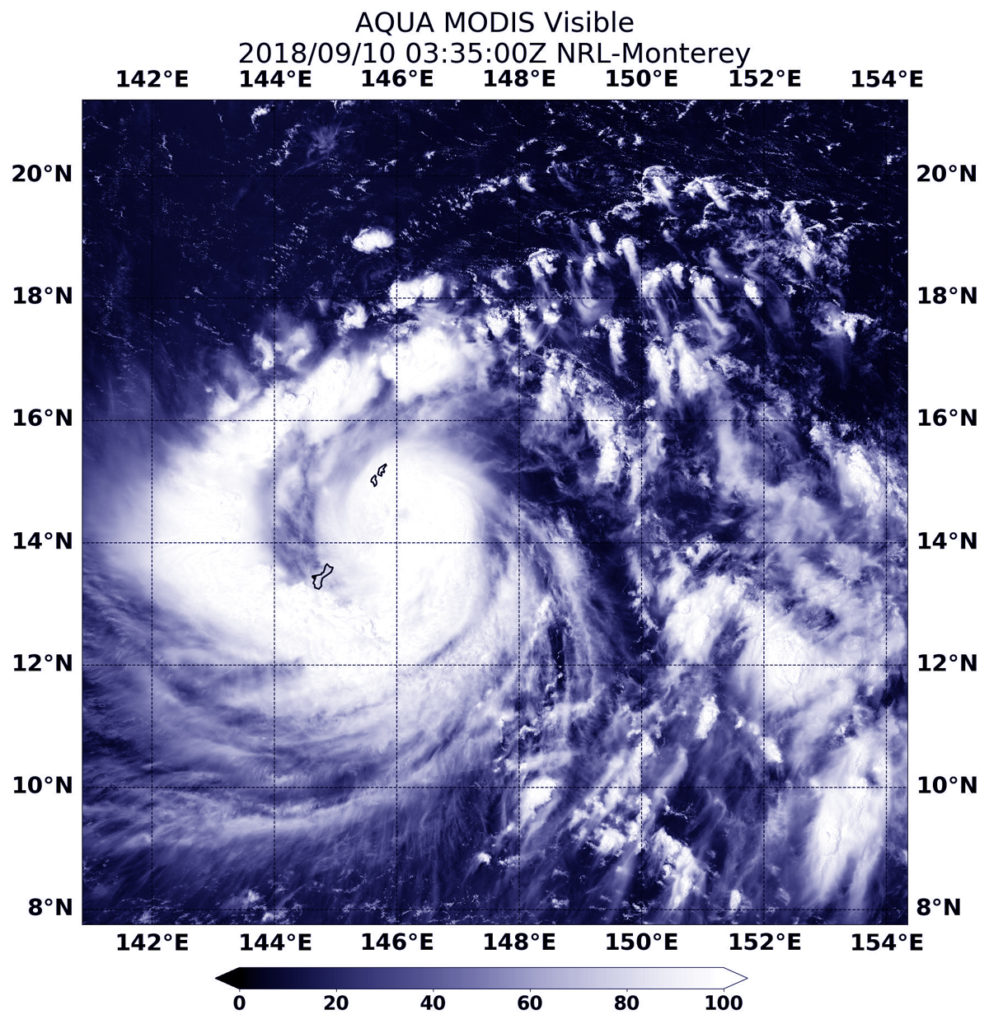
NASA’s Aqua satellite passed over the Northwestern Pacific Ocean and captured a visible image of Typhoon Mangkhut lashing Guam and the Northern Marianas Islands.
At 0335 UTC on Sept.10 (11:35 p.m. EDT on Sept. 9) the MODIS instrument aboard NASA’s Aqua satellite looked at Typhoon Mangkhut over the Marianas Islands in visible light. Credit: NASA/NRL
On Sept. 7 when Mangkhut formed as a tropical depression it was known as Tropical Depression 26W. On the day it formed, a tropical storm watch was posted for Enewetak. 26W then moved west toward Micronesia and strengthened into a typhoon.
On Sept. 10, the National Weather Service (NWS) in Tiyan, Guam said a Typhoon Warning remains in effect for Guam, Rota, Tinian, Saipan and adjacent coastal waters in the Mariana Islands. Guam is a U.S. island territory in Micronesia.
At 0335 UTC on Sept.10 (11:35 p.m. EDT on Sept. 9) the Moderate Resolution Imaging Spectroradiometer or MODIS instrument aboard NASA’s Aqua satellite provided a visible image of Typhoon Mangkhut. Satellite imagery shows the center over the Northern Mariana Islands and a thick band of thunderstorms wrapping from south of the center to the west past Guam.
At 5 a.m. EDT on Sept. 10 (7 p.m. CHST local time), the NWS in Guam noted that “Damaging or destructive winds are now occurring. Damaging south winds of up to 105 mph with gusts to 120 mph will continue for the next few hours. Winds will gradually decrease to between 55 and 65 mph around midnight. Damaging south winds early Tuesday morning will decrease to 25 to 35 mph by the afternoon. Small craft should remain in port and well secured.”
At 11 a.m. EDT (1 a.m. CHST/1500 UTC) the center of Typhoon Mangkhut was located near Latitude 14.1 degrees north and longitude 143.5 degrees east. That’s about 95 miles west-northwest of Guam, 115 miles west of Rota, 155 miles west-southwest of Tinian and about 165 miles west-southwest of Saipan.
Typhoon Mangkhut is moving toward the west at 17 mph. It is expected to make a slight turn to the west-northwest with a decrease in forward speed over the next few days.Maximum sustained winds remain at 115 mph. Typhoon Mangkhut (26W) is forecast to intensify through Wednesday, Sept 12.
Typhoon force winds extend outward from the center up to 50 miles. Tropical storm force winds extend outward from the center up to 180 miles to the north and up to 120 miles to the south.
Mangkhut is forecast to move on a westerly track and move away from Guam and the Marianas while strengthening.
Sep. 12, 2018 – NASA Sees Paul Become a Remnant Low Pressure Area
Former Tropical Storm Paul lost its strength and appeared as a swirl of clouds on infrared imagery from NASA.
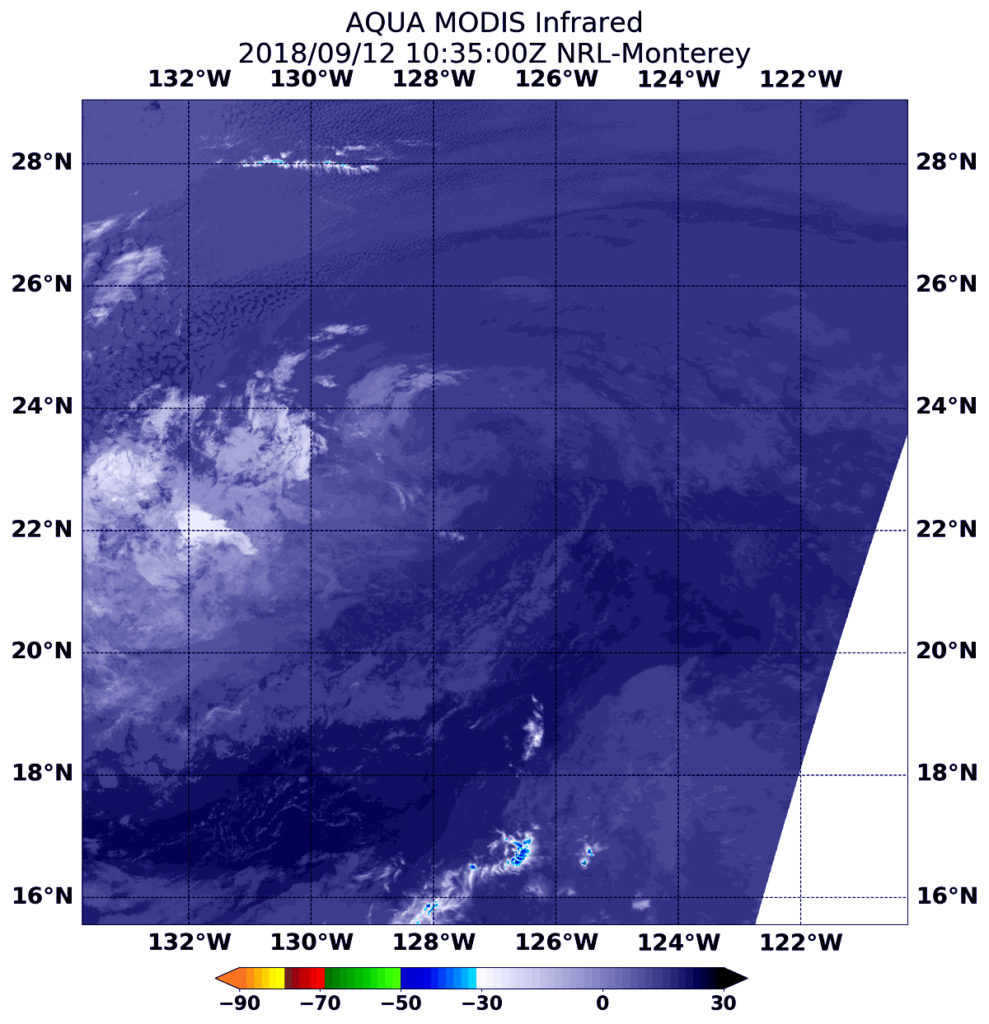
NASA’s Aqua satellite found Tropical Depression Paul a swirl of clouds when it passed overhead on Sept. 12 at 6:35 a.m. EDT (1035 UTC). Credit: NASA/NRL
At 5 a.m. EDT on Sept. 12, the National Hurricane Center noted that Paul has lacked organized deep convection (rising air that creates the thunderstorms that make up a tropical cyclone) for over 12 hours and had become a remnant low pressure area about 1,115 miles (1,795 km) west of the southern tip of Baja California, Mexico.
The center of Post-Tropical Cyclone Paul was located near latitude 22.3 degrees north and longitude 127.4 degrees west. Paul is moving toward the west near 9 mph (15 kph), and this general heading with a decrease in forward speed is expected for the next day or two. Maximum sustained winds are near 35 mph (55 kph) with higher gusts.
For the first time since August 14, the northeast Pacific has no tropical cyclones.
NASA’s Aqua satellite passed Paul on Sept. 12 at 6:35 a.m. EDT (1035 UTC) and the Moderate Resolution Imaging Spectroradiometer or MODIS instrument and saw the remnants devoid of rainfall. Paul looked like a ghostly swirl of clouds in infrared imagery. Wind shear was clearly affecting the system as the bulk of clouds were pushed west and southwest of the center.
The remnant low is expected to gradually weaken over the next several days.
Sep. 11, 2018 – NASA Sees Tropical Depression Paul’s Strength Sapped
NASA’s Aqua satellite provided an infrared look at Tropical Depression Paul and found its center pushed away from strongest storms.
At 5:50 a.m. EDT (0950 UTC) on Sept. 11, the MODIS instrument aboard NASA’s Aqua satellite looked at Tropical Depression Paul infrared light. MODIS found a small area of coldest cloud tops (red) had temperatures near minus 70 degrees Fahrenheit (minus 56.6 degrees Celsius). Credit: NASA/NRL
At 5:50 a.m. EDT (0950 UTC) on Sept. 11, from the Moderate Resolution Imaging Spectroradiometer or MODIS instrument aboard NASA’s Aqua satellite revealed a small area of strongest storms in Paul. Those storms, pushed west of the center of circulation, had cloud tops with temperatures near minus 70 degrees Fahrenheit (minus 56.6 degrees Celsius). NASA research has found that cloud top temperatures that cold have the capability to generate heavy rainfall.
NOAA’s National Hurricane Center (NHC) said “The center of Paul remains to the east of a small area of deep convection.”
At 8 a.m. EDT (1500 UTC), the center of Tropical Depression Paul was located near latitude 22.3 North, longitude 124.1 West. Paul is far from land areas so there are no warnings or watches in effect. It is centered about 905 miles (1,460 km) west of the southern tip of Baja California, Mexico.
The depression is moving toward the west-northwest near 12 mph (19 kph). A gradual turn toward the west and a decrease in forward speed is anticipated over the next few days.
Maximum sustained winds remain near 35 mph (55 kph) with higher gusts. Slow weakening is anticipated as Paul moves into a stable, drier air mass and over cooler sea surface temperatures. Paul is expected to weaken into a remnant low on Wednesday, Sept. 12.
Sep. 10, 2018 – NASA Finds Wind Shear Affecting Tropical Storm Paul
Infrared imagery from NASA’s Aqua satellite showed that newly developed tropical storm Paul in the Eastern Pacific is dealing with wind shear.
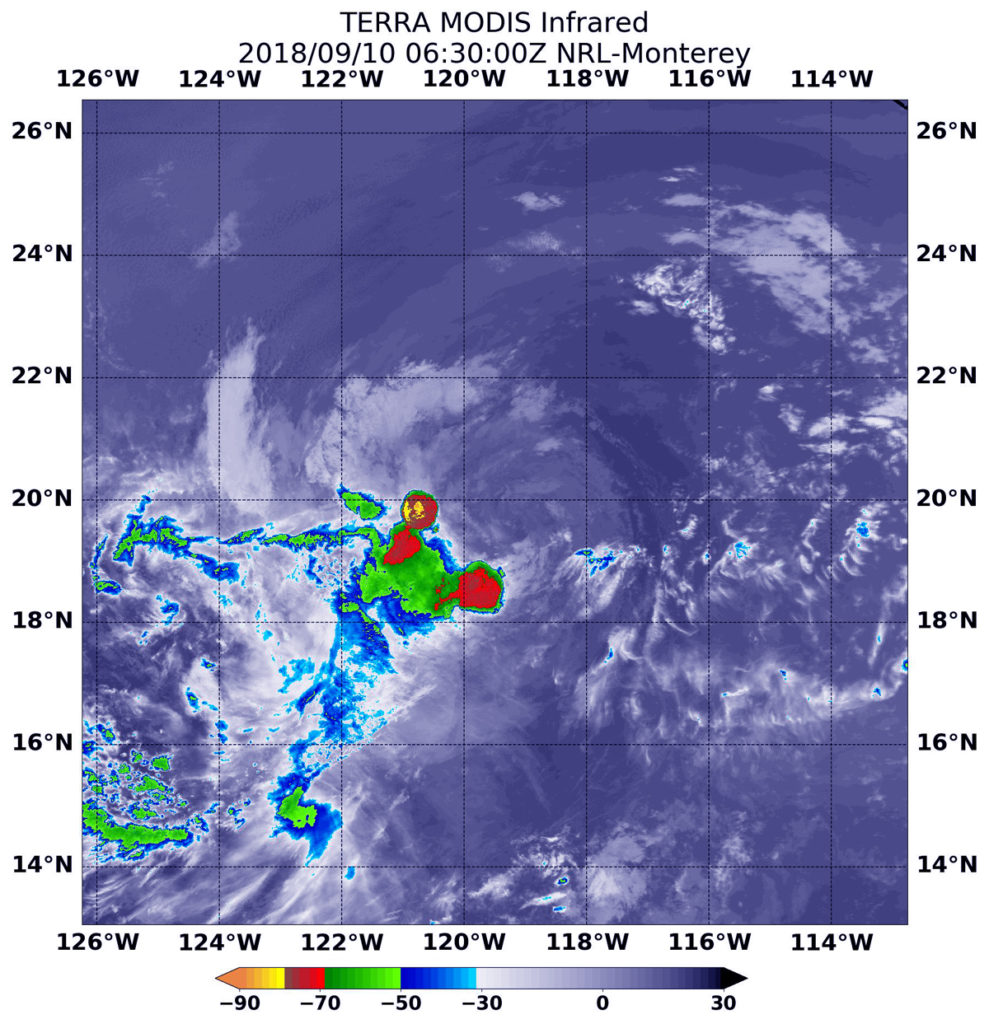
At 2:30 a.m. EDT (0630 UTC) on Sept. 10, the MODIS instrument aboard NASA’s Aqua satellite looked at Tropical Storm Paul in infrared light. MODIS found coldest cloud tops (red) had temperatures near minus 70 degrees Fahrenheit (minus 56.6 degrees Celsius) were pushed southwest of the center from wind shear. Credit: NASA/NRL
Tropical Depression 18E formed on Saturday, Sept. 8 at 11 a.m. EDT and strengthened in a tropical storm on Sept. 9.
Infrared satellite data at 2:30 a.m. EDT (0630 UTC) on Sept. 10 from the Moderate Resolution Imaging Spectroradiometer or MODIS instrument aboard NASA’s Aqua satellite revealed the strongest storms in Tropical Storm Paul were displaced from the center.
MODIS found coldest cloud tops had temperatures near minus 70 degrees Fahrenheit (minus 56.6 degrees Celsius) being pushed southwest of the center from northeasterly vertical wind shear. NASA research has found that cloud top temperatures that cold have the capability to generate heavy rainfall.
The National Hurricane Center noted “Paul continues to have its low-level center displaced on the northeast side of the main area of deep convection. This convection is not well organized and there is little or no evidence of banding features.”
At 11 a.m. EDT (1500 UTC) on Sept. 10 the The National Hurricane Center of NHC noted the center of Tropical Storm Paul was far from land and located near latitude 20.8 degrees north and longitude 120.7 degrees west. That’s about 705 miles (1,140 km) west of the southern tip of Baja California, Mexico. Paul is moving toward the northwest near 10 mph (17 km/h), and a turn toward the west-northwest is expected by tonight. Maximum sustained winds are near 40 mph (65 kph) with higher gusts. Weakening is forecast, and Paul is expected to become a remnant low in a few days.
Sep. 17, 2018 – NASA Sees Post-Tropical Cyclone Helene Affecting Ireland, United Kingdom
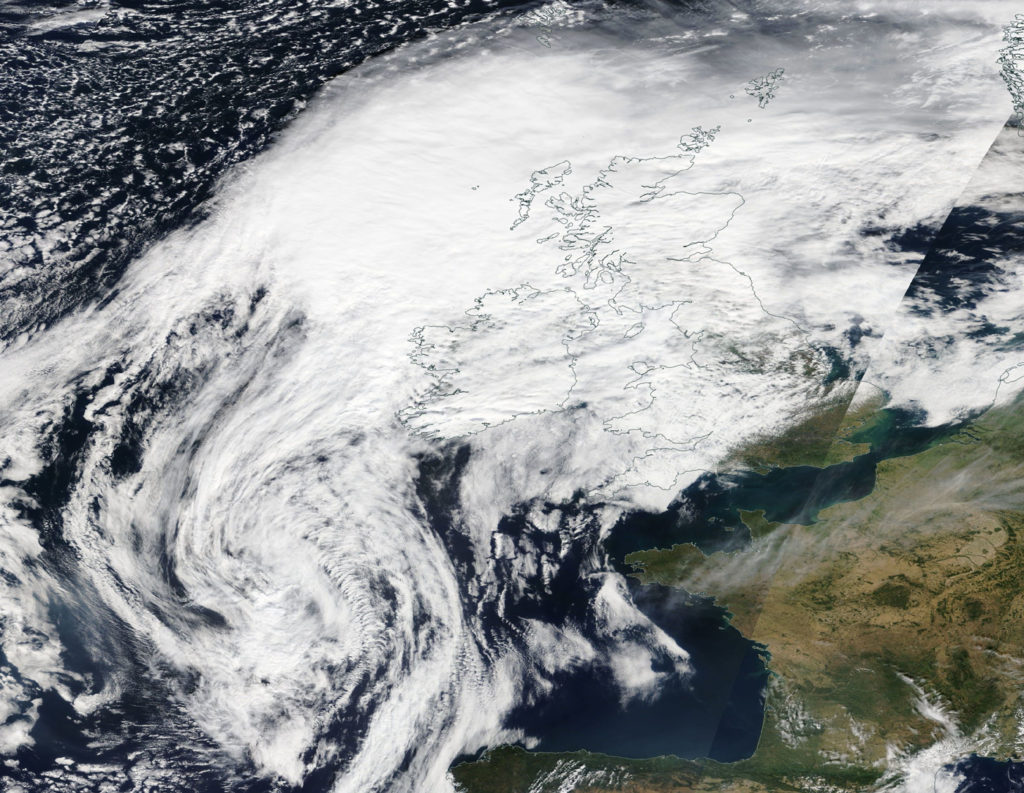
Post-tropical cyclone Helene developed off the west coast of Africa and moved north then northeast where it is now raining on parts of Ireland and the United Kingdom. Clouds and rainfall connected to Helene are already affecting those countries.
On Sept. 17, the MODIS instrument aboard Aqua captured a visible image of Post-Tropical Cyclone Helene just southwest of Ireland and the United Kingdom. Clouds ahead of the system have already blanketed those countries. Credit: NASA Worldview, Earth Observing System Data and Information System (EOSDIS).
Early on Sept. 17, the Moderate Resolution Imaging Spectroradiometer or MODIS instrument aboard Aqua captured a visible image of Post Tropical Cyclone Helene southwest of Ireland and the United Kingdom (U.K.). The MODIS image showed a large system with a wide band of clouds and showers extending to the northeast over Ireland and the U.K.
There is a Yellow Alert for the U.K. regions of: Central, Tayside & Fife, East Midlands, East of England, Grampian, Highlands & Eilean Siar, North East England, North West England, Northern Ireland, Orkney & Shetland, SW Scotland, Lothian Borders, South West England, Strathclyde, Wales, West Midlands, Yorkshire & Humber.
The U.K. Meteorological Service noted that the Yellow Alert means “a spell of very windy weather is expected. Gusts of 50-60 mph are possible inland between [1 a.m. and 5 p.m. local time on Wed., Sept. 19].”
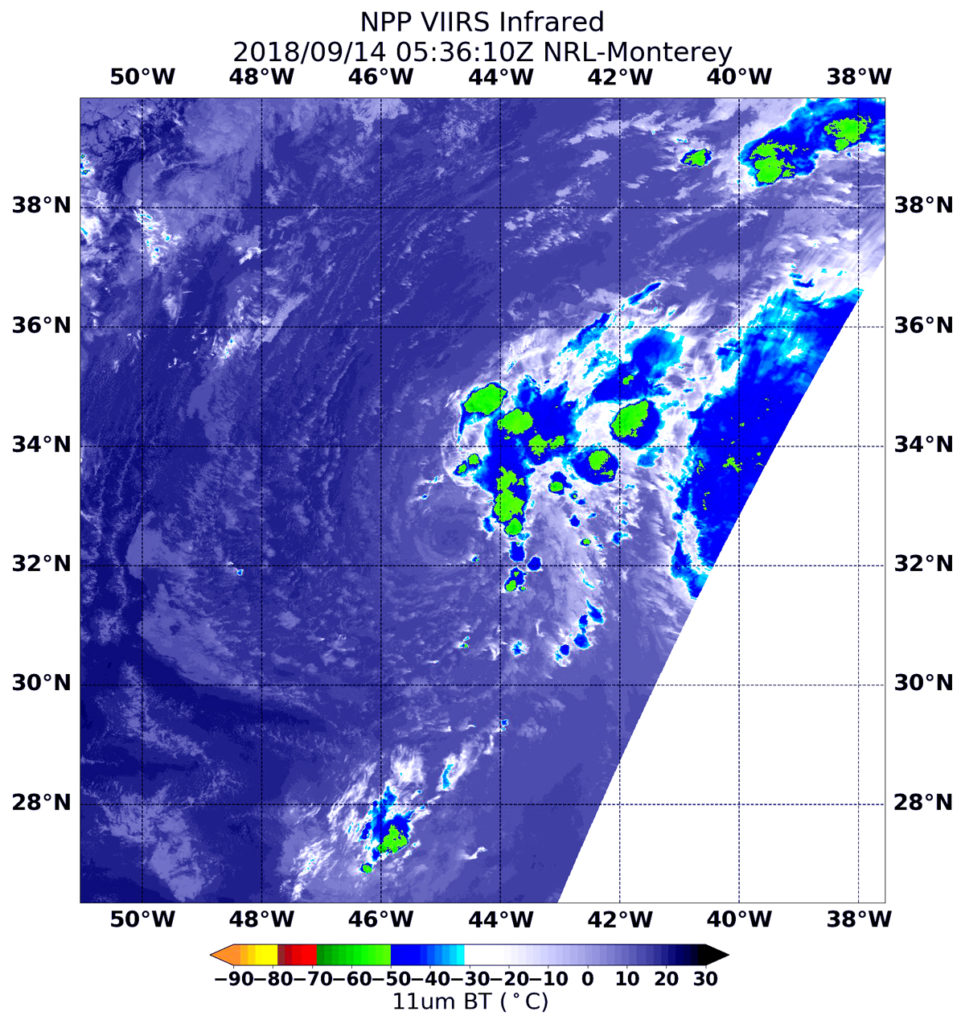
Tropical Storm Helene may be battling wind shear but it’s caused a Tropical Storm Warning for all of the Azores Islands on Sept. 15. NASA-NOAA’s Suomi NPP satellite passed over the eastern Atlantic Ocean and analyzed the storm.
On Sept. 14 at 0354 UTC (Sept. 13 at 11:54 p.m. EDT) the VIIRS instrument aboard NASA-NOAA’s Suomi NPP satellite captured an infrared image of Tropical Storm Helene. Coldest cloud top temperatures (yellow) of strongest thunderstorms were as cold as minus 50F/minus 45.5C, pushed northeast of the center. Credit: NOAA/NASA/NRL
Southwesterly shear continues to affect now Tropical Storm Helene as it nears the Azores. In general, wind shear is a measure of how the speed and direction of winds change with altitude. Winds at different levels of the atmosphere pushed against the cylindrical circulation center and skewed it, weakening the rotation.
On Sept. 14 at 1:36 a.m. EDT (0536 UTC) the Visible Infrared Imaging Radiometer Suite (VIIRS) instrument aboard NASA-NOAA’s Suomi NPP satellite captured an infrared image of Tropical Storm Helene. VIIRS showed wind shear was pushing all of the strongest storms northeast of center. In that quadrant of the storm, the coldest cloud top temperatures of strongest thunderstorms were as cold as minus 50 degrees Fahrenheit/minus 45.5 degrees Celsius.
The National Hurricane Center or NHC said “at 11 a.m. EDT (1500 UTC) the center of Tropical Storm Helene was located near latitude 32.9 degrees north and longitude 36.3 degrees west. Helene is moving toward the north near 23 mph (37 kph). A turn toward the north-northeast is forecast Saturday followed by a turn toward the northeast by Sunday night.
Satellite data indicate that maximum sustained winds have increased to near 70 mph (110 kph) with higher gusts. Little change in strength is forecast during the next 24 hours. Afterward, gradual weakening is expected over the weekend as Helene makes the transition to a post-tropical extratropical cyclone.
On the forecast track, Helene will pass near or over the Azores late Saturday, Sept. 15 or Sunday, Sept. 16.
Helene is expected to produce total rainfall amounts of 2 to 4 inches across the Azores, with isolated amounts up to 8 inches across the western Azores. This rainfall may cause life-threatening flash flooding. Ocean swells generated by Helene are affecting portions of the Azores. These swells are likely to cause life-threatening surf and rip current conditions.
Interests in the Ireland and United Kingdom should consult products from their local meteorological service for information about potential impacts from Helene in those locations.
Local forecasts and warnings for the U.K. can be found on the website of the UK Met Office at https://www.metoffice.gov.uk/.
Local forecasts and warnings for Ireland can be found on the website of Met Eireann at https://www.met.ie/.
Sep. 13, 2018 – NASA Sees Hurricane Helene Decoupled By Wind Shear
NASA’s Aqua satellite provided an infrared look at Helene as it continued tracking toward the Azores Islands in the Eastern Atlantic Ocean. Satellite imagery shows that Helene is decoupled from wind shear.
NASA’s Aqua satellite passed over Hurricane Helene on Sept. 13 at 12:45 a.m. EDT (0445 UTC) and analyzed it in infrared light. Strongest storms with coldest cloud tops appeared in red. Credit: NASA/NRL
The National Hurricane Center or NHC said “Helene’s surface circulation has become fully exposed this morning with the center decoupled about 110 miles south of edge of the remaining deep convection.” That means that the circulation or center of the storm is off-center, and the bulk of the storm has been pushed away from the rotating center. That decoupling happened because Helene is dealing with southwesterly (coming from the southwest) vertical wind shear. NHC noted that the wind shear is expected to increase later on Sept. 13.
What is Wind Shear?
In general, wind shear is a measure of how the speed and direction of winds change with altitude. Wind shear can tear a tropical cyclone apart or weaken it.
NASA’s Infrared View of Helene
NASA’s Aqua satellite passed over Hurricane Helene on Sept. 13 at 12:45 a.m. EDT (0445 UTC) and the Moderate Resolution Imaging Spectroradiometer or MODIS instrument aboard analyzed cloud top temperatures in infrared light. Coldest cloud top temperatures were being pushed northeast of center and were as cold as or colder than minus 70 degrees Fahrenheit (minus 56.6 Celsius). Cloud top temperatures that cold indicate strong storms that have the capability to create heavy rain.
Helene’s Status on Sept. 13, 2018
At 5 a.m. EDT (0900 UTC), the center of Hurricane Helene was located near latitude 23.5 degrees north and longitude 37.3 degrees west. Helene is currently about 1,170 miles (1,885 km) miles southwest of the Azores. Helene is moving toward the north near 14 mph (22 kph). A turn toward the north-northeast with an increase in forward speed is expected tonight followed by a turn toward the northeast over the weekend of Sept 15 and 16.
Maximum sustained winds have decreased to near 75 mph (120 kph) with higher gusts. Continued weakening is forecast over the next couple of days, and Helene is expected to become a tropical storm by tonight.
Heads Up to the Azores
On Sept. 13, Helene is weakening while moving northward over the eastern Atlantic and interests in the Azores should monitor the progress of the storm.
Sep. 12, 2018 – NASA Looks at Hurricane Helene’s Water Vapor Concentration
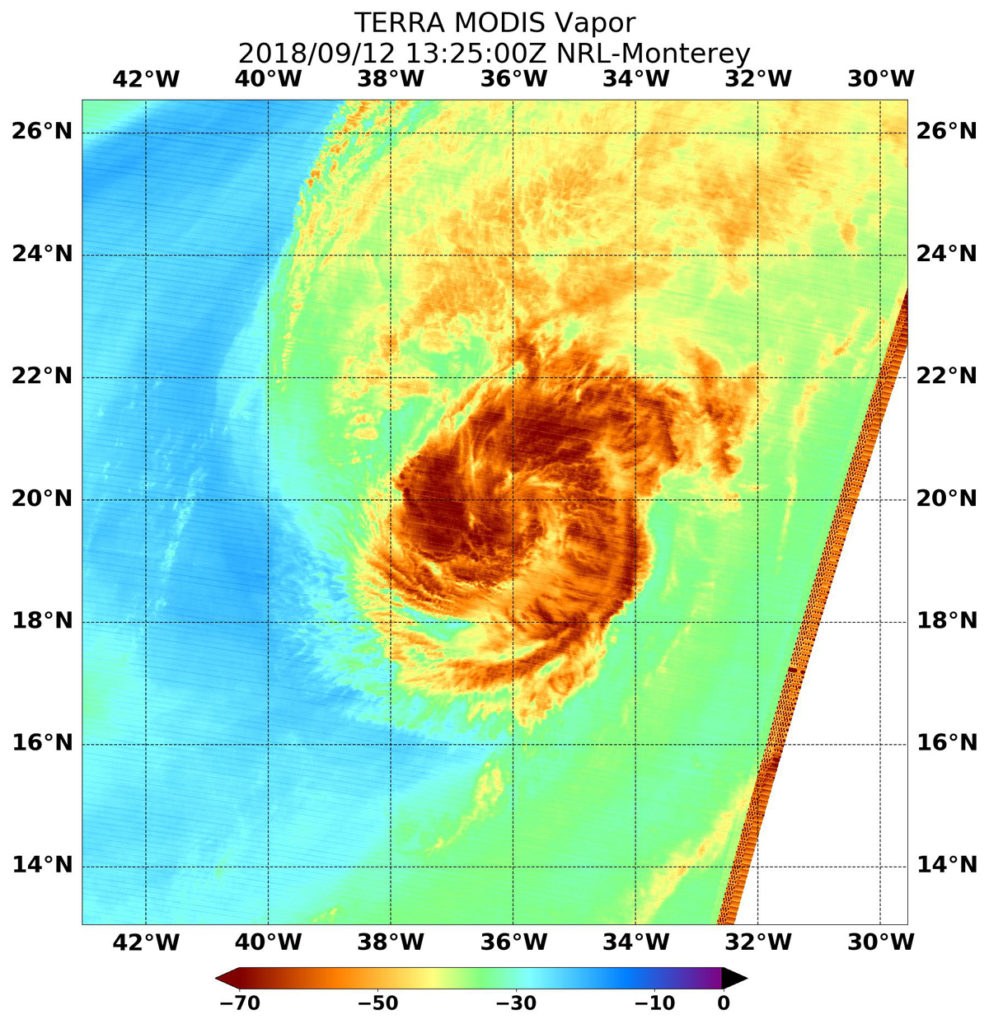
When NASA’s Terra satellite passed over the Eastern Atlantic Ocean on Sept. 12 it analyzed water vapor within Hurricane Helene.
NASA’s Terra satellite passed over Hurricane Helene on Sept. 12 at 9:25 a.m. EDT (1325 UTC) and highest concentrations of water vapor (brown) and coldest cloud top temperatures were around the center and a band of thunderstorms spiraling in from the east. Credits: NASA/NRL
NASA’s Terra satellite passed Hurricane Helene on Sept. 12 at 9:25 a.m. EDT (1325 UTC) and the Moderate Resolution Imaging Spectroradiometer or MODIS instrument gathered water vapor content and temperature information. The MODIS image showed highest concentrations of water vapor and coldest cloud top temperatures were around the center and a band of thunderstorms spiraling in from the east. The MODIS image also showed that the eye has become less distinct, although the storm remains well organized and symmetric.
MODIS saw coldest cloud top temperatures were as cold as minus 70 degrees Fahrenheit (minus 56.6 degrees Celsius) in those areas. Storms with cloud top temperatures that cold have the capability to produce heavy rainfall.
Water vapor analysis of tropical cyclones tells forecasters how much potential a storm has to develop. Water vapor releases latent heat as it condenses into liquid. That liquid becomes clouds and thunderstorms that make up a tropical cyclone. Temperature is important when trying to understand how strong storms can be. The higher the cloud tops, the colder and the stronger they are.
At 11 a.m. EDT (1500 UTC), the eye of Hurricane Helene was located near latitude 20.3 degrees north and longitude 36.5 degrees west. Helen is 1,350 miles (2,170 km) south-southwest of the Azores Islands.
Helene is moving toward the north-northwest near 14 mph (22 kph). A turn toward the north and northeast with an increase in forward speed is expected during the next few days. Maximum sustained winds remain near 90 mph (150 kph) with higher gusts. Gradual weakening is forecast over the next couple of days, and Helene is expected to become a tropical storm on Thursday, Sept. 13.
NHC said that Helene forecast to weaken over the eastern Atlantic and that interests in the Azores Islands should monitor the progress of Helene.
Sep. 11, 2018 – NASA-NOAA’s Suomi NPP Satellite Stares Helene in the Eye
NASA-NOAA’s Suomi NPP satellite passed over the eye of Hurricane Helene in the eastern Atlantic.
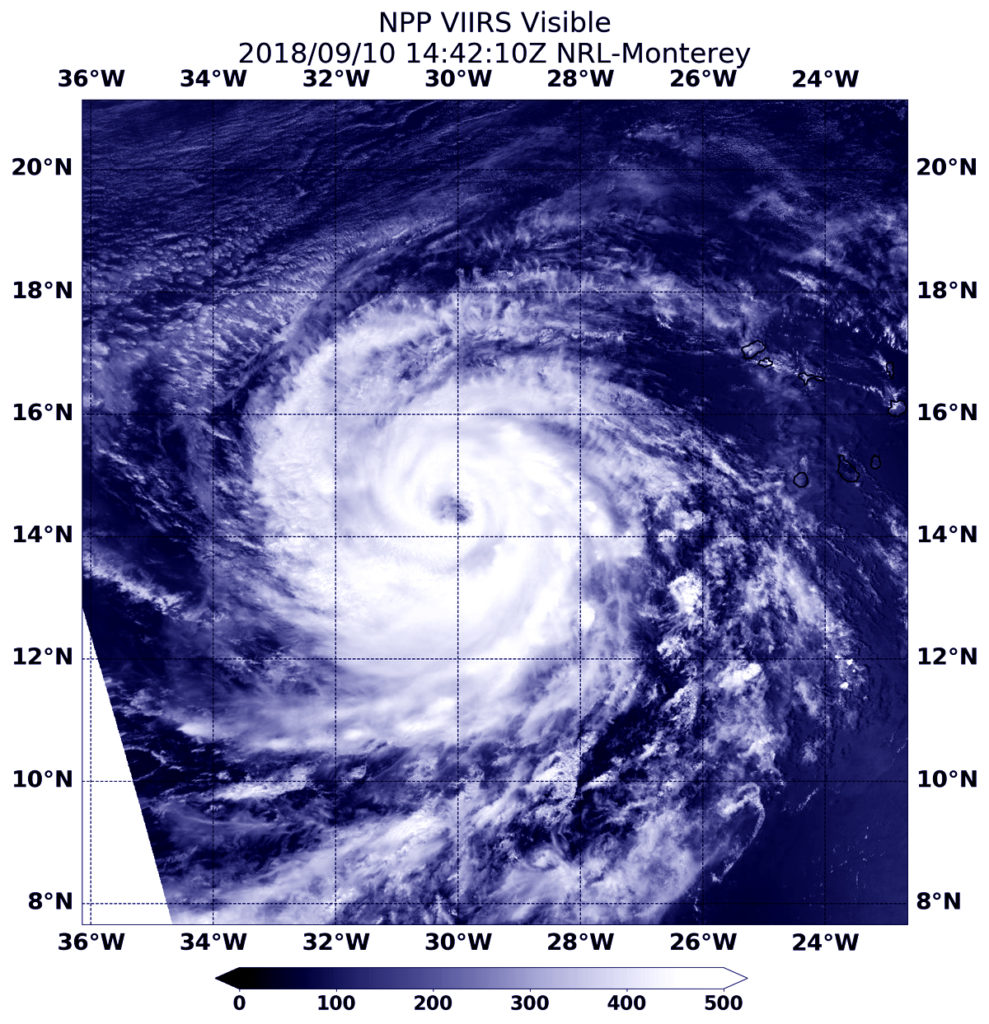
On Sept. 10 at 10:42 a.m. EDT (1442 UTC) the VIIRS instrument aboard NASA-NOAA’s Suomi NPP satellite captured a visible image of Hurricane Helene. Credit: NOAA/NASA/NRL
On Sept. 10 at 10:42 a.m. EDT (1442 UTC) the Visible Infrared Imaging Radiometer Suite (VIIRS) instrument aboard NASA-NOAA’s Suomi NPP satellite captured visible image of Hurricane Helene. VIIRS imagery showed the eye was about 20 nautical miles wide.
The next day, Sept. 11, NOAA’s National Hurricane Center noted another satellite image of Helene showed a well-developed closed eyewall and strong band of thunderstorms with cold cloud tops of minus 104 degrees Fahrenheit/minus 76 degrees Celsius (indicating very strong storms) wrapping around the south through east quadrants of the cyclone.
At 5 a.m. EDT (0900 UTC), on Sept. 11 the center of Hurricane Helene was located near latitude 16.0 degrees north and longitude 33.6 degrees west. That’s about 620 miles (995 km) west of the southernmost Cabo Verde Islands and about 1,570 miles (2,530 km) south-southwest of the Azores Islands.
Maximum sustained winds are near 110 mph (175 kph) with higher gusts. Some strengthening is possible during the next 12 hours, but a gradual weakening trend is expected after that time.
Helene is moving toward the west-northwest near 14 mph (22 kph), and this motion is expected to continue with a decrease in forward speed through tonight. A turn toward the northwest and then north-northwest is forecast on Wednesday, Sept. 12 and Thursday, Sept. 13.
Sep. 10, 2018 – NASA Sees an Organized Hurricane Helene near Africa
Visible image from NASA’s Aqua satellite showed that newly developed Hurricane Helene had strengthened and organized quickly.
On Sept. 10, the MODIS instrument aboard NASA’s Aqua satellite looked at Hurricane Helene in the far Eastern Atlantic Ocean. Credit: NASA Worldview, Earth Observing System Data and Information System (EOSDIS)
Tropical Depression 8 formed on Sept. 7 at 11 a.m. EDT and strengthened in a tropical storm on by 11 p.m. EDT that day. When it became a tropical storm it was re-named Helene.
On Sept. 10 from the Moderate Resolution Imaging Spectroradiometer or MODIS instrument aboard NASA’s Aqua satellite showed an organized storm with a thick band of powerful thunderstorms circling the eye.
The National Hurricane Center noted at 11 a.m. EDT on Sept. 10, “Helene’s cloud pattern has become much better organized during the past few hours, with a clear 20 nautical miles wide eye seen in Meteosat infrared imagery.
At 11 a.m. EDT (1500 UTC) on Sept. 10 the National Hurricane Center of NHC noted the eye of Hurricane Helene was located near latitude 14.6 degrees north and longitude 30.0 degrees west. It was located about 375 miles (600 km) west of the southernmost Cabo Verde Islands so there are no watches or warnings in effect.
Helene is moving toward the west-northwest near 16 mph (26 kph). A west-northwestward motion with a decrease in forward speed is expected through late Tuesday, followed by a turn toward the northwest and then toward the north-northwest on Wednesday and Thursday. Maximum sustained winds have increased to near 105 mph (165 kph) with higher gusts.
Some additional strengthening is expected today, and Helene is forecast to become a major hurricane by tonight. Steady weakening is forecast to begin by late Tuesday.
NASA-NOAA’s Suomi NPP satellite passed over tropical cyclone Isaac in the eastern Caribbean Sea and it has weakened to a depression as a result of being hammered by vertical wind shear.
On Sept. 14 at 1:36 a.m. EDT (0536 UTC) the VIIRS instrument aboard NASA-NOAA’s Suomi NPP satellite captured an infrared image of Tropical Depression Isaac in the eastern Caribbean Sea. Coldest cloud top temperatures (red) of strongest thunderstorms were as cold as minus 70F/minus 56.6C. Credit: NOAA/NASA/NRL
Northwesterly shear continues to take a toll on Isaac. In general, wind shear is a measure of how the speed and direction of winds change with altitude. Winds at different levels of the atmosphere pushed against the cylindrical circulation center and skewed it, weakening the rotation.
On Sept. 14 at 1:36 a.m. EDT (0536 UTC) the Visible Infrared Imaging Radiometer Suite (VIIRS) instrument aboard NASA-NOAA’s Suomi NPP satellite captured an infrared image of Tropical Depression Isaac in the eastern Caribbean Sea. VIIRS showed wind shear was tearing the storm apart. The coldest cloud top temperatures of strongest thunderstorms were as cold as minus 70 degrees Fahrenheit/minus 56.6 degrees Celsius and were limited to one area of the storm.
The National Hurricane Center or NHC said “Although the system is still producing areas of deep convection, [satellite imagery] indicated that the circulation had become even less defined.
Moderate to strong northwesterly shear and dry mid-level air are likely to cause additional weakening, and Isaac is forecast to degenerate into an open wave within the next several days, but this could occur much sooner if the current trends continue.”
At 5 a.m. EDT (0900 UTC), the center of Tropical Depression Isaac was located near latitude 15.0 degrees north and longitude 65.5 degrees west. That’s about 190 miles (310 km) south-southwest of St. Croix. The depression is moving toward the west near 15 mph (24 kph), and this general motion with some decrease in forward speed is expected over the next few days. Maximum sustained winds have decreased to near 35 mph (55 kph) with higher gusts. Isaac is forecast to gradually weaken over the next few days, and could degenerate into a tropical wave at any time.
On the forecast track, Isaac will move over the eastern and central Caribbean Sea during the next few days.
Sep. 13, 2018 – NASA-NOAA Satellite Finds Wind Shear Pushing on Tropical Storm Isaac’s Center
Wind shear seems to be affecting several storms in the Atlantic Ocean today, Sept. 13, 2018. Wind shear is affecting Hurricane Helene in the Eastern Atlantic and in the Western Atlantic, Hurricane Florence and even Tropical Storm Isaac are feeling its effects.
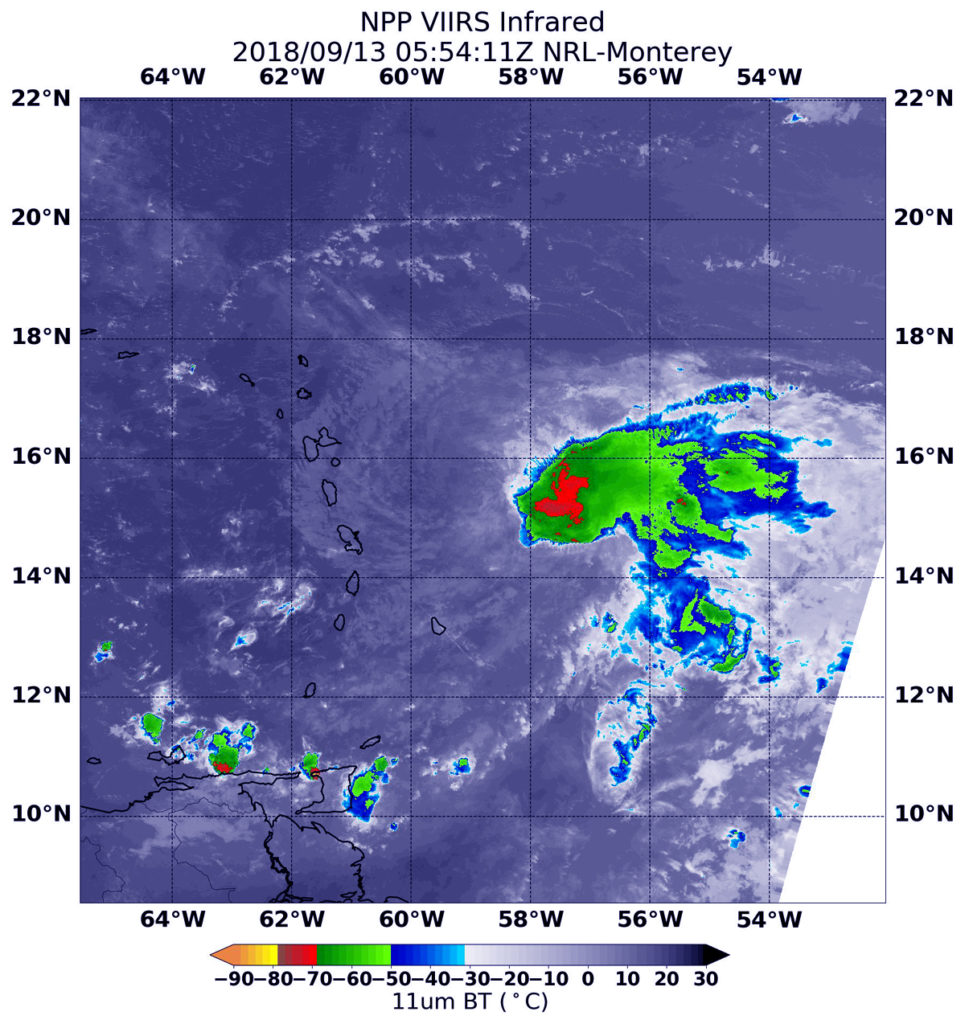
At 1:54 a.m. EDT (0554 UTC) on Sept. 13, the VIIRS instrument aboard NASA-NOAA’s Suomi NPP satellite looked at Tropical Storm Isaac in infrared light. VIIRS found coldest cloud top temperatures off-center as cold as or colder than 70 degrees (red) Fahrenheit (minus 56.6 degrees Celsius). Credit: NASA/NRL
NASA-NOAA’s Suomi NPP satellite provided an infrared look at Tropical Storm Isaac that revealed its circulation center was displaced from the bulk of clouds and precipitation. That’s an indication that wind shear is affecting the storm.
What is Vertical Wind Shear?
In general, wind shear is a measure of how the speed and direction of winds change with altitude. In order to understand how it affects a tropical cyclone or hurricane, think of a tropical cyclone as a series of vertically stacked tires, all rotating. As you go up from the ground, each tire represents the rotation of the storm’s center at a higher level in the atmosphere. The different levels of rotating winds in the center of tropical cyclones need to be stacked on top each other to strengthen. If there are winds higher up that push some of the tires askew near the top, it affects the balance and rotation of the tires below. That’s what happens when vertical wind shear pushes against a storm. It pushes the center and weakens (or wobbles) the rotation of all of the tires.
The Satellite Data Reveal
The National Hurricane Center or NHC noted “Satellite imagery indicate that Isaac remains a poorly organized tropical cyclone, with the low-level center mostly exposed during the early morning hours.” Isaac is being battered by strong vertical wind shear.
At 1:54 a.m. EDT (0554 UTC) on Sept. 13, the Visible Infrared Imaging Radiometer Suite (VIIRS) instrument aboard NASA-NOAA’s Suomi NPP satellite analyzed Tropical Storm Isaac in infrared light. VIIRS found a small area of coldest cloud top temperatures off-center were as cold as or colder than minus 70 degrees Fahrenheit (minus 56.6 degrees Celsius).
NASA research has found that cloud top temperatures as cold as or colder than the 70F/56.6C threshold have the capability to generate heavy rainfall.
At 8 a.m. EDT (1200 UTC) radiosonde data from the eastern Caribbean and NOAA Hurricane Hunter aircraft data indicate that the circulation of Isaac is fairly shallow and small. It is entirely possible that Isaac will degenerate into a tropical wave during the next day or two due to the continued effects of strong wind shear.
Warnings and Watches on Sept. 13
A Tropical Storm Warning is in effect for Martinique, Dominica and Guadeloupe. Tropical Storm Watch is in effect for Antigua, Barbuda, Montserrat, St. Kitts and Nevis, Saba and St. Eustatius, St. Martin and St. Maarten.
Isaac’s Stats on September 13, 2018
At 8 a.m. EDT (1200 UTC), the center of Tropical Storm Isaac was located near latitude 15.2 degrees north and longitude 60.9 degrees west. Isaac is moving faster toward the west near 21 mph (33 km/h). This general motion is forecast to continue today with a decrease in forward speed over the Caribbean Sea. Maximum sustained winds remain near 45 mph (75 kph) with higher gusts. Little change in strength is expected over the next several hours as Isaac moves through the Leeward Islands. Gradual weakening is forecast after that as Isaac moves through the eastern Caribbean.
Rainfall Anticipated in Leeward and Windward Islands
NHC said Tropical Storm Isaac is expected to produce total rainfall accumulations of 2 to 4 inches with isolated amounts up to 6 inches across Martinique, Dominica, and Guadeloupe, especially over elevated terrain. Rainfall of 0.5 to 1.5 inches with isolated amounts to 3 inches are forecast across Puerto Rico and the southern United States Virgin Islands, with up to an inch anticipated across the remaining Windward and Leeward Islands. This rainfall may cause dangerous flash flooding.
Isaac’s Forecast Path
NHC said on the forecast track, Isaac should move across the central Lesser Antilles and into the eastern Caribbean Sea later today, and then move across the eastern and central Caribbean Sea through the weekend.
Sep. 12, 2018 – NASA/JAXA Satellite Finds Heavy Rainfall in Tropical Storm Isaac
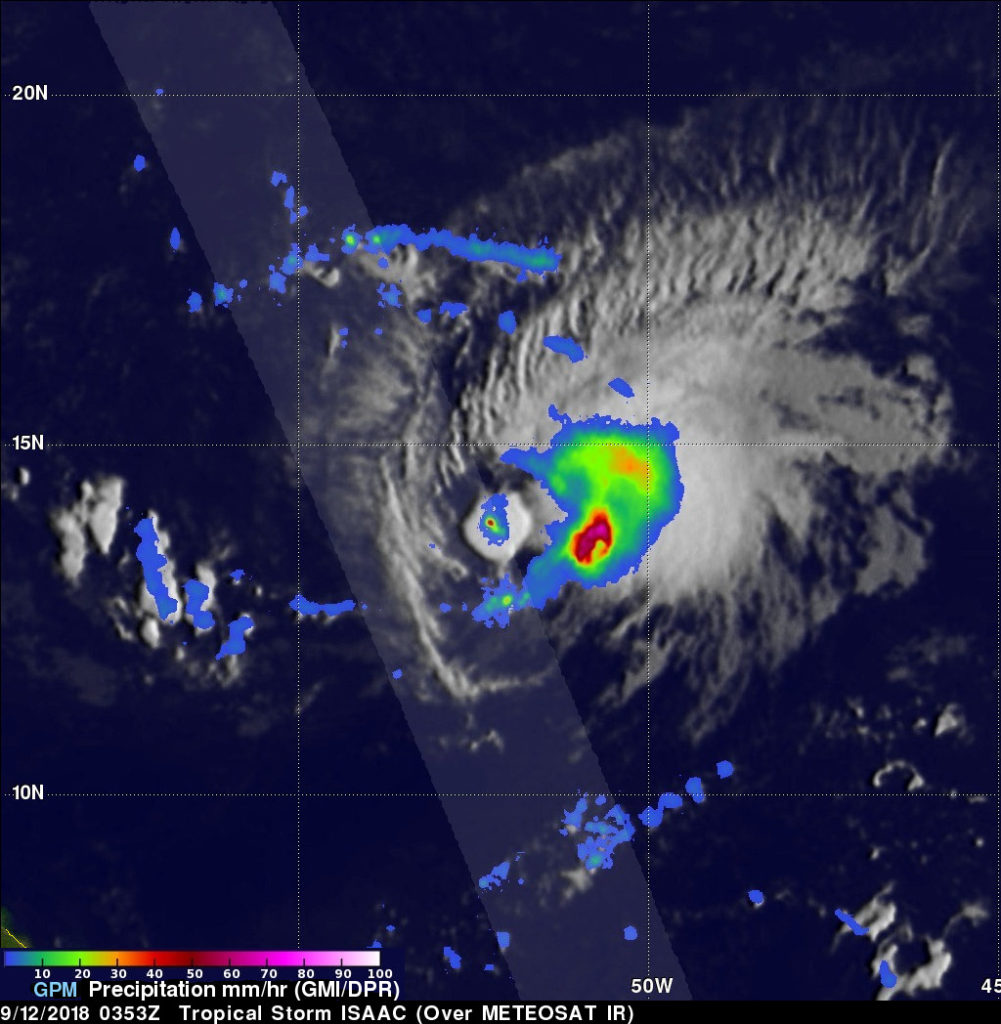
Tropical Cyclones generate a lot of rainfall and the Global Precipitation Measurement mission or GPM satellite and constellation of satellites gather that data and share it with forecasters. GPM recently passed over Tropical Storm Isaac and analyzed its rainfall.
On Sept. 11, 2018 at 11:53 p.m. EDT the GPM core observatory satellite found heaviest rainfall within Isaac was located to the southeast of the center. GPM found rain falling at a rate of over 140 mm (5.5 inches) per hour when it sliced through an isolated storm southwest of Isaac’s center. The 3D view showed heavy downpours there. Storm tops were found by GPM’s radar to reach heights above 16.2 km (10.0 km) in this area. Credit: NASA/JAXA, Hal Pierce
That rainfall is expected to affect the warning areas. The National Hurricane Center posted A Tropical Storm Warning is in effect for Martinique, Dominica and Guadeloupe. A Tropical Storm Watch is in effect for Antigua, Montserrat, St. Kitts and Nevis, and Saba and St. Eustatius.
GPM is an example of NASA’s partnerships with other agencies around the world. GPM is a joint mission between NASA and the Japan Aerospace Exploration Agency or JAXA and the GPM core observatory satellite had an excellent view of tropical storm Isaac on Sept. 11, 2018 at 11:53 p.m. EDT (Sept. 12, 2018 at 0353 UTC).
On Sept. 11, 2018 at 11:53 p.m. EDT the GPM core observatory satellite found heaviest rainfall within Isaac was located to the southeast of the center. GPM found rain falling at a rate of over 140 mm (5.5 inches) per hour when it sliced through an isolated storm southwest of Isaac’s center. The 3D view showed heavy downpours there. Storm tops were found by GPM’s radar to reach heights above 16.2 km (10.0 km) in this area. Credit: NASA/JAXA, Hal Pierce
The satellite revealed that, although expected to weaken, Isaac still contained some powerful convective storms. The GPM satellite’s Microwave Imager (GMI) and Dual-Frequency Precipitation Radar (DPR) instruments collected data that were used in an analysis of Isaac’s rainfall. Those data showed that the heaviest rainfall within the tropical storm was located to the southeast of Isaac’s center of circulation. GPM’s radar (DPR Ku Band) measured rain falling at a rate of over 140 mm (5.5 inches) per hour when it sliced through an isolated convective burst southwest of Isaac’s center.
GPM’s radar (DPR ku Band) data were used in at NASA’s Goddard Space Flight Center in Greenbelt, Md. to create a 3D view from the north-northeast to show the 3D structure of precipitation within the convective burst southwest of ISAAC’s center of circulation. DPR found that heavy downpours there. Storm tops were found by GPM’s radar to reach heights above 16.2 km (10.0 km) in this area of convection.
At 11 a.m. (1500 UTC), the center of Tropical Storm Isaac was located by a NOAA Hurricane Hunter aircraft near latitude 15.0 degrees north and longitude 54.7 degrees west. Isaac is moving toward the west near 17 mph (28 kph), and this general motion with some decrease in forward is expected to continue through the weekend. Aircraft data indicate that maximum sustained winds remain near 60 mph (95 kph) with higher gusts. Gradual weakening is forecast during the next 72 hours.
On Sept. 11, 2018 at 11:53 p.m. EDT the GPM core observatory satellite found heaviest rainfall within Isaac was located to the southeast of the center. GPM found rain falling at a rate of over 140 mm (5.5 inches) per hour when it sliced through an isolated storm southwest of Isaac’s center. The 3D view showed heavy downpours there. Storm tops were found by GPM’s radar to reach heights above 16.2 km (10.0 km) in this area. Credit: NASA/JAXA, Hal Pierce
Hurricane Florence, tropical storm Isaac and Hurricane Helene are currently active in the Atlantic Ocean.
Tropical storm Isaac is the next tropical cyclone to affect the western Atlantic. It is moving westward toward the Leeward and Windward Islands.
The National Hurricane Center (NHC) predicts that Isaac will pass through the Leeward and Windward Islands and move into the Caribbean Sea over the next few days. The NHC predicts that Isaac will weaken as it encounters moderate vertical shear and nearby dry air.
Sep. 11, 2018 – NASA Finds Wind Shear Pushing on Tropical Storm Isaac’s Center
NASA’s Aqua satellite provided an infrared look at Tropical Storm Isaac that revealed its circulation center was displaced from the bulk of clouds and precipitation. That’s an indication that wind shear is affecting the storm.
At 1 a.m. EDT (0500 UTC) on Sept. 11, the MODIS instrument aboard NASA’s Aqua satellite looked at Tropical Storm Isaac in infrared light. MODIS found coldest cloud top temperatures off-center as cold as or colder than minus 80 degrees (yellow) Fahrenheit (minus 112 degrees Celsius). Those most powerful storms were embedded in strong storms with cloud tops as cold as or colder than minus 70 degrees (red) Fahrenheit (minus 56.6 degrees Celsius). Credit: NASA/NRL
What is Vertical Wind Shear?
In general, wind shear is a measure of how the speed and direction of winds change with altitude. In order to understand how it affects a tropical cyclone or hurricane, think of a tropical cyclone as a series of vertically stacked tires, all rotating. As you go up from the ground, each tire represents the rotation of the storm’s center at a higher level in the atmosphere. The different levels of rotating winds in the center of Tropical cyclones need to be stacked on top each other to strengthen. If there are winds higher up that push some of the tires askew near the top, it affects the balance and rotation of the tires below. That’s what happens when vertical wind shear pushes against a storm. It pushes the center and weakens (or wobbles) the rotation of all of the tires.
The Satellite Data Reveal
The National Hurricane Center or NHC noted “Satellite images indicate that the strong tropical storm still has a central dense overcast pattern and a limited amount of outer bands [of thunderstorms]. Earlier microwave data indicated that the center was not located in the middle of the convection, however, likely due to some westerly [wind] shear.”
At 2:30 a.m. EDT (0630 UTC) on Sept. 11, the Moderate Resolution Imaging Spectroradiometer or MODIS instrument aboard NASA’s Aqua satellite analyzed Tropical Storm Isaac in infrared light. MODIS found coldest cloud top temperatures off-center were as cold as or colder than minus 80 degrees Fahrenheit (minus 112 degrees Celsius). Those most powerful storms were embedded in strong storms with cloud tops as cold as or colder than minus 70 degrees Fahrenheit (minus 56.6 degrees Celsius).
NASA research has found that cloud top temperatures as cold as or colder than the 70F/56.6C threshold have the capability to generate heavy rainfall.
Isaac’s Stats on September 11, 2018
At 5 a.m. EDT (0900 UTC), the center of Tropical Storm Isaac was located near latitude 14.6 degrees north and longitude 48.1 degrees west. That’s about 880 miles (1,420 km) east of the Lesser Antilles.
Isaac is moving toward the west near 14 mph (22 kph). This general motion is expected to continue through the end of the week. Maximum sustained winds remain near 70 mph (110 kph) with higher gusts. Little change in strength is forecast during the next few days, but Isaac is forecast to be at or near hurricane strength as it approaches the Lesser Antilles.
Rainfall Anticipated in Leeward and Windward Islands
NHC said that Isaac is expected to produce total rainfall accumulations of 2 to 4 inches with isolated amounts near 6 inches across the Leeward Islands late this week, with 1 to 2 inches anticipated across the Windward Islands.
Isaac’s Forecast Path
On the forecast track, Isaac should move across the Lesser Antilles and into the eastern Caribbean Sea on Thursday.
Sep. 10, 2018 – NASA Covers Hurricane Isaac’s Ragged Center
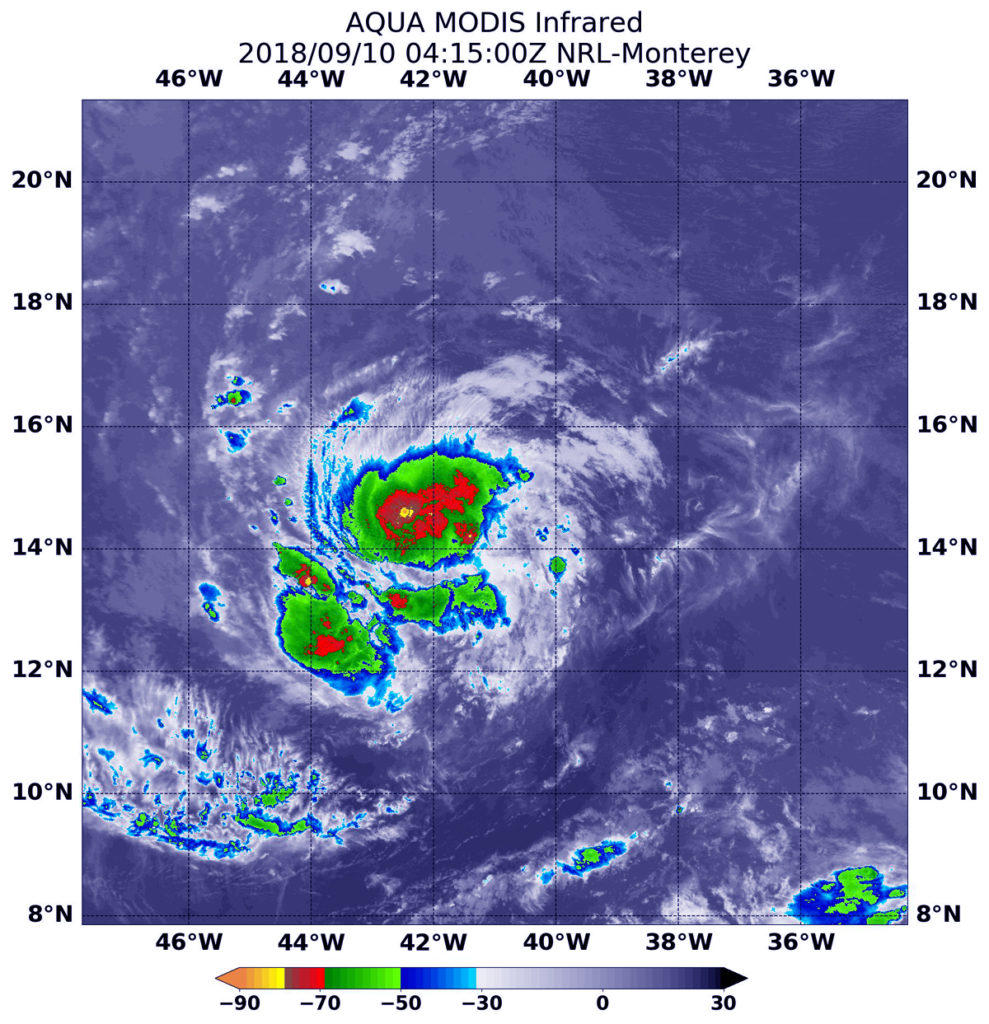
NASA’s Aqua satellite found a thick ring of powerful storms around Hurricane Isaac’s ragged eye and southwest of center on Sept. 10.
At 12:15 a.m. EDT (0415 UTC) on Sept. 10, the MODIS instrument aboard NASA’s Aqua satellite looked at Hurricane Isaac in infrared light. MODIS found coldest cloud tops (red) had temperatures near minus 70 degrees Fahrenheit (minus 56.6 degrees Celsius) around the center. Credit: NASA/NRL
Infrared satellite data at 12:15 a.m. EDT (0415 UTC) on Sept. 10 from the Moderate Resolution Imaging Spectroradiometer or MODIS instrument aboard NASA’s Aqua satellite revealed powerful storms circling Isaac’s center and in fragmented bands southwest of the center. In those areas, MODIS found coldest cloud tops had temperatures near minus 70 degrees Fahrenheit (minus 56.6 degrees Celsius). NASA research has found that cloud top temperatures that cold have the capability to generate heavy rainfall.
The National Hurricane Center observed “Isaac’s cloud pattern is currently a bit ragged-looking, with an irregular central dense overcast and limited convective banding [of thunderstorms].”
At 11 a.m. EDT (1500 UTC), the National Hurricane Center or NHC noted the center of Hurricane Isaac was located near latitude 14.7 North, longitude 43.9 West. That’s about 1,150 miles (1,855 km) east of the Windward Islands. Isaac is moving toward the west near 14 mph (22 kph). A westward motion with a slight increase in forward speed is expected through the end of the week.
Maximum sustained winds are near 75 mph (120 kph) with higher gusts. Additional strengthening is expected over the next day or two. Weakening is forecast to begin by the middle of the week as Isaac approaches the Lesser Antilles.
On the forecast track, Isaac should move across the Lesser Antilles and into the eastern Caribbean Sea on Thursday.
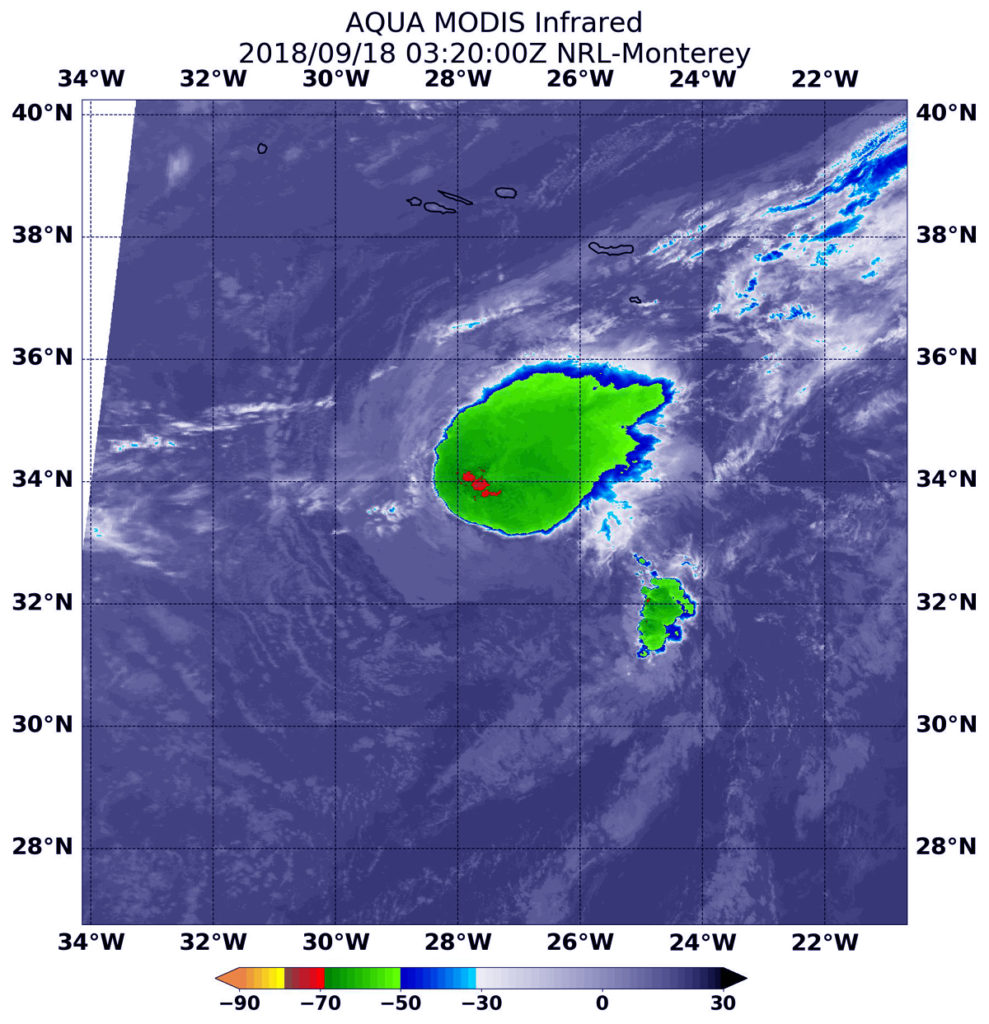
NASA’s Aqua satellite provided an infrared look at Tropical Depression Joyce and found wind shear was pushing the bulk of clouds and showers to the east of the center.
At 11:20 p.m. EDT on Sept. 17 (0320 UTC on Sept. 18), the MODIS instrument aboard NASA’s Aqua satellite looked at Tropical Depression Joyce in infrared light. MODIS found a small area of coldest cloud top temperatures around the center of circulation. Those were as cold as or colder than minus 70 degrees (red) Fahrenheit (minus 56.6 degrees Celsius). Joyce is located south of the Azores Islands. Credit: NASA/NRL
The National Hurricane Center noted at 5 a.m. EDT on Sept. 18, “The latest convective burst associated with Joyce is weakening due to the effects of 35 to 40 knots of westerly vertical [wind] shear and very dry mid-level air.”
In general, wind shear is a measure of how the speed and direction of winds change with altitude. Wind shear can tear a tropical cyclone apart or weaken it.
At 11:20 p.m. EDT on Sept. 17 (0320 UTC on Sept. 18), Moderate Resolution Imaging Spectroradiometer or MODIS instrument aboard NASA’s Aqua satellite analyzed Tropical Depression Joyce in infrared light. MODIS found a small area of coldest cloud top temperatures around the center of circulation. Those were as cold as or colder than minus 70 degrees Fahrenheit (minus 56.6 degrees Celsius). The bulk of the storm, however, was being pushed to the northeast from the wind shear.
NASA research has found that cloud top temperatures as cold as or colder than the 70F/56.6C threshold have the capability to generate heavy rainfall.
At 5 a.m. EDT (0900 UTC), the center of Tropical Depression Joyce was located near latitude 32.9 degrees north and longitude 27.6 degrees west. That’s 355 miles (570 km) south of the Azores Islands.
The depression is moving toward the south-southeast near 6 mph (9 kph). A turn toward the south is forecast later today, followed by a motion toward the southwest on Wednesday, Sept. 19 and Thursday, Sept. 20. Maximum sustained winds are near 35 mph (55 km/h) with higher gusts. Gradual weakening is expected during the next couple of days, and Joyce is forecast to become a remnant low later today or tonight.
Sep. 17, 2018 – NASA Finds Tropical Depression Joyce Continues to Lose It
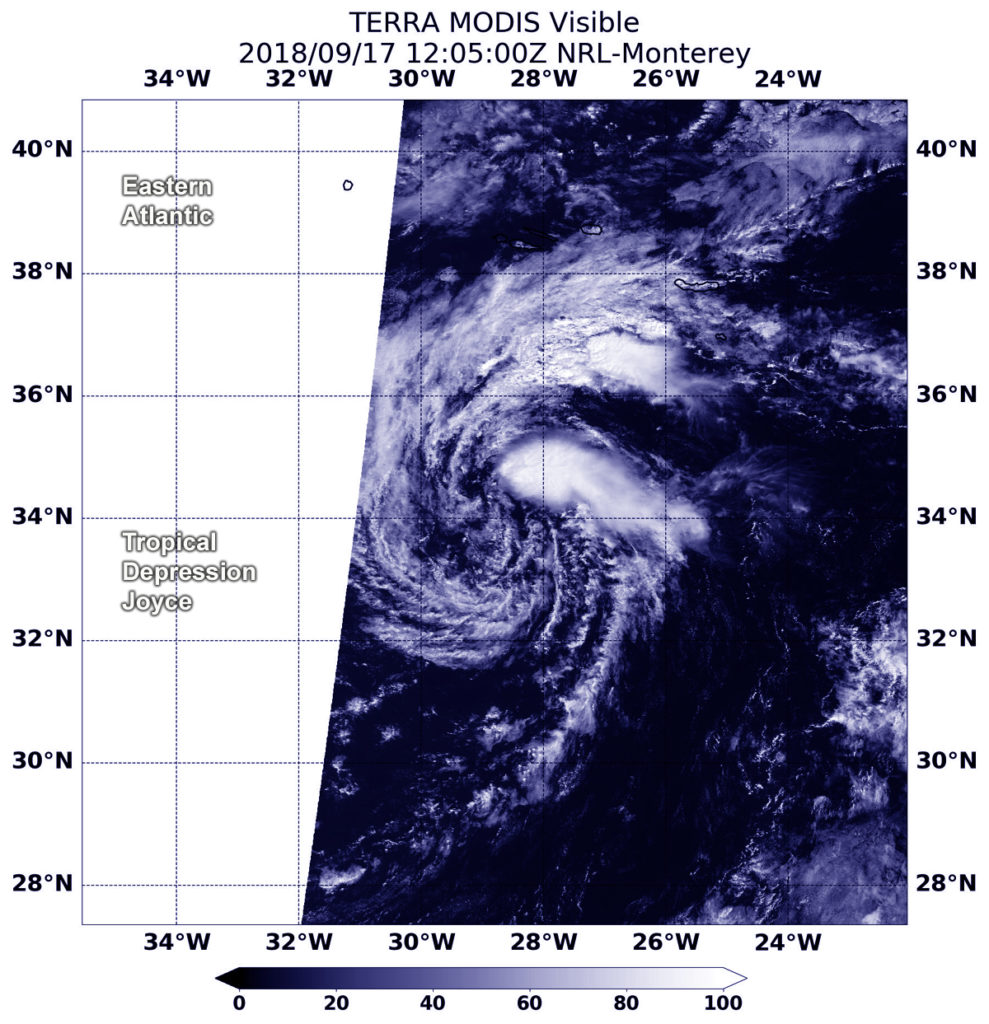
Visible and infrared satellite imagery from NASA’s Aqua satellite revealed Tropical Storm Joyce continues to become more disorganized.
At 8:55 a.m. EDT (1205 UTC) on Sept. 17, the MODIS instrument aboard Aqua captured a visible image of Joyce. Visible satellite imagery shows a few cloud swirls pivoting around a mean center with only a small amount of strongest thunderstorms displaced about 90 miles northeast of the mean center. Credit: NASA/NRL
On Monday, Sept. 17, 2018, there were no coastal watches or warnings in effect as Joyce was far from land.
At 8:55 a.m. EDT (1205 UTC) the Moderate Resolution Imaging Spectroradiometer or MODIS instrument aboard Aqua captured a visible image of Joyce. Drier air is moving into the depression causing it to lose organization. The dry air is sapping the storm’s ability to form the thunderstorms that make up a tropical cyclone. Visible satellite imagery shows a few cloud swirls pivoting around a mean center with only a small amount of strongest thunderstorms displaced about 90 miles northeast of the mean center.
At 11 a.m. EDT (1500 UTC) on Sept. 17, the center of Tropical Depression Joyce was located near latitude 34.0 degrees north and longitude 28.4 degrees west. That’s 280 miles (465 km) south-southwest of the Azores Islands.
The National Hurricane Center or NHC said the depression is moving toward the east-southeast near 8 mph (13 kph) and this forward speed is expected to continue while turning toward the southeast today, south on Tuesday, and southwest on Wednesday, Sept. 19. The estimated minimum central pressure is 1008 millibars. Maximum sustained winds are near 35 mph (55 kph) with higher gusts. Some weakening is forecast during the next 48 hours.
Joyce is expected to become a remnant low tonight or Tuesday, Sept. 18.
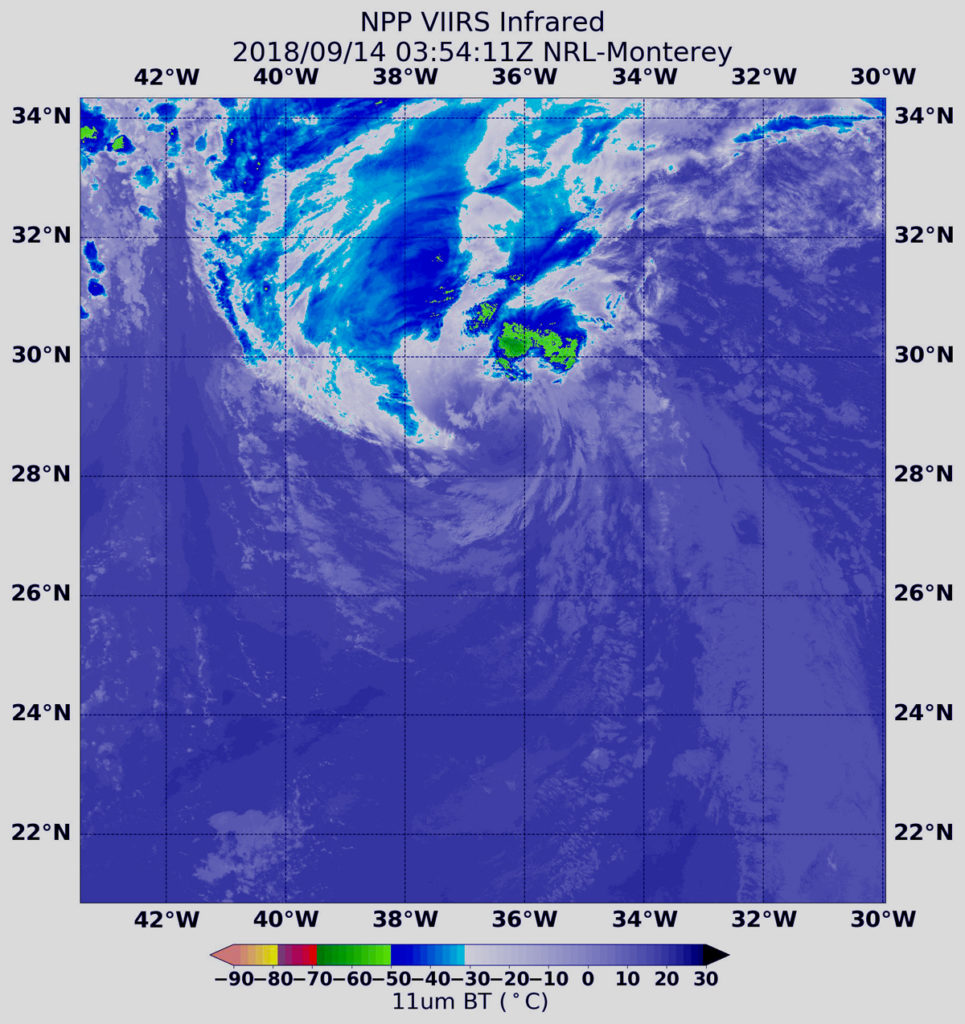
NASA-NOAA’s Suomi NPP satellite passed over the eastern Atlantic Ocean and saw that Tropical Storm Joyce is battling wind shear. Winds are pushing thunderstorm development northeast of the center.
On Sept. 14 at 1:36 a.m. EDT (0536 UTC) the VIIRS instrument aboard NASA-NOAA’s Suomi NPP satellite captured an infrared image of Tropical Storm Joyce. Coldest cloud top temperatures (yellow) of strongest thunderstorms were as cold as minus 50F/minus 45.5C, pushed northeast of the center. Credit: NOAA/NASA/NRL
Southwesterly shear continues to affect now Tropical Storm Joyce. In general, wind shear is a measure of how the speed and direction of winds change with altitude. Winds at different levels of the atmosphere pushed against the cylindrical circulation center and skewed it, weakening the rotation.
On Sept. 14 at 1:36 a.m. EDT (0536 UTC) the Visible Infrared Imaging Radiometer Suite (VIIRS) instrument aboard NASA-NOAA’s Suomi NPP satellite captured an infrared image of Tropical Storm Joyce. VIIRS showed wind shear was tearing the storm apart. The coldest cloud top temperatures of strongest thunderstorms were as cold as minus 50 degrees Fahrenheit/minus 45.5 degrees Celsius and were northeast of the center.
The National Hurricane Center or NHC said “The system continues to produce bands of convection (developing thunderstorms) over the northeastern portion of the circulation, but the center remains exposed due to shear.”
At 5 a.m. EDT (0900 UTC) the center of Tropical Storm Joyce was located near latitude 32.1 degrees north, longitude 44.9 degrees west. That’s 1,090 miles (1,750 km) west-southwest of the Azores Islands. Joyce is moving toward the south-southwest near 8 mph (13 kph). Joyce is forecast to slow down and turn eastward by tonight, and then accelerate northeastward over the weekend.
Maximum sustained winds are near 40 mph (65 kph) with higher gusts. Little change in strength is forecast during the next couple of days.
Joyce is also close to Helene. In fact, Joyce is being steered in that direction around the larger circulation of Helene, located to its east-southeast. Once Helene passes east-northeast of Joyce later today, Joyce should turn eastward, then begin to accelerate northeastward over the weekend of Sept. 15 and 16.
Subtropical Storm Joyce seemed dazed by its own formation, wandering in the north central Atlantic Ocean and disorganized. NASA satellite imagery confirmed the lack of organization and patchy development of thunderstorms within the system.
NASA’s Terra satellite captured an infrared image of Subtropical Storm Joyce at 12:40 a.m. EDT (0440 UTC) on Sept. 13. The image revealed that the low-level center is exposed to the northwest of a small patch of strong thunderstorms where cloud top temperatures were as cold as minus 63 degrees Fahrenheit (minus 53 Celsius). Credit: NASA/NRL
Joyce formed at 5 p.m. EDT on Wednesday, Sept. 12.
The Moderate Resolution Imaging Spectroradiometer or MODIS instrument aboard NASA’s Terra satellite captured an infrared image of Subtropical Storm Joyce at 12:40 a.m. EDT (0440 UTC) on Sept. 13. The MODIS image revealed that the low-level center is exposed to the northwest of a small patch of deep convection (strong thunderstorms that developed).
Infrared data provides temperature information. That small patch of strongest thunderstorms had cloud top temperatures as cold as minus 63 degrees Fahrenheit (minus 53 Celsius). NASA research has shown that cloud tops with temperatures that cold were high in the troposphere and have the ability to generate heavy rain.
At 11 a.m. EDT NOAA’s National Hurricane Center (NHC) noted the center of Subtropical Storm Joyce was located near latitude 33.7 degrees north and longitude 43.7 degrees west. That’s about 980 miles (1,575 km) west-southwest of the Azores Islands.
The storm is moving toward the west-southwest near 6 mph (9 kph). NHC said that a turn toward the south-southwest and then toward the south is expected later today through early Friday. A gradual turn toward the east-northeast and northeast with an increase in forward speed is expected Saturday, Sept. 15 and Sunday, Sept. 16.
Maximum sustained winds are near 40 mph (65 kph) with higher gusts. While little change in strength is forecast during the next 48 hours, Joyce could transition to a tropical storm in the next day or two.
Tropical Cyclone Barijat appeared disorganized on satellite imagery as it moved across the Gulf of Tonkin, South China Sea. The Gulf of Tonkin is a body of water located off the coast of northern Vietnam and southern China. Barijat is being torn apart and had weakened from wind shear. After a landfall on Sept. 13, it is expected to dissipate quickly.
At 1:18 a.m. EDT (0518 UTC) on Sept. 13, the VIIRS instrument aboard NASA-NOAA’s Suomi NPP satellite captured a visible image of Tropical Depression Barijat in the Gulf of Tonkin. Credit: NASA/NRL
In general, wind shear is a measure of how the speed and direction of winds change with altitude. Winds at different levels of the atmosphere pushed against the cylindrical circulation center and skewed it, weakening the rotation.
Barijat weakened from a tropical storm to a tropical depression today, Sept. 13.
At 1:54 a.m. EDT (0554 UTC) on Sept. 13, the Visible Infrared Imaging Radiometer Suite (VIIRS) instrument aboard NASA-NOAA’s Suomi NPP satellite analyzed Tropical Storm Isaac showed a disorganized storm with little thunderstorm development. The Joint Typhoon Warning Center noted “Convection (rising air that form the thunderstorms that make up a tropical cyclone) has all but dissipated and remnant upper level clouds are sheared to the southwest of the low level circulation center.”
On Sept. 13 at 11 a.m. EDT (1500 UTC) Barijat’s maximum sustained winds had dropped to 28.7 mph (25 knots/46.3 kph). It was located approximately 129 nautical miles east of Hanoi, Vietnam. Barijat is moving westward and is expected to make landfall in Vietnam where it will dissipate on Sept. 14.
Sep. 12, 2o18 – NASA Sees Tropical Storm Barijat Affecting Southern China
NASA-NOAA’s Suomi NPP satellite found that as Tropical Storm Barijat was affecting Southern China, wind shear was affecting the storm.
Visible imagery on Sept. 12 at 1:42 a.m. EDT (0542 UTC) from the Visible Infrared Imaging Radiometer Suite (VIIRS) instrument aboard NASA-NOAA’s Suomi NPP satellite showed that Barijat was being affected by wind shear that was pushing the bulk of its clouds southwest of center. Credit: NASA/NOAA/NRL
Visible imagery on Sept. 12 at 1:42 a.m. EDT (0542 UTC) from the Visible Infrared Imaging Radiometer Suite (VIIRS) instrument aboard NASA-NOAA’s Suomi NPP satellite showed that Barijat was being affected by northerly vertical wind shear that was pushing the bulk of its clouds southwest of center. In general, wind shear is a measure of how the speed and direction of winds change with altitude. Wind shear can tear a tropical cyclone apart or weaken it.
The latest Tropical Cyclone Warning Bulletin issued by the Hong Kong Observatory (HKO).at 1:45 p.m. EDT (01:45 a.m. HKT on Sept. 13) reported that the Strong Wind Signal, No. 3 is in force. That means that winds with mean speeds of 25 to 38 mph (41 to 62 kilometers) per hour are expected.
At 2 p.m. EDT on Wednesday, Sept. 12, (2 a.m. HKT local time on Sept. 13) Tropical Storm Barijat was estimated to be about 161 miles (260 kilometers) southwest of Hong Kong, near 20.8 degrees north 112.3 degrees east. Barijat is forecast to move west at about 12.4 mph (20 kph) towards the vicinity of Leizhou Peninsula. Maximum sustained winds recorded at Waglan Island were 27.3 mph (44 kph).
HKO noted that Strong Wind Signal, No. 3 will remain in force for some time. Local winds will gradually weaken later today, Sept. 13 local time.
Barijat continues to track westward and move away from Hong Kong and toward Vietnam.
NASA-NOAA’s Suomi NPP satellite passed over the small Tropical Storm Barijat as it continued moving west toward southern China.
On Sept. 11 at 2:00 a.m. EDT (0600 UTC) the VIIRS instrument aboard NASA-NOAA’s Suomi NPP satellite captured a visible image of disorganized Tropical Storm Barijat. Credit: NOAA/NASA/NRL
On Sept. 11 at 2:00 a.m. EDT (0600 UTC) the Visible Infrared Imaging Radiometer Suite (VIIRS) instrument aboard NASA-NOAA’s Suomi NPP satellite captured visible image of Tropical Storm Barijat. The image shows a small and disorganized system with flaring and developing thunderstorms that are obscuring the low=level circulation center.
At 11 a.m. EDT (1500 UTC), on Sept. 11 the center of Barijat was located near latitude 20.5 degrees north and longitude 116.5 degrees west. That’s about 186 nautical miles southeast of Hong Kong. Barijat was moving to the west-southwest. Maximum sustained winds are near 40 mph (35 knots/62 kph) with higher gusts.
The Joint Typhoon Warning Center forecast noted that only a slight intensification expected because of dry air near the system. After Barijat moves over southern China’s Leizhou Peninsula on Sept. 13, the storm will steadily weaken.
Sep. 10, 2018 – NASA Sees Tropical Storm 27W Moving Through Luzon Strait
NASA’s Aqua satellite passed over the Luzon Strait and captured a visible image of the latest tropical storm to form in the Northwestern Pacific Ocean, Tropical Storm 27W. 27W is expected to be renamed Tropical Storm Barijat.
At 1:10 a.m. EDT (0510 UTC) on Sept. 10, the MODIS instrument aboard NASA’s Aqua satellite looked at Tropical Storm 27W in visible light as it was moving through the Luzon Strait. Credit: NASA/NRL
The Luzon Strait is a body of water located between Taiwan and the Philippines. It is south of Taiwan and north of Luzon, Philippines. Luzon is the largest and most populous island in the Philippines and the northernmost island.
At 1:10 a.m. EDT (0510 UTC) on Sept.10 the Moderate Resolution Imaging Spectroradiometer or MODIS instrument aboard NASA’s Aqua satellite provided a visible image of Tropical Storm 27W. Satellite imagery shows a small, slowly consolidating system with flaring central convection (developing thunderstorms) and shallow bands of thunderstorms loosely wrapping into an obscured low level circulation.
At 11 a.m. EDT (1500 UTC) on Sept. 10, 27W was located near latitude 21.3 degrees north and longitude 120.4 degrees east. That’s about 225 nautical miles south of Taipei, Taiwan. Maximum sustained winds were near 40 mph (35 knots/62 kph). 27W is moving toward the west-southwest near 7 mph (6 knots/11 kph).
Tropical Storm 27W is forecast to continue tracking west-southwestward over the next three day and slowly intensify. The Joint Typhoon Warning Center noted that the storm is only expected to peak at 52 mph (45 knots/83 kph) sometime on Sept. 12. Tropical Storm 27W is expected to make landfall on Sept. 13 over the Luichow Peninsula, China and cross it where it will emerge into the Gulf of Tonkin and make a final landfall late on Sept. 13 or early Sept. 14 north of Hanoi, Vietnam.
Sep. 14, 2018 – NASA Sees Wind Shear Bringing Post-tropical Cyclone Olivia Toward Dissipation
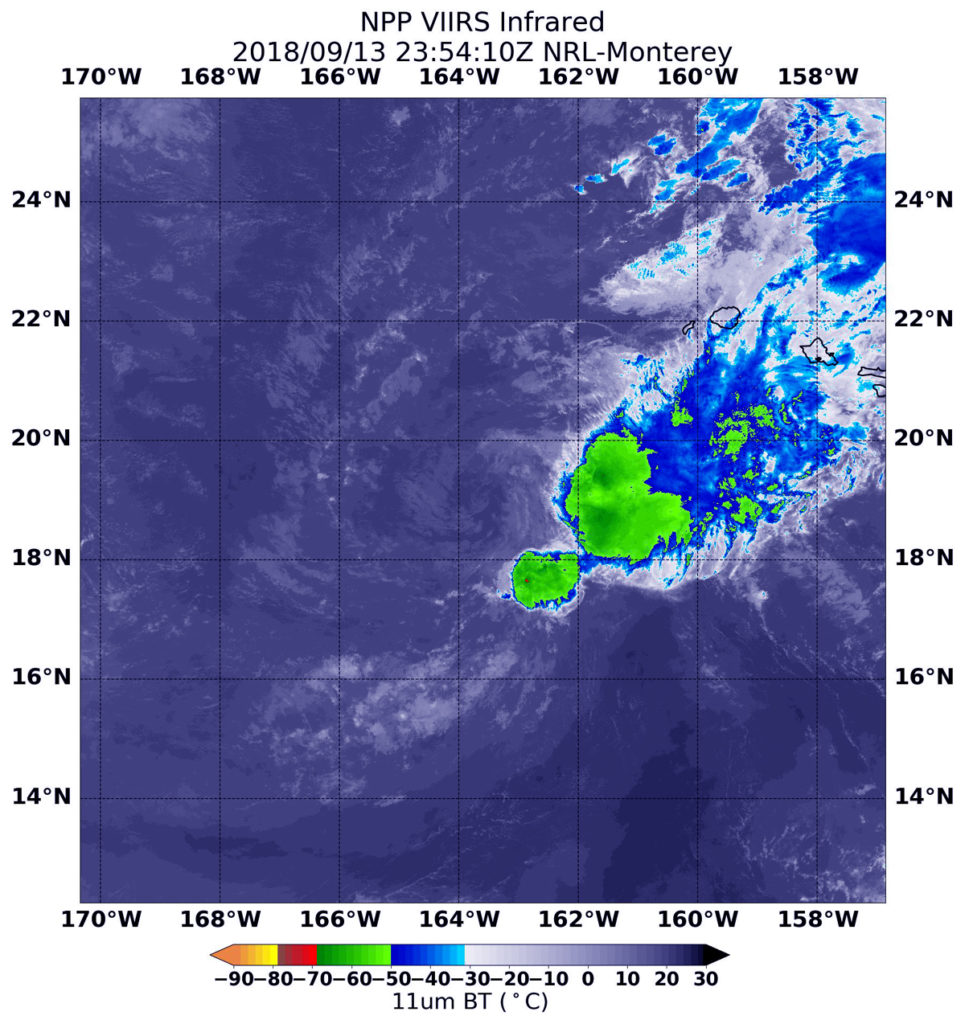
NASA-NOAA’s Suomi NPP satellite found that as Post-tropical cyclone Olivia was being strongly affected by wind shear in the Central Pacific Ocean. That shear was preventing the development of the thunderstorms that would revive the storm, so it weakened into a post-tropical system and is expected to dissipate over the weekend of Sept. 15.
Infrared imagery on Sept. 13 at 7:54 p.m. EDT (2354 UTC) from the Visible Infrared Imaging Radiometer Suite (VIIRS) instrument aboard NASA-NOAA’s Suomi NPP satellite showed that Tropical Depression Olivia was being affected by westerly wind shear that was pushing the bulk of its clouds (yellow) east of center. Credit: NASA/NOAA/NRL
Infrared imagery on Sept. 13 at 7:54 p.m. EDT (2354 UTC) from the Visible Infrared Imaging Radiometer Suite (VIIRS) instrument aboard NASA-NOAA’s Suomi NPP satellite showed that Tropical Depression Olivia was being affected by westerly wind shear that was pushing the bulk of its clouds east of center. In general, wind shear is a measure of how the speed and direction of winds change with altitude. Wind shear can tear a tropical cyclone apart or weaken it.
At 11 a.m. EDT (5 a.m. HST/1500 UTC) the Central Pacific Hurricane Center issued their final advisory on Olivia. At that time the center of Post-Tropical Cyclone Olivia was located near latitude 18.9 degrees north and longitude 164.2 degrees west. The
post-tropical cyclone is moving toward the west near 15 mph (24 km/h). This motion will continue into Friday, followed by a turn toward the west-northwest on Saturday.
Maximum sustained winds are near 35 mph (55 kph) with higher gusts.
Weakening is forecast, with dissipation expected by Sunday.
Sep. 13, 2018 – NASA Sees Tropical Depression Olivia’s Strength Waning
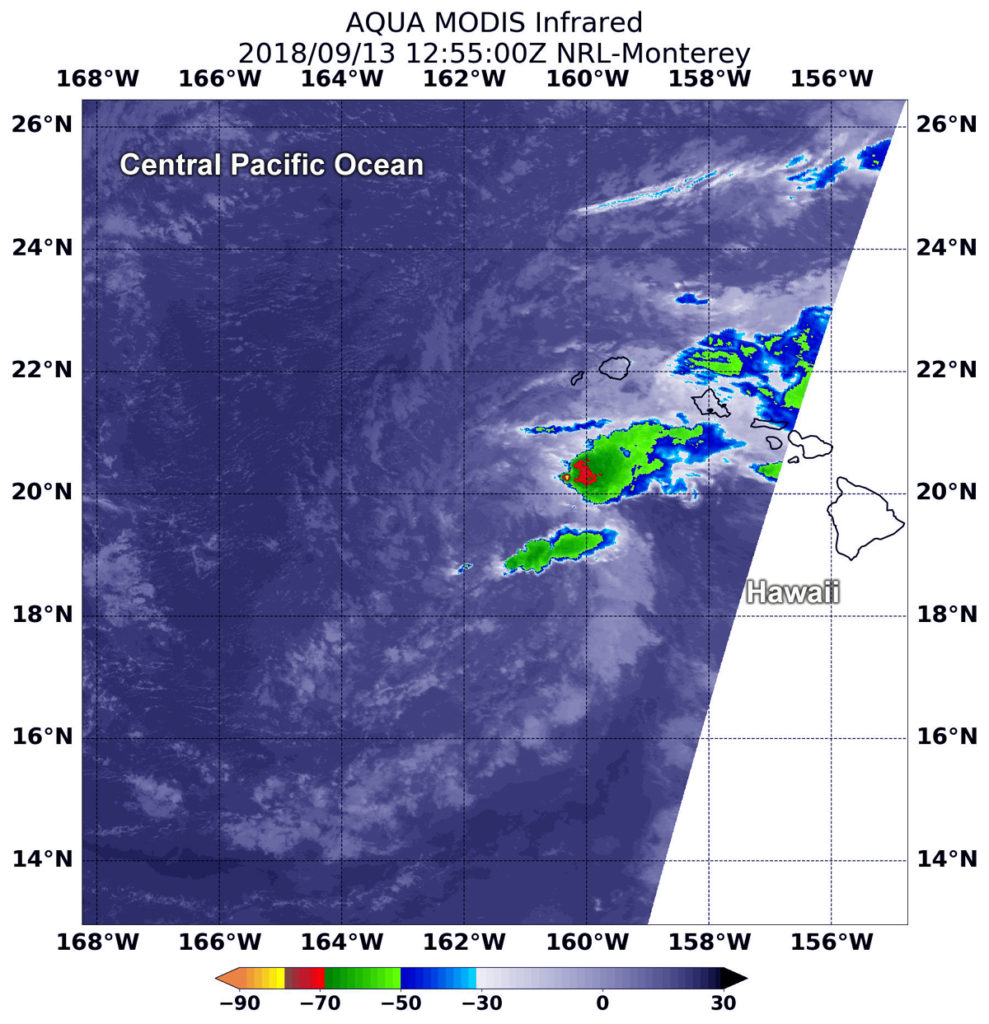
NASA’s Aqua satellite provided an infrared look at a weakening and now tropical depression Olivia in the Central Pacific Ocean. Olivia soaked the Hawaiian Islands on its east to west track through them.
At 8:55 a.m. EDT (1255 UTC) on Sept. 13, the MODIS instrument aboard NASA’s Aqua satellite looked at Tropical Depression Olivia in infrared light. MODIS found a small area of powerful storms with cloud tops as cold as or colder than minus 70 degrees (red) Fahrenheit (minus 56.6 degrees Celsius) west of the Hawaiian Islands. Credit: NASA/NRL
The Central Pacific Hurricane Center or CPHC noted now that Olivia’s center has moved west of the Hawaiian Islands, as such there are no coastal watches or warnings in effect. However, interests in the northwest Hawaiian Islands should monitor the progress of Olivia.
On Sept. 13, Olivia was moving rapidly toward the west-southwest, far southwest of Hawaii, however, flooding rainfall continues across parts of the main Hawaiian Islands.
At 2:20 a.m. EDT (0230 UTC) on Sept. 13, Moderate Resolution Imagine Spectroradiometer or MODIS instrument aboard NASA’s Aqua satellite analyzed Tropical Depression Olivia in infrared light. MODIS found coldest cloud top temperatures in powerful storms with cloud tops as cold as or colder than minus 70F (minus 56.6C) west of the Hawaiian Islands. NASA research has found that cloud top temperatures as cold as or colder than the 70F/56.6C threshold have the capability to generate heavy rainfall.
Despite the heaviest rainfall off-shore, the CPHC noted scattered thunderstorms continue to develop far northeast, southeast, and south of the low-level circulation center, but the core of the system remains completely devoid of deep convection (developing strong thunderstorms).
The CHPC forecast said “Lingering moisture from Olivia continues to cause heavy rainfall across portions of the main Hawaiian Islands this morning. These wet conditions will likely persist through tonight. Since many areas are already saturated, any additional heavy rainfall could produce life-threatening flash flooding.”
Olivia is being weakened by southwesterly vertical wind shear of over 30 knots (34.5 mph/55.5 kph). In general, wind shear is a measure of how the speed and direction of winds change with altitude. Wind shear can tear a tropical cyclone weaken it or even tear it apart.
At 11 a.m. EDT (5 a.m. HST/1500 UTC), the center of Tropical Depression Olivia was located near latitude 19.5 degrees north and longitude 162.2 degrees west. That’s about 250 miles (400 km) southwest of Lihue, Hawaii.
CPHC said the depression is moving toward the west-southwest near 18 mph (30 kph), and this general motion is expected to continue through this morning with a slight decrease in forward speed, followed by a turn toward the west later today. Olivia, or its remnant low, is forecast to turn toward the west-northwest later tonight or Friday.
Maximum sustained winds are near 35 mph (55 kph) with higher gusts. Little change in strength is forecast through tonight. Olivia is expected to become a post-tropical remnant low by Friday.
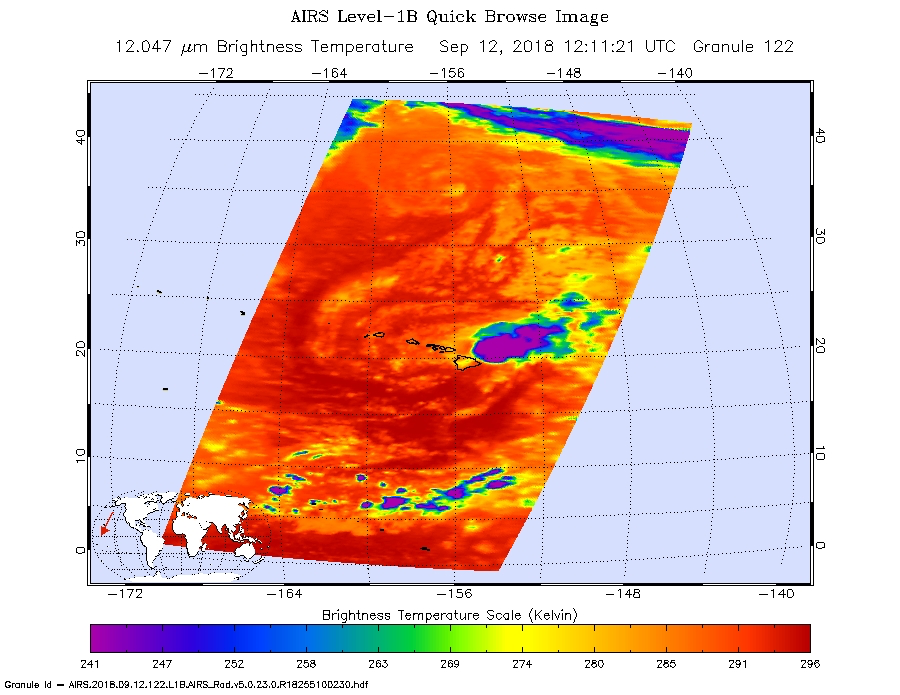
Sep. 12, 2018 – NASA Sees Hawaii Facing Tropical Storm Olivia
While the U.S. East Coast prepares for Hurricane Florence, the U.S. state of Hawaii is feeling the effects of Tropical Storm Olivia. NASA’s Aqua satellite provided an infrared look at Olivia that showed wind shear was affecting it before landfall.
When NASA’s Aqua satellite saw Tropical Storm Olivia on Sept. 12 at 8:11 a.m. EDT (1211 UTC) was closing in on landfall in Hawaii. The AIRS instrument aboard Aqua saw coldest cloud top temperatures near minus 63F/minus 53C (purple). Credit: NASA JPL/Heidar Thrastarson
On Sept. 12, a Tropical Storm Warning is in effect for Oahu, Maui County including the islands of Maui, Molokai, Lanai, and Kahoolawe. Interests in the Northwest Hawaiian Islands should monitor the progress of Olivia.
When NASA’s Aqua satellite passed over Tropical Storm Olivia on Sept. 12 at 8:11 a.m. EDT (1211 UTC) was closing in on landfall in Hawaii. The Atmospheric Infrared Sounder or AIRS instrument analyzed the storm in infrared light which provides temperature information. Temperature is important when trying to understand how strong storms can be. The higher the cloud tops, the colder and the stronger they are.
Vertical wind shear was affecting Olivia and pushing storms east of its center. In general, wind shear is a measure of how the speed and direction of winds change with altitude. Wind shear can tear a tropical cyclone apart or weaken it.
AIRS saw coldest cloud top temperatures were as cold as minus 63 degrees Fahrenheit (minus 53 degrees Celsius) pushed east of the center. Storms with cloud top temperatures that cold have the capability to produce heavy rainfall.
That rainfall is affecting Hawaii today, Sept. 12. The CPHC said “Showers will continue to increase over the main Hawaiian Islands today. Olivia is expected to produce total rainfall accumulations of 5 to 10 inches in some areas, with isolated maximum amounts of 15 inches possible, especially in higher terrain. This rainfall may produce life-threatening flash flooding. Up to 6 inches of rain has already fallen over parts of Maui.”
At 11 a.m. EDT (5 a.m. HST/1500 UTC), the center of Tropical Storm Olivia was located near latitude 21.2 degrees north, longitude 155.7 degrees west. That’s about 55 miles (90 km) east-northeast of Kahului Hawaii. Olivia is moving toward the west near 12 mph (19 km/h), and this motion is expected to continue through this morning. A motion toward the west-southwest is expected later today, with an increase in forward speed. This general motion is then expected to continue the next couple of days.
Maximum sustained winds are near 45 mph (75 kph) with higher gusts. Some weakening is forecast during the next 48 hours.
Sep. 11, 2018 – NASA Sees Hurricane Olivia Moving Toward Hawaii
NASA’s Terra satellite provided an inside look at Hurricane Olivia as it continued to track toward Hawaii. Watches and Warnings remain in effect as Olivia nears.
At 4:45 a.m. EDT (0845 UTC) on Sept. 11, the MODIS instrument aboard NASA’s Terra satellite looked at Hurricane Olivia in infrared light. MODIS found coldest cloud tops (red) had temperatures near minus 70 degrees Fahrenheit (minus 56.6 degrees Celsius). Credit: NASA/NRL
A Tropical Storm Warning is in effect for. Oahu, Maui County…including the islands of Maui, Molokai, Lanai, and, Kahoolawe, and Hawaii County. A Tropical Storm Watch is in effect for Kauai County…including the islands of Kauai and Niihau.
At 4:45 a.m. EDT (0845 UTC) on Sept. 11, from the Moderate Resolution Imaging Spectroradiometer or MODIS instrument aboard NASA’s Terra satellite revealed strongest storms in Olivia had cloud tops with temperatures near minus 70 degrees Fahrenheit (minus 56.6 degrees Celsius). NASA research has found that cloud top temperatures that cold have the capability to generate heavy rainfall.
NOAA’s Central Pacific Hurricane Center (CPHC) said “Hurricane Hunters from the 53rd Weather Reconnaissance Squadron found Olivia’s low-level center further east than anticipated. Some conflicting data exists as to the current intensity, as the central pressure has risen, but winds in the northwest quadrant were stronger than earlier today.”
At 8 a.m. EDT (2 a.m. HST/1200 UTC), the center of Tropical Storm Olivia was located near latitude 21.9 degrees north and longitude 150.7 degrees west. That’s about 320 miles (515 km) east-northeast of Hilo, Hawaii.
Maximum sustained winds are near 65 mph (100 kph) with higher gusts. Gradual weakening is forecast during the next 48 hours, but Olivia is expected to remain a tropical storm as it moves over the islands.
Olivia is moving toward the west near 10 mph (17 kph). A turn to the west-southwest is expected later today, with this general motion continuing for the next couple of days. On the forecast track, the center of Olivia will be moving over portions of the main Hawaiian Islands late tonight into Wednesday, Sept. 12.
Sep. 10, 2018 – NASA Tracking Hurricane Olivia’s Track toward Hawaii
Hurricane Olivia moved from the Eastern Pacific into the Central Pacific and is expected to affect Hawaii. NASA’s Aqua satellite the northeast and southwestern quadrants of the storm to be the most powerful on Sept. 10.
At 12:15 a.m. EDT (0415 UTC) on Sept. 10, the MODIS instrument aboard NASA’s Aqua satellite looked at Hurricane Olivia in infrared light. MODIS found coldest cloud tops (red) had temperatures near minus 70 degrees Fahrenheit (minus 56.6 degrees Celsius) around the center. Credit: NASA/NRL
Infrared satellite data at 12:15 a.m. EDT (0415 UTC) on Sept. 10 from the Moderate Resolution Imaging Spectroradiometer or MODIS instrument aboard NASA’s Aqua satellite revealed the strongest storms were southwest and northeast of the center. In those areas MODIS found coldest cloud tops had temperatures near minus 70 degrees Fahrenheit (minus 56.6 degrees Celsius). NASA research has found that cloud top temperatures that cold have the capability to generate heavy rainfall.
The MODIS data showed that the strongest storms only extended out 30 miles from the center. Hurricane-force winds extend outward up to 30 miles (45 km) from the center and tropical-storm-force winds extend outward up to 115 miles (185 km).
The Central Pacific Hurricane Center of CPHC noted a Tropical Storm Warning is in effect for Hawaii that covers Maui County, including the islands of Maui, Molokai, Lanai, and Kahoolawe and Hawaii County. A Tropical Storm Watch is in effect for Oahu.
At 11 a.m. EDT (1500 UTC/5 a.m. HST), the center of Hurricane Olivia was located near latitude 21.7 degrees north and longitude 148.0 degrees west. Maximum sustained winds are near 85 mph (140 kph) with higher gusts. Little change in strength is forecast today, with slight weakening starting tonight and continuing through Tuesday. However, Olivia is forecast to be a strong tropical storm when it reaches the Hawaiian Islands.
Olivia is moving toward the west near 10 mph (17 kph). This general motion is expected to continue early today, followed by a turn toward the west-southwest starting later today. This west-southwest motion is expected to continue through Tuesday night. On this forecast track, tropical storm conditions are expected over parts of Hawaii starting late Tuesday.
Sep. 07, 2018 – Hurricane Olivia’s Eye Obvious from NASA’s Aqua Satellite
Hurricane Olivia’s eye was clear in infrared imagery taken by NASA’s Aqua satellite from its orbit in space.
At 4:50 p.m. EDT (2205 UTC) on Sept. 6, the AIRS instrument aboard NASA’s Aqua satellite looked at Hurricane Olivia in infrared light. AIRS found coldest cloud tops ( had temperatures near minus 63 degrees Fahrenheit (minus 53 degrees Celsius).Credit: NASA/NRL
Infrared satellite data at 4:50 p.m. EDT (2205 UTC) on Sept. 6, from the instrument aboard NASA’s Aqua satellite showed a clear image of Hurricane Olivia’s eye surrounded by coldest cloud top temperatures near minus 63 degrees Fahrenheit (minus 53 degrees Celsius). NASA research has found that cloud top temperatures that cold have the capability to generate heavy rainfall.
On Sept.7, Olivia’s overall cloud structure in infrared and passive microwave satellite imagery has changed little since the previous advisory, except that the cloud tops have warmed significantly around the well-defined, 20-nautical-mile in diameter eye.
At 5 a.m. EDT (0900 UTC) on Sept. 7 the National Hurricane Center or NHC noted the center of Hurricane Olivia was located near latitude 19.6 degrees north and longitude 131.2 degrees west.
Olivia is moving toward the west-northwest near 15 mph (24 kph), and this general motion is forecast to continue through Saturday. A gradual turn toward the west is expected Saturday night or Sunday. Maximum sustained winds have decreased to near 125 mph (205 kph) with higher gusts. Olivia is a category 3 hurricane on the Saffir-Simpson Hurricane Wind Scale.
NHC said “A slow weakening trend is expected through the weekend.”
The Global Precipitation Measurement mission or GPM satellite passed over Hurricane Olivia and found heaviest rain in a tight ring around the eye.
On Sept. 6 at 6:31 a.m. EDT (1031 UTC) the GPM core satellite provided an analysis of rainfall rates occurring in Hurricane Olivia. Strongest rainfall was occurring around the eye at a rate of 1.5 inches (38 mm) per hour (pink). The GPM data was overlaid on infrared cloud imagery from NOAA’s GOES-West satellite. Credit: NASA/JAXA/NRL/NOAA
On Sept. 6 at 6:31 a.m. EDT (1031 UTC) the GPM core satellite provided an analysis of rainfall rates occurring in Hurricane Olivia. GPM found that heaviest rainfall rates were occurring around the eye at a rate of 1.5 inches (38 mm) per hour. Because the storm is compact, that area of heavy rainfall was also compact. Hurricane-force winds extend outward up to 25 miles (35 km) from the center and tropical-storm-force winds extend outward up to 115 miles (185 km).
At 5 a.m. EDT (0900 UTC) on Sept. 6, the National Hurricane Center or NHC noted the center of Hurricane Olivia was located near latitude 18.2 degrees north and longitude 126.5 degrees west. That’s about 1,125 miles (1,805 km) west-southwest of the southern tip of Baja California, Mexico.
Olivia is moving toward the west-northwest near 14 mph (22 kph), and this motion with some increase in forward speed is expected during the next couple of days. A gradual turn toward the west is expected over the weekend of Sept. 8 and 9.
Maximum sustained winds have increased to near 120 mph (195 kph) with higher gusts. Olivia is a category 3 hurricane on the Saffir-Simpson Hurricane Wind Scale. Some additional strengthening is possible today. After that, a gradual weakening trend is forecast to begin tonight or Friday.
Sep. 05, 2018 – NASA Finds a Weaker Hurricane Olivia
Infrared data from NASA’s Terra satellite revealed that the area of coldest cloud topped thunderstorms has dropped from the previous day, indicating weaker uplift and less-strong storms.
On Sept. 5 at 2:10 a.m. EDT (0610 UTC) the MODIS instrument aboard NASA’s Terra satellite captured an image of Hurricane Olivia. Strongest thunderstorms were smaller in area (red) than the previous day. Credit: NASA/NRL
On Sept. 5 at 2:10 a.m. EDT (0610 UTC) NASA’s Terra satellite passed over Olivia and analyzed the storm in infrared light to show temperatures. The MODIS or Moderate Resolution Imaging Spectroradiometer instrument aboard NASA’s Aqua satellite revealed cloud top temperatures as cold or colder than minus 70 degrees Fahrenheit (minus 56.6 degrees Celsius) in fragmented areas southwest and east of the center. NASA research indicates very cold cloud tops with the potential to generate very heavy rainfall. At the time of the satellite image, Olivia had weakened but it was still a Category 3 hurricane.
Olivia encountered moderate easterly wind shear which continued to weaken the storm.
By 11 a.m. EDT (1500 UTC), the National Hurricane Center or NHC said Olivia weakened to a Category 2 hurricane on the Saffir-Simpson Hurricane Wind Scale. The center of Hurricane Olivia was located near latitude 17.1 degrees north and longitude 122.3 degrees west. Olivia was far from land areas. It was 900 miles (1,445 km) west-southwest of the southern tip of Baja California, Mexico.
Olivia is moving toward the west near 13 mph (20 kph), and this motion is expected to continue today. A turn toward the west-northwest is expected tonight, followed by a gradual turn back toward the west over the weekend.
Maximum sustained winds have decreased to near 110 mph (175 kph) with higher gusts. The NHC said additional slow weakening is expected during the next few days.
Sep. 04, 2018 – Infrared NASA Data Shows Hurricane Olivia’s Strongest Sides
NASA’s Aqua satellite passed over Hurricane Olivia and found bands of thunderstorms wrapping around its eye and improved thunderstorm development over the southern quadrant of the storm. The eastern quadrant also showed strong storms.
At 5:45 a.m. EDT (0945UTC) on Sept. 4, the MODIS instrument aboard NASA’s Aqua satellite looked at Hurricane Olivia in infrared light. MODIS found coldest cloud tops (red) had temperatures near minus 70 degrees Fahrenheit (minus 56.6 degrees Celsius).Credit: NASA/NRL
Infrared satellite data at 5:45 a.m. EDT (0945UTC) on Sept. 4, from the Moderate Resolution Imaging Spectroradiometer or MODIS instrument aboard NASA’s Aqua satellite showed coldest cloud top temperatures in Olivia in the eastern and southern quadrants. In those areas, cloud tops had temperatures near minus 70 degrees Fahrenheit (minus 56.6 degrees Celsius). NASA research has found that cloud top temperatures that cold have the capability to generate heavy rainfall.
Infrared data also provided forecasters with a look at surrounding sea surface temperatures (SSTs). Tropical cyclones require SSTs at least near 80 degrees Fahrenheit (26.6 degrees Celsius) to maintain strength. NHC forecasters noted at 5 a.m. EDT (0900 UTC) on Sept. 4 that “Olivia has about 24-36 hours or so remaining over warm SSTs with marginally favorable upper wind conditions.”
At 5 a.m. EDT (0900 UTC), the National Hurricane Center or NHC noted the center of Hurricane Olivia was located near latitude 16.9 degrees north and longitude 117.2 degrees west. That’s about 630 miles (1,015 km) southwest of the southern tip of Baja California, Mexico.
Olivia is moving toward the west near 12 mph (19 kph), and the hurricane is forecast to turn west-northwestward Wednesday with an increase in forward speed.
Maximum sustained winds are near 80 mph (130 kph) with higher gusts. Some strengthening is forecast, and Olivia could become a category 2 hurricane tonight, with gradual weakening commencing early Thursday, Sept. 6.
Sep. 07, 2018 – Tropical Depression Gordon Still Lingering Over Arkansas
Tropical Depression Gordon just doesn’t want to give up. Gordon is meandering in the southern U.S. and satellites pinpointed its center over Arkansas on Friday, Sept. 7. Gordon continues to soak the southern U.S. and NASA’s Aqua satellite located the strongest storms associated with the depression.
At 4:35 a.m. EDT (0835 UTC) on Sept. 7, the MODIS instrument aboard NASA’s Aqua satellite looked at Tropical Depression Gordon in infrared light. AIRS found coldest cloud tops had temperatures near minus 63 degrees Fahrenheit (minus 53 degrees Celsius) (in yellow) around the center over southern Arkansas. Credit: NASA/NRL
NASA’s Aqua satellite provided an infrared look at clouds associated with Gordon and found its center over Arkansas. At 4:35 a.m. EDT (0835 UTC) on Sept. 7, the MODIS or Moderate Resolution Imaging Spectroradiometer instrument aboard NASA’s Aqua satellite looked at Tropical Depression Gordon in infrared light. AIRS found coldest cloud tops had temperatures near minus 63 degrees Fahrenheit (minus 53 degrees Celsius) around the center over southern Arkansas. NASA research has shown that storms with cloud tops that cold are high in the troposphere and can produce heavy rainfall.
On Sept. 7, the National Weather Service Weather Prediction Center noted that at 5 a.m. EDT (0900 UTC), Tropical Depression Gordon was located just 30 miles (45 km) south of Little Rock, Arkansas near latitude 34.5 degrees north and longitude 92.2 degrees west. The depression was moving toward the north near 5 mph (7 kph) and this motion is expected to continue today with a turn to the northeast Saturday, Sept. 8.
Maximum sustained winds are near 10 mph (20 kph) with higher gusts. A gradual increase in winds is expected as the low becomes extra-tropical over the weekend
The estimated minimum central pressure is 1013 millibars.
As with any tropical system over land, heavy rain and flooding is a main concern. Gordon is expected to produce total rain accumulations of 3 to 6 inches over Missouri into the Midwest, with possible isolated maximum amounts of 10 inches through Saturday night. This rainfall will likely cause local flooding and flash flooding.
Sep. 06, 2018 – Satellites Tracking the Rainfall from Tropical Depression Gordon
Gordon is still considered a tropical depression as it makes its way into the south central U.S. NOAA’s GOES-East satellite provided an infrared look at clouds associated with Gordon and found its center over Mississippi.
NOAA’s GOES-East satellite captured an infrared image of Gordon on Sept. 6 at 8 a.m. EDT (1200 UTC) as it continued to move toward Arkansas. The image showed clouds in an egg-shape near the center of circulation. Credit: NOAA/NRL
On Sept. 6, the National Weather Service noted that Flash Flood Watches are in effect over portions of Mississippi and Arkansas. The National Weather Service said that the threat of heavy rains and flooding will continue for several days.
At 5 a.m. EDT (0900 UTC), Tropical Depression Gordon was located near latitude 33.7 degrees north and longitude 91.3 degrees west. The center was located about 115 miles (185 km) north-northwest of Jackson, Mississippi.
The depression is moving toward the west-northwest near 8 mph (13 kph) and this motion is expected to continue today. Maximum sustained winds are near 25 mph (35 kph) with higher gusts. Little change in strength is forecast during the next 48 hours. The estimated minimum central pressure is 1015 millibars.
NOAA’s GOES-East satellite captured an infrared image of Gordon on Sept. 6 at 8 a.m. EDT (1200 UTC) as it continued to move toward Arkansas. The image showed clouds in an egg-shape near the center of circulation.
Gordon is expected to produce total rain accumulations of 3 to 7 inches over northwest Mississippi and much of Arkansas, up into the Midwest, with possible isolated maximum amounts of 10 inches through Saturday night. This rainfall will likely cause local flooding and flash flooding.
Sep. 05, 2018 – NASA Finds Strong Rain Potential in Tropical Storm Gordon
NASA’s Aqua satellite passed over the Gulf of Mexico and collected temperature information on Tropical Storm Gordon’s clouds as it moved toward landfall and after landfall. Those cloud top temperatures indicated that Gordon has the potential to generate heavy rainfall as it moves inland over the next several days.
On Sept. 5 at 3:10 a.m. EDT (0710 UTC) Aqua’s MODIS instrument showed the cloud top temperatures were as cold as minus 63 degrees Fahrenheit (minus 53 degrees Celsius) in yellow. The coldest cloud tops and heavy rainmaking storms were around the low-level center and in a large band east of the center. Credit: NASA / NRL
The Atmospheric Infrared Sounder or AIRS instrument aboard NASA’s Aqua satellite passed over Tropical Storm Gordon on Sept. 4 at 3:05 p.m. EDT (19:05 UTC) and analyzed the storm in infrared light. Infrared light provides temperature data and that’s important when trying to understand how strong storms can be. The higher the cloud tops, the colder and the stronger they are.
When Aqua passed over Gordon, the AIRS instrument found coldest cloud top temperatures in thunderstorms. Those temperatures were as cold as minus 63 degrees Fahrenheit (minus 53 degrees Celsius). Storms with cloud top temperatures that cold have the capability to produce heavy rainfall.
Soon after the AIRS image, the National Hurricane Center or NHC noted “Gordon has been undergoing another convective bursting phase during the past few hours, with a sharp increase in Doppler velocity values noted between 9,000-12,000 feet (meaning cloud tops were reaching that altitude).”
NASA’s Aqua satellite provided an infrared picture of Tropical Storm Gordon’s cloud top temperatures on Sept. 4 at 3:05 p.m. EDT (19:05 UTC). Credit: NASA JPL, Heidar Thrastarson
At 11 a.m. EDT on Sept. 4, the NHC said that aircraft and radar imagery showed that the center of Gordon was making landfall just west of the Alabama-Mississippi border.
On Sept. 5 at 3:10 a.m. EDT (0710 UTC) Aqua passed over the Gulf coast again, and the Moderate Resolution Imaging Spectroradiometer or MODIS instrument aboard measured infrared temperatures. That data showed the cloud top temperatures were as cold as they were when AIRS passed over 12 hours before. However, they were not in as wide an area. The coldest cloud tops and heavy rainmaking storms were around the low-level center and in a large band east of the center.
At 8 a.m. EDT (1200 UTC) on Sept. 5, the National Hurricane Center (NHC) noted the center of Tropical Depression Gordon was located near latitude 32.0 degrees north and longitude 89.9 degrees west. The center of circulations is about 25 miles (40 km) south-southeast of Jackson, Mississippi.
Gordon is moving toward the northwest near 14 mph (22 kph). A northwestward motion with some decrease in forward speed is expected over the next couple of days. A turn toward the north-northwest and north is forecast to occur on Friday. Maximum sustained winds have decreased to near 35 mph (55 kph) with higher gusts in a few squalls near the center. Additional weakening is expected as Gordon moves farther inland.
The NHC’s key messages are that heavy rainfall from Gordon will affect the western Florida Panhandle, southwest Alabama, southern and central Mississippi, northeastern Louisiana, Arkansas, Missouri, southern Iowa and Illinois, with isolated maximum amounts of 12 inches through early Saturday. This rainfall will cause flash flooding across portions of these areas.
On the forecast track, the center of Gordon will move across the lower Mississippi Valley today.
For updated forecasts on Gordon and local effects including storm surge, rainfall, wind and tornadoes, visit: www.nhc.noaa.gov.
Sep. 04, 2018 – NASA Finds Tropical Storm Gordon’s Strength East of Its Center
After drenching south Florida, Tropical Storm Gordon moved into the eastern Gulf of Mexico and is headed to the northwest. NASA’s Aqua satellite found three areas of the strongest storms east of Gordon’s center when it passed overhead on Sept. 4 .
At 4:05 a.m. EDT (0805 UTC) on Sept. 4, the MODIS instrument aboard NASA’s Aqua satellite looked at Tropical Storm Gordon in infrared light. MODIS found coldest cloud tops (red) had temperatures near minus 70 degrees Fahrenheit (minus 56.6 degrees Celsius) in three areas east of the center. Credit: NASA/NRL
Infrared satellite data on Tuesday, Sept. 4 at 4:05 a.m. EDT (0805 UTC) from the Moderate Resolution Imaging Spectroradiometer or MODIS instrument aboard NASA’s Aqua satellite revealed several strongest areas in Gordon where cloud top temperatures were indicative of strong storms and heavy rainmakers. In those areas, MODIS found coldest cloud tops had temperatures near minus 70 degrees Fahrenheit (minus 56.6 degrees Celsius). NASA research has found that cloud top temperatures that cold have the capability to generate heavy rainfall.
At 5 a.m. EDT (0900 UTC), the National Hurricane Center or NHC noted “The storm has a small CDO [central dense overcast] with convective banding features primarily over the eastern semicircle of the circulation.” It is in the eastern semicircle where Aqua found the strongest storms.
There are numerous watches and warnings in effect as Gordon is forecast to track through the Gulf of Mexico and make landfall along the northern Gulf coast. NHC said A Storm Surge Warning is in effect for Shell Beach to Dauphin Island, Alabama. A Storm Surge Watch is in effect from west of Shell Beach to the Mouth of the Mississippi River and east of Dauphin Island to Navarre, Florida. A Hurricane Warning is in effect for. The mouth of the Pearl River to the Alabama-Florida Border. A Tropical Storm Warning is in effect for west of the mouth of the Pearl River to east of Morgan City, Louisiana, including Lake Pontchartrain and Lake Maurepas and from the Alabama-Florida Border to Okaloosa-Walton County Line, Florida..
At 8 a.m. EDT (1200 UTC), the center of Tropical Storm Gordon was located near latitude 28.1 degrees north and longitude 86.2 degrees west. That’s about 190 miles (305 km) east-southeast of the mouth of the Mississippi River. Gordon is moving toward the west-northwest near 15 mph (25 kph). A west-northwestward to northwestward motion with some decrease in forward speed is expected over the next few days.
NHC said that maximum sustained winds are near 65 mph (100 kph) with higher gusts. Some strengthening is expected today, and Gordon is forecast to be a hurricane when it makes landfall along the north-central Gulf Coast. Rapid weakening is expected after Gordon moves inland.
On the forecast track, the center of Gordon will move across the eastern Gulf of Mexico today, and will approach the north-central Gulf Coast within the warning area late this afternoon or evening, and move inland over the lower Mississippi Valley tonight or early Wednesday, Sept. 5.
Sep. 03, 2018 – NASA Observes Formation of Tropical Storm Gordon in Upper Florida Keys
Infrared data from NASA’s Aqua satellite showed Tropical Storm Gordon formed over the Upper Florida Keys on Sept. 3.
At 3:20 a.m. EDT (0720 UTC) on Sept. 3, the MODIS instrument aboard NASA’s Aqua satellite looked at newly formed Tropical Storm Gordon in infrared light. MODIS found coldest cloud tops (red) had temperatures near minus 70 degrees Fahrenheit (minus 56.6 degrees Celsius) south of the Florida Peninsula. Fragmented bands of thunderstorms extended over south Florida. Credit: NASA/NRL
At 3:20 a.m. EDT (0720 UTC) on Sept. 3, the Moderate Resolution Imaging Spectroradiometer or MODIS instrument aboard NASA’s Aqua satellite looked at newly formed Tropical Storm Gordon in infrared light. MODIS found coldest cloud tops had temperatures near minus 70 degrees Fahrenheit (minus 56.6 degrees Celsius) south of the Florida Peninsula. Storms with cloud top temperatures that cold have the capability to produce heavy rainfall. Fragmented bands of thunderstorms extended over south Florida and into the Bahamas.
At 5 a.m. EDT, the National Hurricane Center noted Storm Surge Watch is in effect for the Mississippi-Alabama border westward to the Mouth of the Mississippi River. A Tropical Storm Warning is in effect for Golden Beach to Bonita Beach, Florida; from Craig Key to Ocean Reef, including Florida Bay, and for the Alabama-Florida border westward to east of Morgan City, Louisiana, including Lake Pontchartrain and Lake Maurepas. Heavy rainfall, storm surge and tropical-storm force winds are expected in the warning areas. For details: https://www.nhc.noaa.gov/text/refresh/MIATCPAT2+shtml/031227.shtml?
The National Hurricane Center noted at 8: 30 a.m. EDT (1230 UTC), the center of Tropical Storm Gordon was located by NOAA Doppler weather radar and surface observations near latitude 25.1 degrees north and longitude 80.7 degrees west.
Gordon is moving toward the west-northwest near 17 mph (28 kph) and a west-northwestward to northwestward motion is expected over the next 72 hours. On the forecast track, the center of Gordon will pass over the southern tip of the Florida peninsula this morning, move over the southeastern Gulf of Mexico this afternoon and evening, and reach the warning area along the central Gulf Coast by late Tuesday or Tuesday night.
Surface observations and radar data indicate that maximum sustained winds have increased to near 45 mph (75 kph) with higher gusts. Additional strengthening is forecast during the next 48 hours.