Dalila (was TD5E) – Eastern Pacific Ocean

July 24, 2019 – Suomi NPP Satellite Sees Tropical Depression Dalila Fading

NASA-NOAA’s Suomi NPP satellite provided a visible image of weakening Tropical Depression Dalila in the Eastern Pacific Ocean.

Suomi NPP image of Dalila
NASA-NOAA’s Suomi NPP satellite passed over the Eastern Pacific Ocean and captured an infrared view of Tropical Depression Dalila. Suomi NPP saw a limited area of strong thunderstorms where cloud top temperatures were as cold as minus 70 degrees Fahrenheit (minus 56.6 Celsius). Credit: NASA/NRL

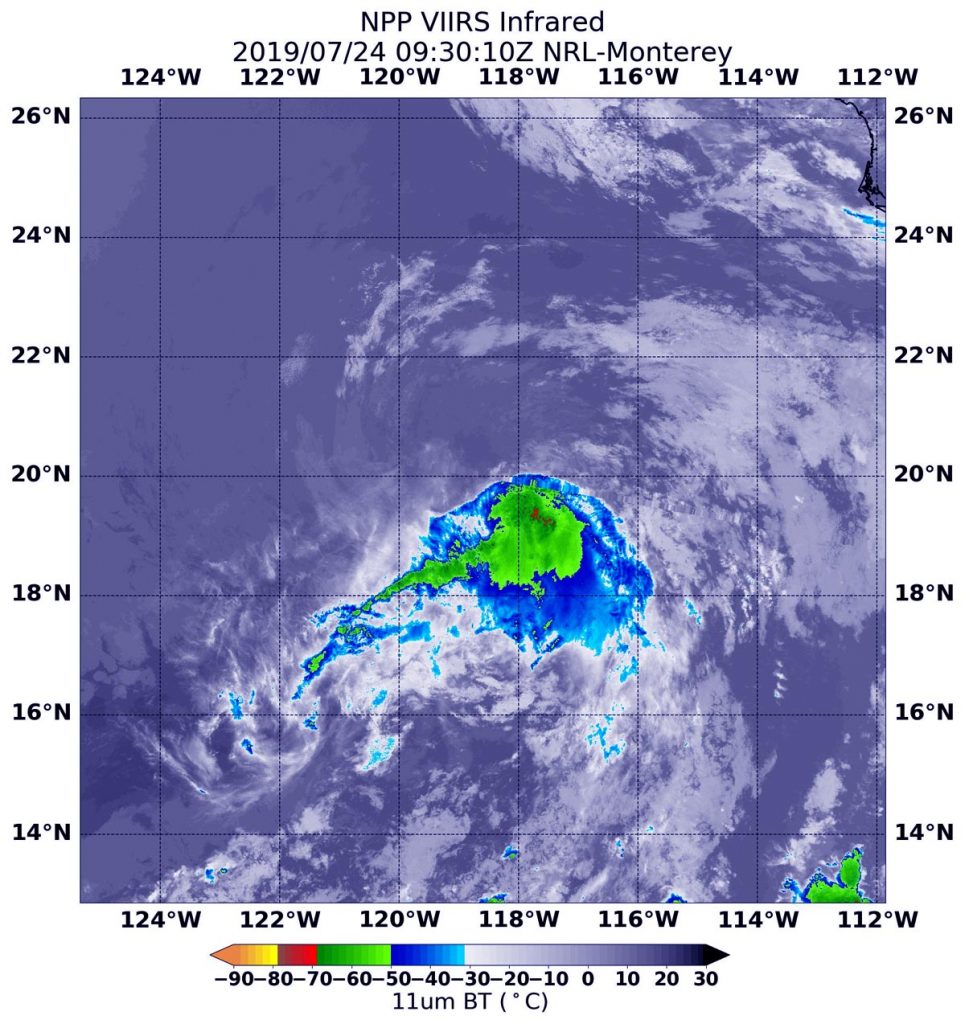
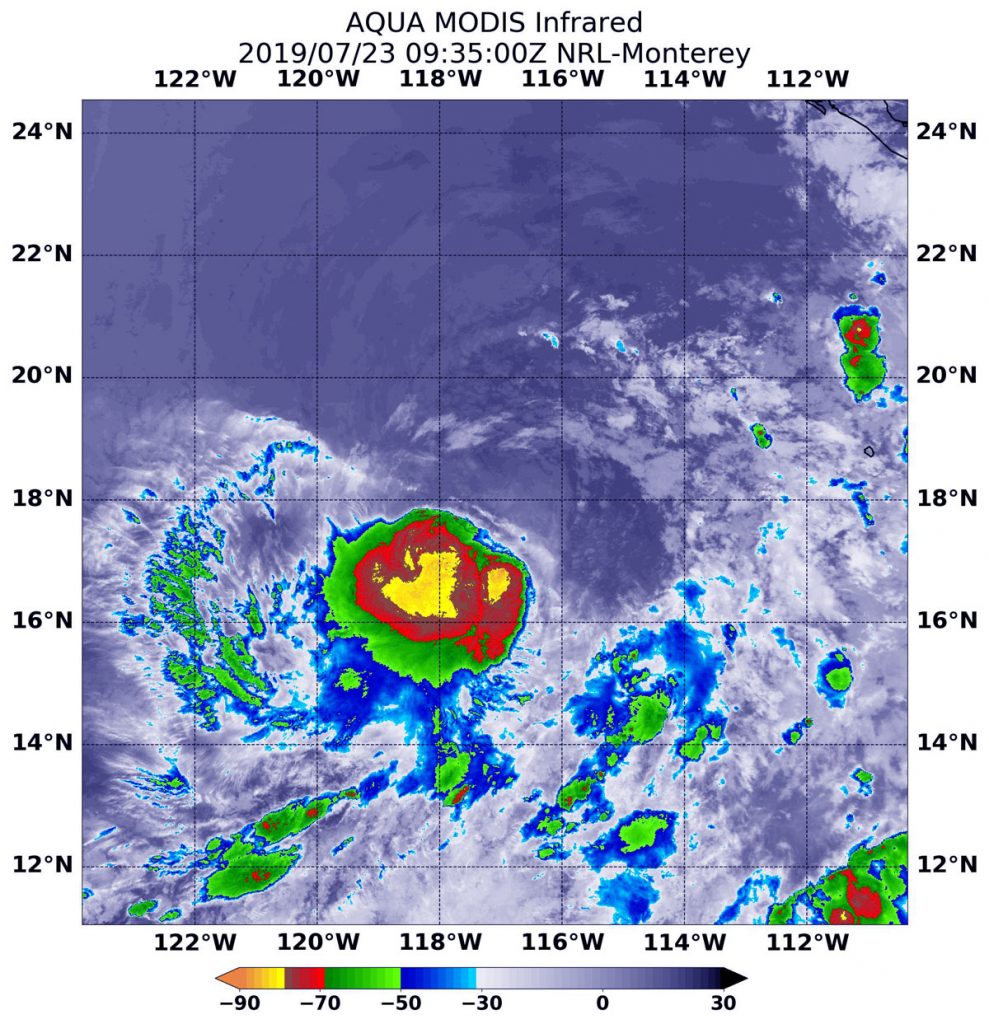
Suomi NPP passed over Dalila on July 24 and the Visible Infrared Imaging Radiometer Suite (VIIRS) instrument provided a visible image of the storm. The VIIRS image showed that strong convection and developing thunderstorms associated with the cyclone has continued to decrease in coverage this morning. Suomi NPP saw a limited area of strong thunderstorms where cloud top temperatures were as cold as minus 70 degrees Fahrenheit (minus 56.6 Celsius).  The National Hurricane Center said that there is still a broken band of convection over the southeastern portion of the circulation.

At 11 a.m. EDT (1500 UTC) on July 24, the National Hurricane Center or NHC said the center of Tropical Depression Dalila was located near latitude 20.5 degrees north and longitude 119.0 degrees west. That’s about 605 miles (975 km) west-southwest of the southern tip of Baja California, Mexico. The depression is moving toward the northwest near 7 mph (11 kph), and this motion is expected to continue today.  A turn toward the west-northwest is forecast to occur by Thursday, and that general motion should continue until the system dissipates in a few days. Maximum sustained winds are near 35 mph (55 kph) with higher gusts.

The NHC noted that Dalila will be moving into an area where sea surface temperatures are too cold to maintain the tropical cyclone and into a dry and more stable airmass.  NHC said, “This should result in weakening, and the system is expected to degenerate into a remnant low within 24 hours.”

Weakening is forecast during the next couple of days, and Dalila is expected to become a post-tropical remnant low tonight.

By Rob Gutro 
NASA’s Goddard Space Flight Center

TD3 – Atlantic Ocean

July 24, 2019 – NASA’s Terra Sees the End of Atlantic Tropical Depression 3

The third tropical depression of the Atlantic Ocean hurricane season didn’t last long. NASA’s Terra satellite provided an image of the system’s remnant clouds on July 23, 2019.

Terra image of TD3
NASA’s Terra satellite captured a visible image of the remnants of Tropical Depression 3 on July 24, 2019 at 1:30 p.m. EDT off the east coast of Florida. Credit: NASA Worldview

Tropical Depression 3 formed on Monday, July 22 and dissipated by 11 a.m. EDT (1500 UTC) on July 24, 2019.  At that time, the National Hurricane Center or NHC issued the final advisory on the remnants of the depression as it dissipated near latitude 29.0 degrees north and longitude 80.0 degrees west. It was centered about 60 miles (100 km) east-southeast of Daytona Beach, Florida and about 100 miles (160 km) southeast of St. Augustine, Florida. The remnants were moving toward the north near 17 mph (28 kph).  Maximum sustained winds were near 35 mph (55 kph) with higher gusts.

Two hours after the final update from the NHC, the MODIS instrument aboard NASA’s Terra satellite captured a visible image of the remnants of Tropical Depression 3. The MODIS image showed the  elongated remnant clouds of Tropical Depression 3 on July 24, 2019 at 1:30 p.m. EDT off the east coast of Florida.

By Rob Gutro
NASA’s Goddard Space Flight Center

TD3 – Atlantic Ocean

July 23, 2019  – NASA Analyzes New Atlantic Depression’s Tropical Rainfall

Tropical Depression 3 has formed about off the eastern coast of central Florida. NASA analyzed the rainfall that the new depression was generating using the Global Precipitation Measurement mission or GPM core satellite.

GPM image of TD3
The Global Precipitation Measurement mission or GPM core satellite passed over Tropical Depression 3 at 5:21 a.m. EDT (0921 UTC) on July 23. GPM found the heaviest rainfall (orange) was northeast of the center of circulation. There, rain was falling at a rate of 25 mm (about 1 inch) per hour. Credit: NASA/JAXA/NRL

The third depression of the Atlantic Ocean hurricane season developed around 5 p.m. EDT on July 22 about 120 miles (195 km) southeast of West Palm Beach, Florida.

The Global Precipitation Measurement mission or GPM core satellite passed over Tropical Depression 3 at 5:21 a.m. EDT (0921 UTC) on July 23. GPM found the heaviest rainfall was northeast of the center of circulation. There, rain was falling at a rate of 25 mm (about 1 inch) per hour. The National Hurricane Center noted in their discussion, “Although deep convection has redeveloped near and to the northeast of the low-level center, the overall convective appearance is somewhat ragged.”

On July 23, the National Hurricane Center or NHC noted at 5 a.m. EDT (0900 UTC), the center of Tropical Depression Three was located near latitude 27.0 degrees North and longitude 79.5 degrees west. That puts the center of Tropical Depression 3 (TD3) about 40 miles (70 km) east-northeast of West Palm Beach, Florida, and about 55 miles (90 km) northwest Freeport, Grand Bahama Island.

Maximum sustained winds had increased to near 35 mph (55 kph) with higher gusts. No significant increase in strength is anticipated and the depression is forecast to dissipate on Wednesday, July 24.

The depression is moving toward the north near 12 mph (19 kph).  A motion toward north-northeast with an increase in forward speed is expected tonight, followed by a turn toward the northeast on Wednesday.

On the NHC forecast track, the center of the depression should remain offshore the coast of the southeastern United States through Wednesday.

GPM is a joint mission between NASA and the Japan Aerospace Exploration Agency, JAXA.

For forecast updates on TD3, visit: www.nhc.noaa.gov.

By Rob Gutro
NASA’s Goddard Space Flight Center

Dalila (was TD5E) – Eastern Pacific

July 23, 2019 – NASA Finds Depression Strengthen into Tropical Storm Dalila

Satellite imagery on July 22 showed that wind shear was preventing the Eastern Pacific Ocean’s Tropical Depression 5 from consolidating and strengthening. Infrared imagery from NASA’s Aqua satellite on July 23 showed that the wind shear eased and the storm was able to strengthen.

Aqua image of Dalila
On July 23 at 5:35 a.m. EDT (0935 UTC), the MODIS instrument that flies aboard NASA’s Aqua satellite showed strongest storms (yellow) in Tropical Storm Dalila had cloud top temperatures as cold as minus 80 degrees Fahrenheit (minus 62.2 Celsius). Credit: NASA/NRL

NASA’s Aqua satellite used infrared light to analyze the strength of storms circled the center of circulation, a change from 24 hours before when wind shear pushed them away from the center. Now, the storm appears much more circular.

Infrared data provides temperature information, and the strongest thunderstorms that reach high into the atmosphere have the coldest cloud top temperatures.

On July 23 at 5:35 a.m. EDT (0935 UTC), the Moderate Imaging Spectroradiometer or MODIS instrument that flies aboard NASA’s Aqua satellite gathered infrared data on the strengthened Tropical Storm Dalila. Strongest thunderstorms had cloud top temperatures as cold as minus 80 degrees Fahrenheit (minus 62.2 Celsius). Cloud top temperatures that cold indicate strong storms with the potential to generate heavy rainfall.

At 5 a.m. EDT (0900 UTC) on July 23, the National Hurricane Center (NHC) the center of newly formed Tropical Storm Dalila was located near latitude 18.0 degrees north and longitude 117.3 degrees west. That is about 585 miles (945) km) southwest of the southern tip of Baja California, Mexico. There are no coastal watches or warnings in effect.

Maximum sustained winds have increased to near 40 mph (65 kph) with higher gusts.  The estimated minimum central pressure is 1005 millibars. Dalila is moving toward the north-northwest near 7 mph (11 kph). A turn to the northwest is anticipated on Wednesday, followed by a movement more to the west-northwest on Thursday and Friday.

NHC noted, “Some weakening is forecast to begin on Wednesday, and Dalila could degenerate into a remnant low on Thursday.”

For updated forecasts, visit: https://www.nhc.noaa.gov

By Rob Gutro
NASA’s Goddard Space Flight Center

TD5E (Eastern Pacific)

July 22, 2019 – NASA Sees Outside Winds Affecting New Tropical Eastern Pacific Depression

A new tropical depression formed in the Eastern Pacific Ocean, far enough away from the coast so that no coastal warnings are needed. Infrared imagery from NASA’s Aqua satellite shows that Tropical Depression 5E’s strongest storms were southwest of its center of circulation because of outside winds.

Aqua image of TD5E
On July 22 at 4:50 a.m. EDT (0850 UTC) the MODIS instrument that flies aboard NASA’s Aqua satellite showed strongest storms in Tropical Depression 5# were south of the elongated center where cloud top temperatures were as cold as minus 70 degrees Fahrenheit (red) (minus 56.6 Celsius). Credit: NASA/NRL

NASA’s Aqua satellite used infrared light to analyze the strength of storms and found the bulk of them in the southern quadrant. Infrared data provides temperature information, and the strongest thunderstorms that reach high into the atmosphere have the coldest cloud top temperatures.

On July 22 at 4:50 a.m. EDT (0850 UTC), the Moderate Imaging Spectroradiometer or MODIS instrument that flies aboard NASA’s Aqua satellite gathered infrared data on Tropical Depression 5E. Strongest thunderstorms had cloud top temperatures as cold as minus 70 degrees Fahrenheit (minus 56.6 Celsius). Cloud top temperatures that cold indicate strong storms with the potential to generate heavy rainfall. Those strongest storms were southwest of the center of circulation because of vertical wind shear (winds blowing at different speeds at different levels of the atmosphere).  The National Hurricane Center noted, “It appears that northeasterly shear is keeping much of the convection displaced to the west of the center of circulation.”

At 11 a.m. EDT (1500 UTC) on July 22, the National Hurricane Center (NHC) said the center of Tropical Depression Five-E was located near latitude 15.9 degrees North and longitude 116.3 degrees west. That’s about 640 miles (1.025 km) southwest of the southern tip of Baja California, Mexico.

The depression is moving toward the north near 9 mph (15 kph) and this motion is expected to continue for the next day or so, with a gradual turn to the northwest by midweek. Maximum sustained winds are near 35 mph (55 kph) with higher gusts. The estimated minimum central pressure is 1006 millibars.

NHC noted “Although convection [and thunderstorm development] has increased this morning, ] the [wind[shear is preventing the inner core of the depression from becoming better established.” Some slight strengthening is possible over the next couple of days, and the depression is expected to become a tropical storm later today or tonight.

For updated forecasts, visit: https://www.nhc.noaa.gov

By Rob Gutro
NASA’s Goddard Space Flight Center

Danas (Northwestern Pacific Ocean)

July 19, 2019 – NASA Sees Tropical Storm Danas Track through the East China Sea

NASA’s Aqua satellite provided a visible image of Tropical Storm Danas moving through the East China Sea on July 19, 2019.

Aqua image of Danas
On July 19, 2019, the MODIS instrument aboard NASA’s Aqua satellite provided a visible image of Tropical Storm Danas in the East China Sea. Credit: NASA Worldview, Earth Observing System Data and Information System (EOSDIS)

On July 19, the Moderate Resolution Imaging Spectroradiometer or MODIS instrument aboard NASA’s Aqua satellite captured a visible image of Danas that showed a large storm in the East China Sea. The storm is large and extends northeast into the Yellow Sea, east of the Korean Peninsula. The MODIS image also showed bands of strongest thunderstorms were east of the storm’s center of circulation.

At 11 a.m. EDT (1500 UTC), the center of Danas was located near latitude 32.3 degrees north and longitude 125.1 degrees west. Danas was about 266 nautical miles south-southwest of Kunsan Air Base, South Korea. Danas was moving to the north-northeast and had maximum sustained winds near 45 knots (52 mph/83 kph).

The Joint Typhoon Warning Center expects Danas to approach the southwestern coast of South Korea by 11 p.m. EDT (0300 UTC on July 20); it is forecast to weaken due to frictional effects moving over land. Significant weakening is forecast after landfall.

By Rob Gutro
NASA’s Goddard Space Flight Center

Danas (Northwestern Pacific Ocean)

July 18, 2019 – NASA’s Aqua Satellite Finds Tropical Storm Danas Over Ryuku Islands

NASA’s Aqua satellite found Tropical Storm Danas moving over Japan’s Ryuku island chain in the Northwestern Pacific Ocean.

Aqua image of Danas
On July 16, 2019, the MODIS instrument aboard NASA’s Aqua satellite provided a visible image of Tropical Depression Danas in the Northwestern Pacific Ocean. Credit: NASA Worldview, Earth Observing System Data and Information System (EOSDIS)

The Ruyku islands include Osumi, Tokara, Amami, Okinawa, Yonaguni and the Sakishima Islands. The island chain extends southwest from Kyushu to Taiwan.

On July 18 at 1:20 a.m. EDT (0520 UTC), the Moderate Resolution Imaging Spectroradiometer or MODIS instrument aboard NASA’s Aqua satellite provided a visible image of Danas that showed a large storm over Japan’s Ryuku Island chain. The image shows that Danas is being affected by vertical wind shear, where winds at different levels of the atmosphere around the tropical cyclone are pushing against it and affecting the storm’s shape. The Joint Typhoon Warning Center noted, “A large area of deep convection sheared 60 nautical miles southward of a consolidating low-level center.

At 11 a.m. EDT (1500 UTC), on July 18, the center of Danas was located near latitude 26.7 degrees north and longitude 123.6 degrees west. Danas was about 215 nautical miles west of Kadena Air Base, Okinawa, Japan. Danas was moving to the north and had maximum sustained winds near 40 knots (46 mph/74 kph).

The Joint Typhoon Warning Center expects Danas to veer to the north-northeast and run parallel to the east coast of China, moving into the Yellow Sea and across the Korean peninsula. Danas is expected to dissipate after it moves into the Sea of Japan.

By Rob Gutro
NASA’s Goddard Space Flight Center

Danas – Northwestern Pacific Ocean

July 17, 2019 – NASA Finds Tropical Storm Danas Northeast of the Philippines

NASA’s Aqua satellite provided a visible image of Tropical Storm Danas as it continued to move north and away from the Philippines.

Aqua image of Danas
On July 17, 2019, the MODIS instrument aboard NASA’s Aqua satellite provided a visible image of Tropical Storm Danas in the Northwestern Pacific Ocean, located just northeast of the Philippines. Credit: NASA Worldview, Earth Observing System Data and Information System (EOSDIS)

On July 17 at 12:40 a.m. EDT (0440 UTC), the Moderate Resolution Imaging Spectroradiometer or MODIS instrument aboard NASA’s Aqua satellite captured a visible look at Danas. The strongest thunderstorms appeared southeast of the center of circulation in the MODIS image. Danas was located northeast of Luzon, Philippines, in the Philippine Sea.

At 11 a.m. EDT (1500 UTC) on July 17, the center of Tropical Storm Danas was located near latitude 21.1 degrees north and longitude 124.0 degrees east. The center of Danas was about 421 nautical miles south-southwest of Kadena Air Base, Okinawa Island, Japan. Danas was moving to the north-northeast and had maximum sustained winds near 35 knots (40 mph/74 kph).

Danas is forecast to move north over the next couple of days and strengthen. Its center is expected to pass near Ishigakijima island on July 18.

By Rob Gutro
NASA’s Goddard Space Flight Center

Barry (was TD2) – Atlantic Ocean

July 17, 2019 – NASA Tracking Post-Tropical Cyclone Barry to Indiana

NASA’s Aqua satellite provided a visible image of the clouds associated with Post-Tropical Cyclone Barry moving through the mid-Mississippi Valley on July 16, and headed toward the Ohio Valley.

Aqua image of Barry
On July 16, 2019, the MODIS instrument aboard NASA’s Aqua satellite provided a visible image of Post-Tropical Cyclone Barry in the Mississippi Valley, moving toward the Ohio Valley. Credit: NASA Worldview, Earth Observing System Data and Information System (EOSDIS)

On July 16, the Moderate Resolution Imaging Spectroradiometer or MODIS instrument aboard NASA’s Aqua satellite captured a visible look at Barry. Strongest thunderstorms appeared over northwestern Arkansas, western Tennessee and southwestern Kentucky at the time of the image. Barry’s remnant clouds were also spreading into southern Indiana.

By 5 a.m. EDT (0900 UTC) on July 17, NOAA’s National Weather Service Weather Prediction Center in College Park, Maryland noted that Barry’s center of circulation had moved to about 90 miles (150 km) northeast of Indianapolis, Indiana. The center of Post-Tropical Cyclone Barry was located near latitude 40.8 degrees north and longitude 85.3 degrees west. The post-tropical cyclone is moving toward the east-northeast near 22 mph (35 kph) and this motion is expected to continue through tonight. Maximum sustained winds are near 15 mph (30 kph) with higher gusts. Little change in strength is forecast during the next 48 hours. The estimated minimum central pressure is 1010 millibars (29.83 inches).

Flash flood watches are in effect across portions of the northern Mid-Atlantic. Barry is expected to produce additional rain accumulations of 1 to 3 inches from portions of the Upper Ohio and Upper Tennessee Valleys into the northern Mid-Atlantic and southern New England.

By Rob Gutro
NASA’s Goddard Space Flight Center

Barry (was TD2) – Atlantic Ocean

July 16, 2019 – GPM IMERG Animation of Rainfall Accumulations from  Hurricane Barry

This 6-day animation shows the heavy precipitation that Hurricane Barry (2019) producing from July 11 to 16 in the Gulf of Mexico and the South Central U.S.  While forecasters were initially concerned that the largest accumulations would extend far over land, this animation shows that the largest accumulations remained mostly off shore.  The precipitation estimates shown in this animation come from a near-realtime merging and calibration of observations made by the satellites of many nations.  The IMERG algorithm, run at NASA Goddard, performs this data merging.  The left side of the movie shows the total accumulation starting in the early hours of July 11, 2019, while the right side shows the accumulation during just the most recent 3-hour period.
https://twitter.com/NASARain/status/1151539201621536768