Jerry – North Atlantic Ocean

Sep. 25, 2019 – NASA-NOAA Satellite Finds Jerry Now a Post-Tropical Storm

NASA-NOAA’s Suomi NPP satellite passed over Jerry and provided forecasters with a view of its structure that helped confirm it is now post-tropical.

Suomi NPP Image of Jerry
On Sept. 24 at 2:06 p.m. EDT (1806 UTC) NASA-NOAA’s Suomi NPP satellite passed over Post-Tropical Cyclone Jerry and it appeared as a swirl of clouds in the Atlantic Ocean. Credit: NASA/NOAA/NRL

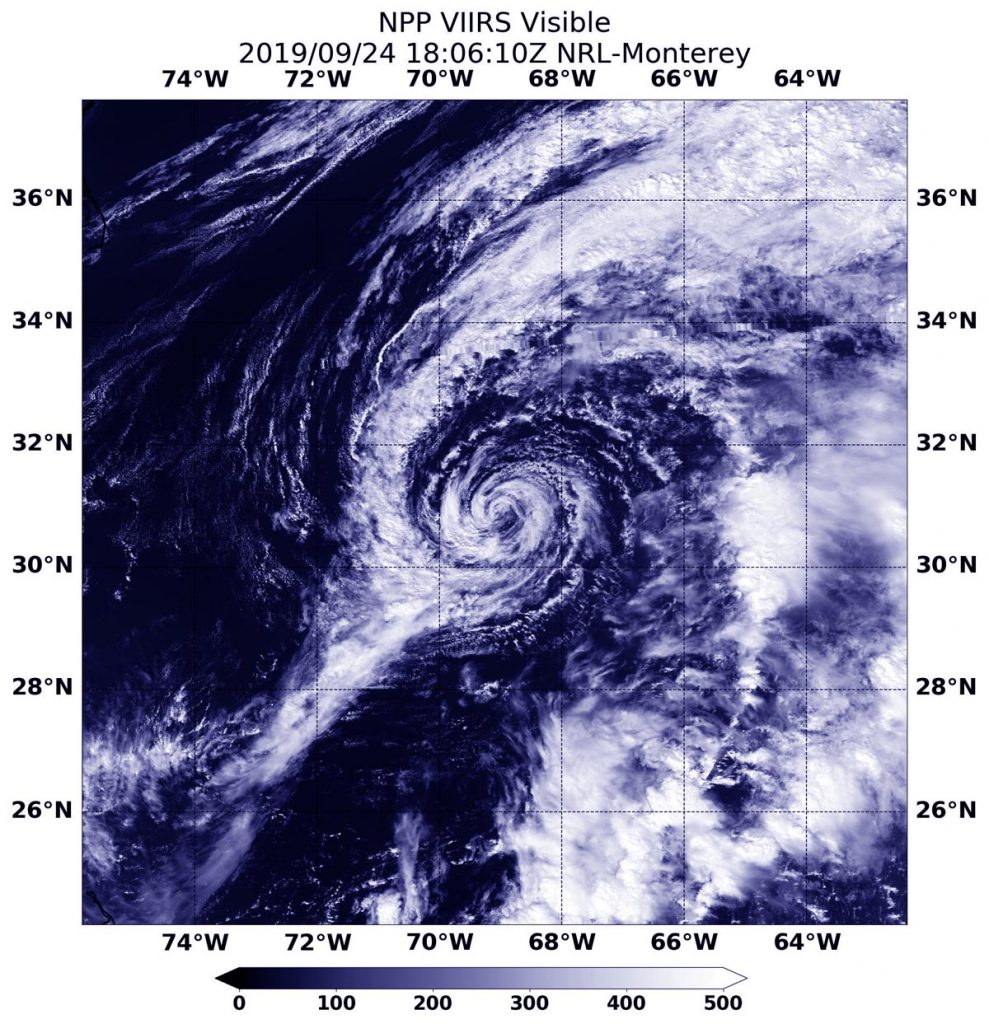
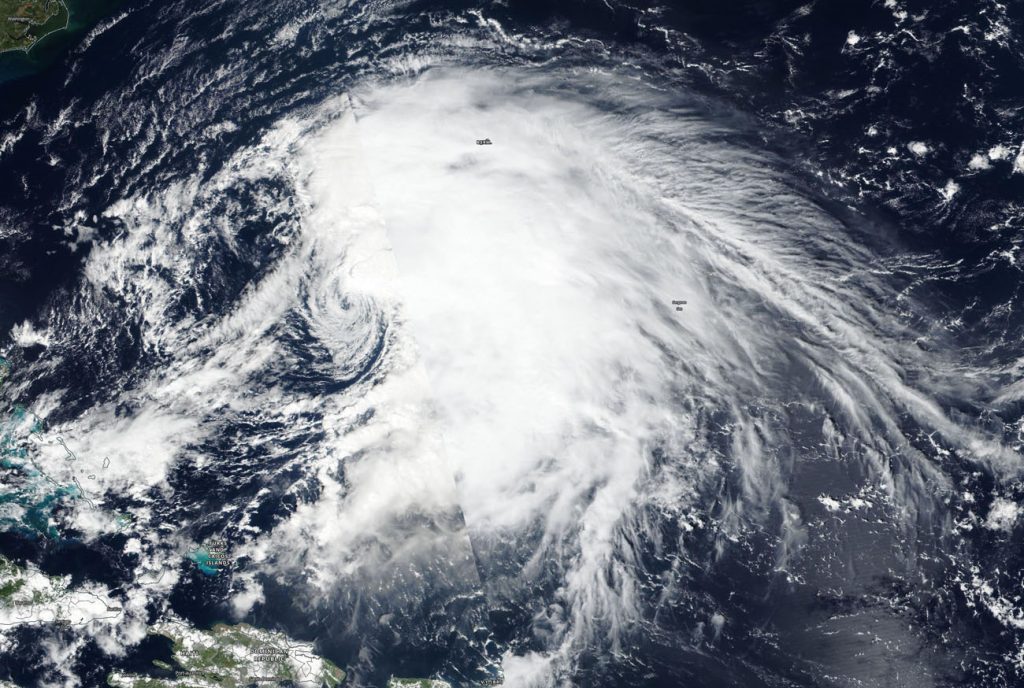
On Sept. 25 at 12:48 p.m. EDT (1806 UTC), the Visible Infrared Imaging Radiometer Suite (VIIRS) instrument aboard Suomi NPP provided a visible image of Jerry. The VIIRS image showed the storm as swirls of clouds with no organized deep convection developing strong thunderstorms. NOAA’s National Hurricane Center or NHC said since around 11 a.m. EDT (1500 UTC) yesterday [Sept. 24], that there was a lack of strong thunderstorms which had been seen in earlier satellite imagery, including from NASA’s Aqua and Terra satellites. As a result, Jerry was designated as a post-tropical cyclone.

A Post-Tropical Storm is a generic term for a former tropical cyclone that no longer possesses sufficient tropical characteristics to be considered a tropical cyclone. Former tropical cyclones can become fully extratropical, subtropical, or remnant lows which are three classes of post-tropical cyclones. In any case, they no longer possesses sufficient tropical characteristics to be considered a tropical cyclone. However, post-tropical cyclones can continue carrying heavy rains and high winds.

A Tropical Storm Warning was in effect for Bermuda for Sept. 25. At 8 a.m. EDT (1200 UTC), the center of Post-Tropical Cyclone Jerry was located near latitude 32.0 degrees north and longitude 67.4 degrees west. The post-tropical cyclone is moving toward the northeast at near 7 mph (11 kph). Maximum sustained winds are near 45 mph (75 km/h) with higher gusts.

On the forecast track, the center of Jerry is expected to pass near Bermuda later today. Jerry is expected to produce 1 inch or less of rainfall across Bermuda through tonight. Swells generated by Jerry will continue to affect Bermuda during the next few days. Gradual weakening is expected during the next few days.

Hurricanes are the most powerful weather event on Earth. NASA’s expertise in space and scientific exploration contributes to essential services provided to the American people by other federal agencies, such as hurricane weather forecasting.

For updated forecasts. visit: www.nhc.noaa.gov

By Rob Gutro 
NASA’s Goddard Space Flight Center

Kiko – Eastern Pacific Ocean

Sep. 25, 2019 – NASA Finds Light Rain in Former Hurricane Kiko’s Remnants

Former Hurricane Kiko is now just a remnant low pressure area that has slid into the Central Pacific Ocean. The Global Precipitation Measurement mission or GPM satellite provided a look at the rainfall occurring within the low.

GPM image of Kiko
The GPM’s core satellite passed over Kiko’s remnants on Sept. 25 at 3:51 a.m. EDT (0751 UTC). GPM found scattered light rain (light blue) from the remnant clouds falling at less than 0.2 inches (less than 5 millimeters) per hour. Credit: NASA/NRL

Kiko weakened to a remnant low pressure area by 11 p.m. EDT on Sept. 24. At the time, it was about 950 miles (1.530 km) east of Hilo, Hawaii, near 19.2 degrees north latitude and 140.5 degrees west longitude. Maximum sustained winds at the time were near 35 mph (55 kph) and weakening. That also marked the last advisory from NOAA’s National Hurricane Center.

The GPM’s core satellite passed over Kiko’s remnants on Sept. 25 at 3:51 a.m. EDT (0751 UTC). GPM found scattered light rain from the remnant clouds falling at less than 0.2 inches (less than 5 millimeters) per hour. Forecasters at NOAA’s National Hurricane Center or NHC incorporate the rainfall data into their forecasts.

On Sept. 25, 2019, the Tropical Weather Discussion from NHC at 6:05 a.m. EDT (10:05 UTC) noted that Post-Tropical Cyclone Kiko is west of 140 degrees west longitude and in the Central Pacific Ocean. Kiko continues to move west.

The air-pressure gradient created between Kiko (a low pressure area) and high pressure north of the area is supporting moderate to fresh trade winds. Kiko’s remnants are producing a large area of ocean swells to 8 feet. Those ocean swells are expected to lessen as Kiko’s remnants dissipate.

Hurricanes are the most powerful weather event on Earth. NASA’s expertise in space and scientific exploration contributes to essential services provided to the American people by other federal agencies, such as hurricane weather forecasting.

GPM is a joint mission between NASA and the Japan Aerospace Exploration Agency, JAXA.

By Rob Gutro
NASA’s Goddard Space Flight Center

Hikaa – Northern Indian Ocean

Sep. 24, 2019 – Cyclone Hikaa Hits Oman (Earth Observatory update)

A few tropical cyclones spin into the northwestern reaches of the Arabian Sea each, and some bring damaging winds and rain into the Arabian Peninsula. That was the case on September 24, 2019, when Tropical Cyclone Hikaa made landfall over Oman.

Hikaa hitting Oman
NASA Earth Observatory image by Joshua Stevens, using MODIS data from NASA EOSDIS/LANCE and GIBS/Worldvie

The Moderate Resolution Imaging Spectroradiometer (MODIS) on NASA’s Terra satellite acquired this image at 10:45 a.m. Gulf Standard Time (06:45 Universal Time) as the storm’s outer bands moved over Oman. Later that day, the India Meteorological Department reported maximum winds between 120-130 kilometers (75-80 miles) per hour. That’s the equivalent of a category 1 storm on the Saffir-Simpson wind scale.

After encountering the coast of Oman and the dry air over the peninsula, the storm continued moving westward and weakened. Forecasters predicted heavy rainfall in some coastal areas, and officials advised people to stay away from low-lying areas. They also warned that rough seas could be dangerous for fishing boats.

Of all tropical cyclones that occur around the planet each year, only 7 percent are in the North Indian Ocean. They infrequently brush the Arabian Peninsula, and the region can go years without a storm. That said, 2018 brought more storms than usual, with three significant cyclones—Sagar, Mekunu, and Luban—bringing damaging wind and rain to Yemen and Oman. Cyclones tend to occur here in spring and autumn, so the final count for 2019 remains to be seen.

NASA Earth Observatory image by Joshua Stevens, using MODIS data from NASA EOSDIS/LANCE and GIBS/Worldview. Story by Kathryn Hansen.

For additional information and resources visit: https://earthobservatory.nasa.gov/images/145645/cyclone-hikaa-hits-oman?src=eoa-iotd

Hikaa – Northern Indian Ocean

Sep. 24, 2019 – NASA-NOAA Satellite Finds Cyclone Hikaa at Oman’s Coast

NASA-NOAA’s Suomi NPP satellite passed over the Arabian Sea in the Northern Indian Ocean and provided forecasters with a view of Cyclone Hikaa’s structure. Hikaa is at hurricane strength along Oman’s coast.

Suomi NPP image of Hikaa
On Sept. 24 at 5:30 a.m. EDT (0930 UTC), NASA-NOAA’s Suomi NPP satellite captured a visible image of Tropical Storm Hikaa along the coast of Oman in the Northern Indian Ocean. Credit: NASA/NOAA/NRL

On Sept. 24 at 5:30 a.m. EDT (0930 UTC), the Visible Infrared Imaging Radiometer Suite (VIIRS) instrument aboard Suomi NPP provided a visible image of Cyclone Hikaa. The VIIRS image showed that the storm was close to the eastern coast of Oman and its center was just south of Masirah Island. Hikaa’s western quadrant was over the coast bringing gusty winds and heavy rainfall.

At 11 a.m. EDT (1500 UTC) on Sept. 24, the center of Cyclone Hikaa was located near latitude 19.9 degrees north and longitude 58.4 degrees east. That puts Hikaa’s center just 38 nautical miles southwest of Masirah Island. Hikaa was moving to the west and maximum sustained winds have increased to near 75 knots (86 mph/139 kph) with higher gusts.

Hikaa is approaching landfall in Oman near Duqm. The storm will dissipate inland.

Hurricanes are the most powerful weather event on Earth. NASA’s expertise in space and scientific exploration contributes to essential services provided to the American people by other federal agencies, such as hurricane weather forecasting.

By Rob Gutro 
NASA’s Goddard Space Flight Center

Kiko – Eastern Pacific Ocean

Sep. 24, 2019 – NASA Satellite Looks at Tropical Storm Kiko’s Cloud Heights, Temperatures

NASA’s Aqua Satellite provides a variety of data on tropical cyclones including cloud heights and cloud top temperatures. Aqua examined those factors in Tropical Storm Kiko before wind shear began to affect it and weaken the storm.

Aqua image of Kiko
On Sept. 23, the MODIS instrument that flies aboard NASA’s Aqua provided an image of cloud top temperatures and heights of Tropical Storm Kiko. Purple indicates the highest cloud tops with the coldest temperatures. Credit: NASA Worldview, Earth Observing System Data and Information System (EOSDIS).

Tropical cyclones are made up of hundreds of thunderstorms. By analyzing the heights of thunderstorms the their cloud top temperatures, forecasters can tell if a storm is strengthening or weakening. The higher the cloud tops, the stronger the uplift in a storm. That rising air helps thunderstorms develop.  As storms go higher, it is an indication that the storm is strengthening. Conversely, if over a period of time, satellite data shows cloud tops falling and warming, it is an indication the storm is weakening because there’s not as strong as an uplift or rising air in the storm.

On Sept. 23, the Moderate Imaging Spectroradiometer or MODIS instrument that flies aboard NASA’s Aqua satellite measured clouds heights and temperatures. Imagery showed the initial presence of an eye developing and strong thunderstorms developing around the southern quadrant. The imagery showed the highest cloud tops, higher than 12,000 meters (7.65 miles) were located around the developing eye and mostly south of the center. As the day progressed, high cirrus clouds covered the eye-like feature.

Aqua data also found that cloud top temperatures were as cold as or colder than 200 Kelvin (minus 99.6 degrees Fahrenheit/minus 73.1 degrees Celsius) around in those storms. NASA research has shown that cloud top temperatures that cold have the capability to generate heavy rainfall.

On Sept. 24, strong southwesterly wind shear between 40 and 45 knots caused Kiko’s convection and developing thunderstorms to become displaced from the low-level center by about 70 nautical miles. That has weakened the storm. The speed of that wind shear is expected to increase as Kiko moves westward, and that means the storm will weaken.

NOAA’s National Hurricane Center or NHC said at 11 a.m. EDT (1500 UTC) on Sept. 24 the center of Tropical Storm Kiko was located near latitude 17.9 degrees north and 138.9 degrees west longitude. That puts the center about 1,065 miles (1,715 km) east of Hilo, Hawaii. Kiko is moving toward the northwest at near 10 mph (17 kph), and this motion is expected to continue through the day. Maximum sustained winds are near 45 mph (75 kph) with higher gusts. Tropical-storm-force winds extend outward up to 70 miles (110 km) from the center. The estimated minimum central pressure is 1004 millibars.

On the forecast track, Kiko will move into the central Pacific basin later in the day on Sept. 24. Additional weakening is forecast, and Kiko is likely to become a tropical depression by tonight.  It should then degenerate into a remnant low on Wednesday. Sept. 25.

The Aqua satellite cloud height and temperature data was provided by NASA’s Worldview product at NASA’s Goddard Space Flight Center, Greenbelt, Md.

Hurricanes are the most powerful weather event on Earth. NASA’s expertise in space and scientific exploration contributes to essential services provided to the American people by other federal agencies, such as hurricane weather forecasting.

For updated forecasts, visit: www.nhc.noaa.gov

By Rob Gutro
NASA’s Goddard Space Flight Center


Jerry – North Atlantic Ocean

Sep. 24, 2019 – NASA-NOAA Satellite Finds Wind Shear Taking a Toll on Tropical Storm Jerry

Tropical Storm Jerry continued to weaken as warnings were in effect for Bermuda on Sept. 24.  Jerry appeared less organized on visible imagery from NASA-NOAA’s Suomi NPP satellite because wind shear was taking its toll on the storm.

Suomi NPP image of Jerry
On Sept. 24, NASA-NOAA’s Suomi NPP satellite passed over the western Atlantic Ocean and provided forecasters with this visible image of Tropical Storm Jerry that shows wind shear is affecting the storm. Credit: NASA/NOAA/NRL

The shape of the storm is a clue to forecasters that a storm is either strengthening or weakening. If a storm takes on a more rounded shape it is getting more organized and strengthening. Conversely, if it becomes less rounded or elongated, it is a sign the storm is weakening. Jerry is becoming elongated and weakening because of outside winds, known as wind shear.

In general, wind shear is a measure of how the speed and direction of winds change with altitude. Tropical cyclones are like rotating cylinders of winds. Each level needs to be stacked on top each other vertically in order for the storm to maintain strength or intensify. Wind shear occurs when winds at different levels of the atmosphere push against the rotating cylinder of winds, weakening the rotation by pushing it apart at different levels.

There are a couple of factors that are causing Tropical Storm Jerry to weaken. NOAA’s National Hurricane Center (NHC) reported that strong vertical wind shear and an intruding dry, stable atmosphere associated with a high amplitude mid- to upper-level area of elongated low pressure moving off of the east coast of the U.S. is finally taking its toll on Jerry.

The Visible Infrared Imaging Radiometer Suite (VIIRS) instrument aboard Suomi NPP provided a visible image of Jerry on Sept. 24. The VIIRS image showed Jerry’s cloud pattern has begun to deteriorate. Strong thunderstorm development is now only occurring on the northern quadrant of the tropical cyclone. The VIIRS image showed that the bulk of clouds and precipitation were being pushed northeast of Jerry’s center as a result of wind shear.

On Sept. 24, a Tropical Storm Warning was in effect for Bermuda. At 8 a.m. EDT (1200 UTC), the center of Tropical Storm Jerry was located near latitude 30.5 degrees north and longitude 68.9 degrees west. Jerry was 275 miles (440 km) west-southwest of Bermuda and moving toward the north at near 8 mph (13 kph). Maximum sustained winds are near 60 mph (95 kph) with higher gusts. The estimated minimum central pressure is 993 millibars.

Gradual weakening is forecast during the next few days. A turn to the northeast is expected by tonight, followed by a turn to the east-northeast on Wednesday, Sept. 25.  On the forecast track, the center of Jerry is expected to pass near Bermuda on Wednesday.

Hurricanes are the most powerful weather event on Earth. NASA’s expertise in space and scientific exploration contributes to essential services provided to the American people by other federal agencies, such as hurricane weather forecasting.

For updated forecasts. Visit: www.nhc.noaa.gov

By Rob Gutro 
NASA’s Goddard Space Flight Center

Lorenzo – Atlantic Ocean

Sep. 24, 2019 – NASA-NOAA Satellite Find Tropical Storm Lorenzo Organizing

Tropical Storm Lorenzo continued to strengthen and appeared more organized on visible imagery from NASA-NOAA’s Suomi NPP satellite.

Suomi NPP image of Lorenzo
On Sept. 24, NASA-NOAA’s Suomi NPP satellite passed over the eastern Atlantic Ocean and provided forecasters with this visible image of a more organized Tropical Storm Lorenzo. Credit: NASA/NOAA/NRL

The shape of the storm is a clue to forecasters that a storm is either strengthening or weakening. If a storm takes on a more rounded shape it is getting more organized and strengthening. Conversely, if it becomes less rounded or elongated, it is a sign the storm is weakening.

On Sept. 24, the Visible Infrared Imaging Radiometer Suite (VIIRS) instrument aboard Suomi NPP provided a visible image of Lorenzo and showed it had become more organized over the previous 24 hours. The VIIRS image showed that many curved bands of thunderstorms have formed around the low-level center and there is a newly formed central dense overcast. A microwave image taken in the overnight hours showed that Lorenzo already had a very small central core.

NOAA’s National Hurricane Center or NHC said Lorenzo is located near latitude 12.0 degrees north and longitude 28.0 degrees west. Lorenzo is centered about 301 miles (500 km) southwest of the southwestern most Cabo Verde Islands. Lorenzo is moving toward the west-northwest near 16 mph (26 kph). This general motion with some decrease in forward speed is expected for the next couple of days, followed by a turn to the northwest on Thursday. Maximum sustained winds have increased to near 65 mph (100 kph) with higher gusts. The estimated minimum central pressure is 999 millibars.

Conditions seem to be ripe for further intensification because Lorenzo is moving over warm waters, is surrounded by humid mid-level air, and is only dealing with weak to moderate wind shear (outside winds that if strong enough can weaken a storm). Lorenzo is forecast to become a hurricane later today, Sept. 24. NHC forecasters said that Lorenzo could become a major hurricane on Thursday, Sept. 26.

Hurricanes are the most powerful weather event on Earth. NASA’s expertise in space and scientific exploration contributes to essential services provided to the American people by other federal agencies, such as hurricane weather forecasting.

For updated forecasts. Visit: www.nhc.noaa.gov

By Rob Gutro 
NASA’s Goddard Space Flight Center

Karen – Atlantic Ocean

Sep. 24, 2019 – NASA Sees Karen Regain Tropical Storm Status

NASA-NOAA’s Suomi NPP satellite passed over the Caribbean Sea and used infrared light to obtain temperature information about Karen’s cloud tops. Data showed powerful thunderstorms re-developed in around the storm’s center as it strengthened back into a tropical storm.

Suomi NPP image of Karen
NASA-NOAA’s Suomi NPP satellite passed over Tropical Storm Karen and the VIIRS instrument aboard captured this image of the storm on Sept. 24 at 2:48 a.m. EDT (0648 UTC). Suomi NPP found that the strongest thunderstorms around the center had cloud top temperatures as cold as minus 80 degrees Fahrenheit (minus 62.2 degrees Celsius) appearing in yellow. Those storms were surrounded by strong storms with cloud top temperatures as cold as (red) minus 70 degrees Fahrenheit (minus 56.6 Celsius). Credit: NASA/NOAA/NRL

NASA-NOAA’s Suomi NPP satellite used infrared light to analyze the strength of storms within the structure of what was Tropical Depression Karen. Infrared data provides temperature information, and the strongest thunderstorms that reach high into the atmosphere have the coldest cloud top temperatures. This data is helpful to forecasters because storms are not uniform around tropical cyclones and it helps pinpoint where the strongest storms are located.

On Sept. 24 at 2:48 a.m. EDT (0648 UTC), the Visible Infrared Imaging Radiometer Suite (VIIRS) instrument aboard the Suomi NPP satellite found that the strongest thunderstorms around Karen’s center had cloud top temperatures as cold as minus 80 degrees Fahrenheit (minus 62.2 degrees Celsius) appearing in yellow. Those storms were surrounded by strong storms with cloud top temperatures as cold as minus 70 degrees Fahrenheit (minus 56.6 Celsius).

NASA research has shown that storms with cloud top temperatures as cold as or colder than minus 63 degrees Fahrenheit (minus 53 degrees Celsius) have the ability to produce heavy rainfall. Karen has a large area of storms around the center with temperatures colder than that threshold.

At 8 a.m. EDT (1200 UTC) those heavy rains were already lashing Virgin Islands, Culebra, and Vieques.

A Tropical Storm Warning is in effect for U.S. Virgin Islands, Puerto Rico, including Vieques and Culebra, and the British Virgin Islands. NOAA’s National Hurricane Center (NHC) said Karen is expected to produce the following rainfall accumulations through Wednesday:  Puerto Rico and the Virgin Islands are forecast to get from 2 to 4 inches of rain with isolated totals to 8 inches. The Leeward Islands are expected to receive between 1 to 3 inches, with isolated totals to 5 inches.

At 8 a.m. EDT (1200 UTC), the center of Tropical Storm Karen was located by an Air Force Reserve Hurricane Hunter aircraft near latitude 17.2 degrees north and longitude 65.8 degrees west. That is about 85 miles (120 km) south of San Juan, Puerto Rico. Karen is moving toward the north at near 7 mph (11 kph), and this general motion is expected to continue today. Maximum sustained winds are near 40 mph (65 kph) with higher gusts. The minimum central pressure just reported by the Hurricane Hunter aircraft is 1006 millibars.

NHC said that strengthening is forecast during the next 48 hours. A north-northeastward motion is forecast tonight through Wednesday night. On the forecast track, the center of Karen will pass near or over Puerto Rico and the Virgin Islands today, and then move over the western Atlantic tonight and Wednesday.

Hurricanes are the most powerful weather event on Earth. NASA’s expertise in space and scientific exploration contributes to essential services provided to the American people by other federal agencies, such as hurricane weather forecasting.

By Rob Gutro
NASA’s Goddard Space Flight Center

Hikaa – Northern Indian Ocean

Sep. 23, 2019 – NASA Finds Heavy Rain Potential in Tropical Storm Hikaa

The Northern Indian Ocean has generated a new tropical cyclone. NASA provided an infrared look a recently formed Tropical Storm Hikaa, moving through the Arabian Sea.

Aqua image of Hikaa
On Sept. 23 at 4:05 a.m. EDT (0905 UTC) NASA’s Aqua satellite analyzed the storm using the Atmospheric Infrared Sounder or AIRS instrument. AIRS found coldest cloud top temperatures as cold as or colder than (purple) minus 63 degrees Fahrenheit (minus 53 degrees Celsius) in a band of thunderstorms west and south around Hikaa’s center. Credit: NASA JPL/Heidar Thrastarson

One of the ways NASA researches tropical cyclones is by using infrared data that provides temperature information. The AIRS instrument aboard NASA’s Aqua satellite captured a look at those temperatures in Hikaa and gave insight into the storm’s rainfall potential. Cloud top temperatures provide information to forecasters about where the strongest storms are located within a tropical cyclone. Tropical cyclones do not always have uniform strength, and some sides have stronger sides than others. The stronger the storms, the higher they extend into the troposphere, and the colder the cloud temperatures are.

NASA provides data to forecasters around the world so they can incorporate that data into their forecasting.

On Sept. 23 at 4:05 a.m. EDT (0905 UTC) NASA’s Aqua satellite analyzed the storm using the Atmospheric Infrared Sounder or AIRS instrument. AIRS found coldest cloud top temperatures as cold as or colder than minus 63 degrees Fahrenheit (minus 53 degrees Celsius) from west to south around Hikaa’s center. NASA research has shown that cloud top temperatures that cold indicate strong storms that have the capability to create heavy rain.

At 11 a.m. EDT (1500 UTC), The Joint Typhoon Warning Center said the center of Tropical Hikaa was located near latitude 20.2 degrees north and longitude 65.5 degrees east. It is located about 265 miles east of Masirah Island, Oman. The tropical storm was moving toward the west. Maximum sustained winds are near 60 knots (69 mph/111 kph) with higher gusts.

Hikaa will strengthen slightly before making landfall in Oman after a day or so.

The AIRS instrument is one of six instruments flying onboard NASA’s Aqua satellite, launched on May 4, 2002.

Hurricanes are the most powerful weather event on Earth. NASA’s expertise in space and scientific exploration contributes to essential services provided to the American people by other federal agencies, such as hurricane weather forecasting.

By Rob Gutro
NASA’s Goddard Space Flight Center  


Kiko – Eastern Pacific Ocean

Sep. 23, 2019 – NASA-NOAA Satellite Sees a Tight Circulation in Tropical Storm Kiko

NASA-NOAA’s Suomi NPP satellite imagery revealed that Tropical Storm Kiko had a tight circulation center.

Suomi NPP image of Kiko
NASA-NOAA’s Suomi NPP satellite passed over Tropical Storm Kiko on Sept.22 and revealed a tight circular area with some powerful storms around the low-level center. The image showed bands of thunderstorms were located over the northern quadrant of the storm. Credit: NASA Worldview, Earth Observing System Data and Information System (EOSDIS)

The Visible Infrared Imaging Radiometer Suite (VIIRS) instrument aboard Suomi NPP provided a visible image of Kiko on Sept. 22 that revealed the storm consisted of a tight circulation of low clouds with intermittent bursts of deep convection. The VIIRS image showed some powerful storms circled the low-level center and a large band of thunderstorms were located over the northern quadrant of the storm.

By early on Sept. 23, Kiko’s structure had improved on satellite imagery.

NOAA’s National Hurricane Center or NHC said, “At 11 a.m. EDT (1500 UTC) on Sept. 23 the center of Tropical Storm Kiko was located near latitude 15.7 north, longitude 135.8 west.

That is about 1,755 miles (2,825 km) west-southwest of the southern tip of Baja California, Mexico.  Kiko is moving toward the west-northwest at near 8 mph (13 km/h). This general motion is expected today, followed by a turn toward the northwest on Tuesday. Kiko could begin to turn back toward the west in a few days as it weakens. Maximum sustained winds are near 50 mph (85 kph) with higher gusts. The estimated minimum central pressure is 1002 millibars.

NHC said some additional strengthening is possible today, but weakening is forecast to begin by Tuesday and Kiko is forecast to become a remnant low later this week.

Hurricanes are the most powerful weather event on Earth. NASA’s expertise in space and scientific exploration contributes to essential services provided to the American people by other federal agencies, such as hurricane weather forecasting.

For updated forecasts. visit: www.nhc.noaa.gov

By Rob Gutro 
NASA’s Goddard Space Flight Center