Imelda – Atlantic Ocean

Sep. 20, 2019 – NASA Estimates Imelda’s Extreme Rainfall

NASA estimated extreme rainfall over eastern Texas from the remnants of Tropical Depression Imelda using a NASA satellite rainfall product that incorporates data from satellites and observations.

IMERG data from GPM on rainfall in Imelda
NASA’s IMERG estimated that by Friday morning, September 20, Tropical Storm Imelda had dropped over 24 inches of rain (dark pink) between Beaumont and Houston, Texas. Estimates of between 16 and 24 inches have fallen (light pink) between Freeport and Beaumont, and 6 inches and more (red) over a large area between southwestern Louisiana and Palacios, Texas. Large “L” symbols show Imelda’s location estimated by the National Hurricane Center. An “R” symbol on the image indicates a place where the rainfall from the remnant of Imelda caused a U.S. Geological Survey river gauge to swell to “major flood” stage. Small red circles on this image indicate the location of these tornado reports, as provided by NOAA’s Storm Prediction Center. Credit: NASA Goddard

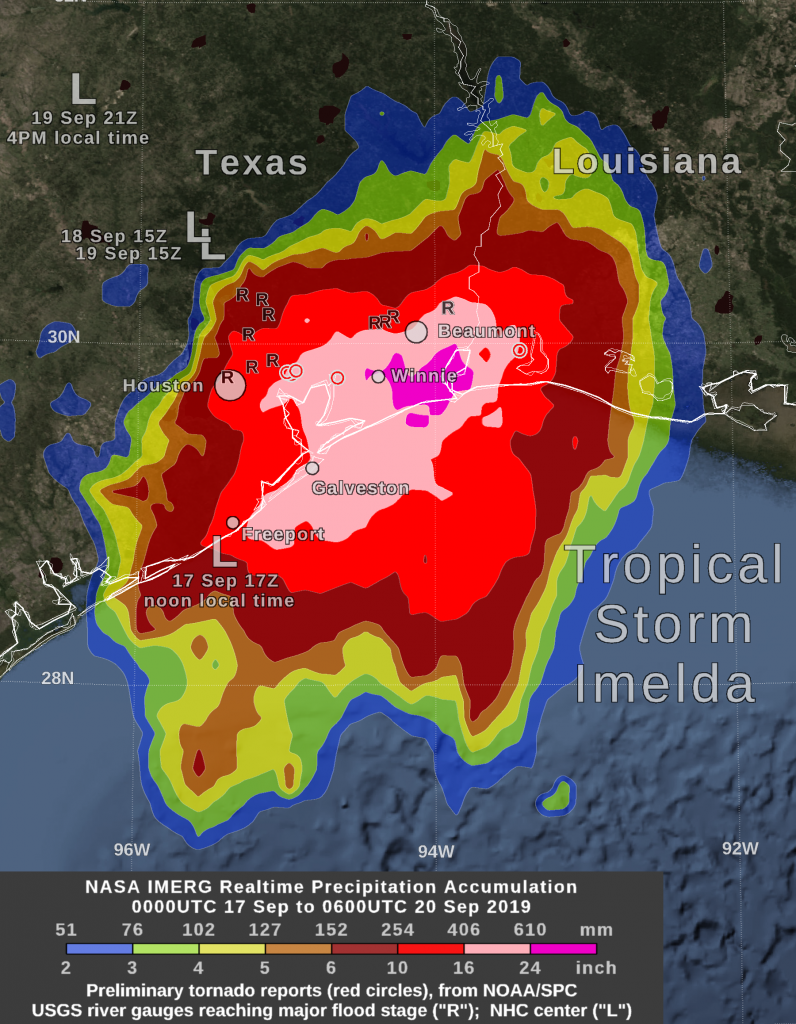
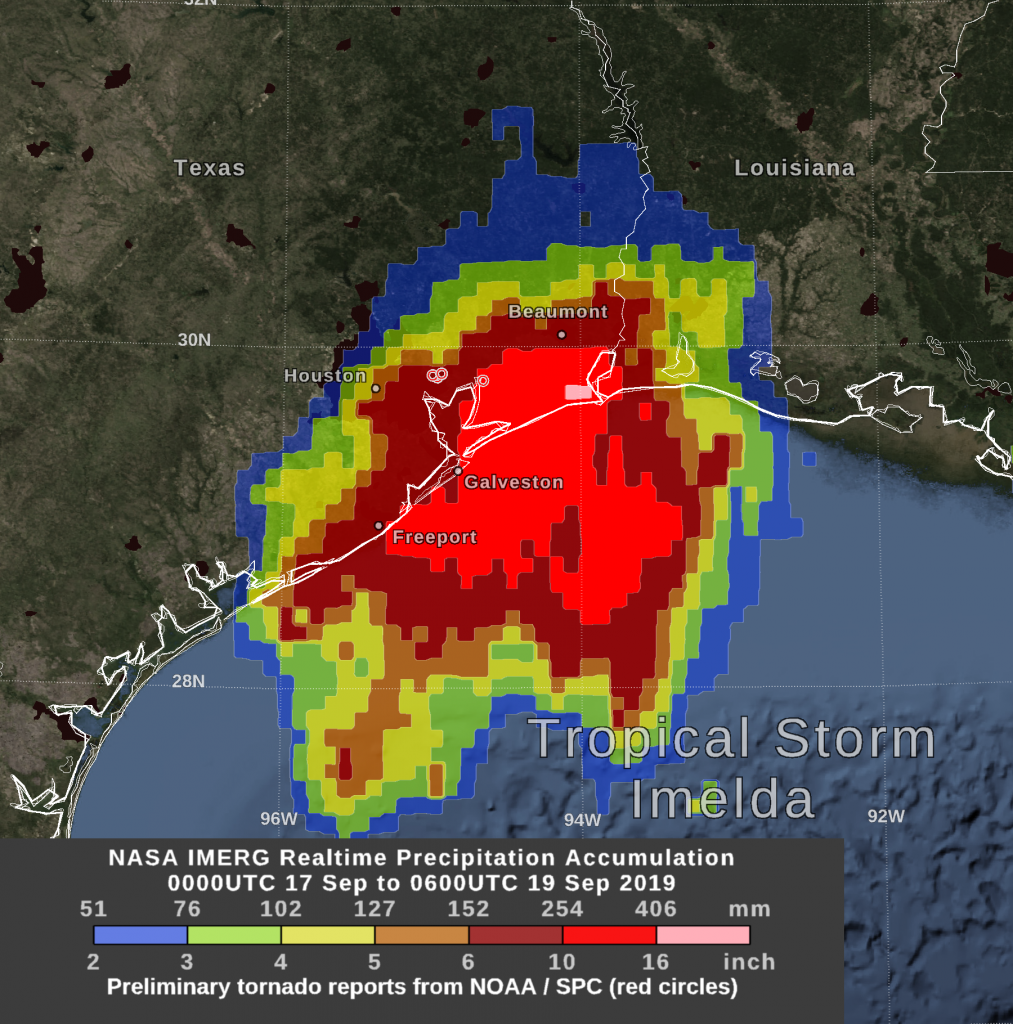
NASA’s Integrated Multi-satellitE Retrievals for GPM or IMERG, which is a NASA satellite rainfall product, estimated that by Friday morning, September 20, Tropical Storm Imelda had dropped over 24 inches of rain between Beaumont and Houston, Texas. Estimates of between 16 and 24 inches have fallen between Freeport and Beaumont, and 6 inches and more over a large area between southwestern Louisiana and Palacios, Texas. An image showing these rainfall totals was created at NASA’s Goddard Space Flight Center in Greenbelt, Md.

This near-real time rain estimate comes from the NASA’s IMERG, which combines observations from a fleet of satellites, in near-real time, to provide near-global estimates of precipitation every 30 minutes. By combining NASA precipitation estimates with other data sources, we can gain a greater understanding of major storms that affect our planet.

If one compares the IMERG satellite-based rain estimate to that from a National Weather Service ground radar, one sees that IMERG correctly identified the large region of heavy rainfall near Beaumont, but IMERG failed to resolve an extremely narrow band of heavy rainfall along Galveston Island. Such good detection of large rain features in real-time would be impossible if the IMERG merely reported the precipitation observed by the periodic overflights of various agencies’ satellites.

Instead, what the IMERG does is “morph” high-quality satellite observations along the direction of the steering winds to deliver information about rain at times and places where such satellite overflights did not occur. Information morphing is particularly important over the majority of the world’s surface that lacks ground-radar coverage. Basically, IMERG fills in the blanks between weather observation stations.

The NASA image also identified where the rainfall from the remnant of Imelda caused a U.S. Geological Survey river gauge to swell to “major flood” stage. “Major” flood generally means that nearby homes and roads were flooded.  In addition, there were several preliminary reports of Imelda-spawned tornadoes on Wednesday and Thursday, September 18 and 19.

NOAA’s National Weather Service noted on Sept. 20, “Intense tropical rainfall continues in portions of Southeast Texas and Southwest Louisiana from the remnants of Imelda. These additional rains will only compound ongoing issues with flooding. The heavy rain focus will gradually shift to the Arkansas-Louisiana-Texas region on Friday, Sept. 20.”

Hurricanes are the most powerful weather event on Earth. NASA’s expertise in space and scientific exploration contributes to essential services provided to the American people by other federal agencies, such as hurricane weather forecasting.

For more information about NASA’s IMERG, visit: https://pmm.nasa.gov/gpm/imerg-global-image

For local forecasts, visit: www.weather.gov

By Owen Kelley / Rob Gutro
NASA’s Goddard Space Flight Center

Tapah – Northwestern Pacific Ocean

Sep. 19, 2019 – NASA Analyzes Rainfall Rates in New Tropical Storm Tapah

Tropical Storm Tapah formed quickly in the northwestern Pacific Ocean and as it was strengthening from a depression to a tropical storm, the Global Precipitation Measurement mission or GPM core satellite passed overhead from its orbit in space and measured rainfall rates throughout the storm.

GPM image of Tapah
The GPM core satellite passed over strengthening Tropical Storm Tapah in the northwestern Pacific Ocean on Sept. 16 at 12:11 p.m. EDT (1611 UTC) and found the heaviest rainfall (pink) falling at as much as 1.6 inches (40 mm) per hour. Credit: NASA/JAXA/NRL

NASA has the unique capability of peering under the clouds in storms and measuring the rate in which rain is falling. The GPM’s core satellite passed over Tropical Storm Tapah in the northwestern Pacific Ocean on Sept. 16 at 12:11 p.m. EDT (1611 UTC).

GPM found the heaviest rainfall around the storm’s center, where it was falling at a rate of as much as 1.6 inches (40 mm) per hour. Forecasters at the Joint Typhoon Warning Center incorporate the rainfall data into their forecasts.

Both the Japan Aerospace Exploration Agency (JAXA) and NASA manage GPM.

At 11 a.m. EDT (1500 UTC), the center of Tropical Storm Tapah was located near latitude 23.1 degrees north and longitude 127.9 degrees east. That puts Tapah’s center about 211 nautical miles south of Kadena Air Base, Okinawa, Japan. Maximum sustained winds remain near 40 mph (46 kph) with higher gusts. Tapah is forecast to strengthen but remain a tropical storm over the next several days.

Hurricanes are the most powerful weather event on Earth. NASA’s expertise in space and scientific exploration contributes to essential services provided to the American people by other federal agencies, such as hurricane weather forecasting.

For updated forecasts, visit: www.nhc.noaa.gov

By Rob Gutro
NASA’s Goddard Space Flight Center

Mario – Eastern Pacific Ocean

Sep. 19, 2019 – NASA-NOAA Satellite Finds Tropical Storm Mario More Out of Shape

NASA-NOAA’s Suomi NPP satellite imagery revealed Tropical Storm Mario appeared to be losing its rounded shape in the Eastern Pacific Ocean.

Suomi NPP image of Mario
NASA-NOAA’s Suomi NPP satellite passed over Tropical Storm Mario on Sept. 18 at 5:36 p.m. EDT (2136 UTC) and observed that the storm appeared somewhat elongated. Credit: NASA Worldview, Earth Observing System Data and Information System (EOSDIS)

When tropical cyclones begin to lose their shape and appear less circular, it is generally an indication of a storm that is weakening. Circular storms can spin faster, just like a tire on a car. Once the tire loses its circular shape it can’t rotate as fast.

The Visible Infrared Imaging Radiometer Suite (VIIRS) instrument aboard Suomi NPP provided a visible image of Mario on Sept. 18 at 5:36 p.m. EDT (2136 UTC) that indicated wind shear was affecting the storm as it did not appear circular as a result of wind shear. NPP data is used by forecasters at NOAA’s National Hurricane Center to assess factors of the storm that include structure and strength.

NASA’s Aqua satellite also passed over Mario and provided cloud top temperature data. Aqua showed Mario contained some powerful thunderstorms stretching high into the troposphere with cloud top temperatures as cold as or colder than 220 Kelvin (minus 63 degrees Fahrenheit / minus 53 degrees Celsius). NASA research has shown that storms with cloud top temperatures that cold can produce heavy rainfall.

NHC forecasters also utilized data to determine moderate easterly wind shear, associated at least in part with outflow from Mario’s larger sibling (Lorena) to the east, has prevented the tropical storm from strengthening at a faster rate.

In general, wind shear is a measure of how the speed and direction of winds change with altitude. Tropical cyclones are like rotating cylinders of winds. Each level needs to be stacked on top each other vertically in order for the storm to maintain strength or intensify. Wind shear occurs when winds at different levels of the atmosphere push against the rotating cylinder of winds, weakening the rotation by pushing it apart at different levels.

During the morning of Sept. 19, microwave and first-light visible imagery suggest that the low-level center of Mario may be displaced to the east of most of its strongest thunderstorms, indicating a weakening storm.

NOAA’s National Hurricane Center or NHC said, “At 11 a.m. EDT (1500 UTC), the center of Tropical Storm Mario was located near latitude 16.5 degrees north and longitude 111.5  degrees west. Mario is moving toward the north near 7 mph (11 kph). Maximum sustained winds are near 65 mph (100 kph) with higher gusts.  Little change in strength is forecast during the next several days.

Mario is currently embedded within low- to mid-layer southwesterly flow and this should cause the cyclone to move generally northeastward or north-northeastward for the next day or two. What happens after that depends largely on Lorena.

Hurricanes are the most powerful weather event on Earth. NASA’s expertise in space and scientific exploration contributes to essential services provided to the American people by other federal agencies, such as hurricane weather forecasting.

For updated forecasts. visit: www.nhc.noaa.gov

By Rob Gutro 
NASA’s Goddard Space Flight Center

Lorena – Eastern Pacific Ocean

Sep. 19, 2019 – NASA-NOAA Satellite Finds Lorena’s Strong Storms Lashing Mexico

Imagery from NASA-NOAA’s Suomi NPP satellite found Tropical Storm Lorena lashing the western coast of Mexico.

Suomi NPP image of Lorena
NASA-NOAA’s Suomi NPP satellite passed over Tropical Storm Lorena on Sept. 18 and revealed powerful storms around the low-level center. Strong storms were also lashing the coast of western Mexico, bringing heavy rainfall. Credit: NASA Worldview, Earth Observing System Data and Information System (EOSDIS)

The Visible Infrared Imaging Radiometer Suite (VIIRS) instrument aboard Suomi NPP provided a visible image of Lorena on Sept. 18 that revealed powerful storms circled the low-level center. The image showed strong bands of thunderstorms sweeping over the coast of western Mexico over the western parts of Michoacan and Colima states. Data from NASA’s Aqua satellite revealed that some of the thunderstorms were over 12,000 meters or 7.4 miles high. NASA research has shown storms high in the troposphere can be strong storms that generate heavy rainfall. It was that heavy rainfall that continued to drench the western coast of Mexico.

Microwave and satellite imagery indicated that the center of Lorena moved along the southwestern coast of Mexico overnight and during the morning of Sept. 19.

Lorena did not move much from the coast since the Suomi NPP satellite image was captured. NOAA’s National Hurricane Center or NHC said, at 11 a.m. EDT (1500 UTC) on Sept. 19 the center of Lorena moved offshore just west of Cabo Corrientes and heavy rains and strong winds continue along the southwestern coast of Mexico.

Coastal sections of the Mexican states of Michoacan, Colima and Jalisco will get 5 to 10 inches with maximum amounts of 15 inches. This rainfall may produce life threatening flash floods and mudslides. Far southern Baja California Sur will get 2 to 4 inches with maximum amounts around 6 inches.

A Hurricane Watch is in effect for Baja California peninsula from La Paz to Santa Fe and a Tropical Storm Warning is in effect for Manzanillo to Punta Mita and for the Baja California peninsula from Los Barriles to Todos Santos.

The center of Tropical Storm Lorena was located near latitude 20.5 North, longitude 105.9 West. Lorena is moving toward the northwest near 10 mph (17 km/h). A turn to the west-northwest is expected tonight, and a west-northwestward motion at a slow forward speed should continue Saturday [Sept. 21]. Maximum sustained winds are near 70 mph (110 kph) with higher gusts. Strengthening is forecast during the next day or so, and Lorena is forecast to regain hurricane strength later today or tonight. The estimated minimum central pressure is 994 millibars.

On the forecast track, the center of Lorena will move over the Pacific waters to the southeast of the Baja California peninsula today and tonight, and then pass near or just south of the southern tip of the Baja California peninsula late Friday and Friday night.

Hurricanes are the most powerful weather event on Earth. NASA’s expertise in space and scientific exploration contributes to essential services provided to the American people by other federal agencies, such as hurricane weather forecasting.

For updated forecasts. visit: www.nhc.noaa.gov

By Rob Gutro 
NASA’s Goddard Space Flight Center

Kiko – Eastern Pacific Ocean

Sep. 19, 2019 – NASA-NOAA Satellite Finds Tropical Storm Kiko Staying in Shape

Satellite imagery from NASA-NOAA’s Suomi NPP satellite showed Tropical Storm Kiko maintained its shape and strength after weakening from hurricane-force.

Suomi NPP image of Kiko
NASA-NOAA’s Suomi NPP satellite passed over Tropical Storm Kiko on Sept. 18 at 5:36 p.m. EDT (2136 UTC) and revealed a circular area of powerful storms around the low-level center. The image showed strong bands of thunderstorms were located over the northern and southern quadrants of the storm. Credit: NASA Worldview, Earth Observing System Data and Information System (EOSDIS)

The Visible Infrared Imaging Radiometer Suite (VIIRS) instrument aboard Suomi NPP provided a visible image of Kiko on Sept. 18 at 5:36 p.m. EDT (2136 UTC) and revealed a circular area of powerful storms around the low-level center. The image showed strong bands of thunderstorms were located over the northern and southern quadrants of the storm. Those bands shifted location by the next day. On Sept. 19, the storm remained relatively compact with deep convection (strongest thunderstorms) organized in bands to the north and east of the low-level center.

Hurricanes are the most powerful weather event on Earth. NASA’s expertise in space and scientific exploration contributes to essential services provided to the American people by other federal agencies, such as hurricane weather forecasting.

NOAA’s National Hurricane Center or NHC said, “At 11 a.m. EDT (1500 UTC) the center of Tropical Storm Kiko was located near latitude 16.0 degrees north and longitude 128.7 degrees west. Kiko is far from land and centered about 1,310 miles (2,110 km) west-southwest of the southernmost tip of Baja California, Mexico. Kiko is moving toward the west near 6 mph (9 kph). Maximum sustained winds are near 65 mph (100 kph) with higher gusts.  Slow strengthening is forecast for the next few days, and Kiko may regain hurricane strength on Friday [Sept. 20].”

For updated forecasts. visit: www.nhc.noaa.gov

By Rob Gutro 
NASA’s Goddard Space Flight Center

Jerry – North Atlantic Ocean

Sep. 19, 2019 -NASA Analyzes Rainfall Rates in Strengthening Tropical Storm Jerry

NASA has the unique capability of peering under the clouds in storms and measuring the rate in which rain is falling. Global Precipitation Measurement mission or GPM core satellite passed over Tropical Storm Jerry from its orbit in space and measured rainfall rates throughout the storm.

GPM image of Jerry
The GPM core satellite passed over strengthening Tropical Storm Jerry in the central Atlantic Ocean on Sept. 18 at 11:51 p.m. EDT (Sept. 19 at 0351 UTC) and found the heaviest rainfall (orange) stretching from the eastern to southern side of the storm falling at a rate of over 25 mm (about 1 inch) per hour. Credit: NASA/JAXA/NRL

GPM passed over Tropical Storm Jerry in the Atlantic Ocean on Sept. 18 at 11:51 p.m. EDT (Sept. 19 at 0351 UTC). GPM found the heaviest rainfall stretching from the eastern to southern side of the storm where it was falling at a rate of over 25 mm (about 1 inch) per hour there and in a fragmented band of thunderstorms west of center. Forecasters at NOAA’s National Hurricane Center or NHC incorporate the rainfall data into their forecasts.

Hurricanes are the most powerful weather event on Earth. NASA’s expertise in space and scientific exploration contributes to essential services provided to the American people by other federal agencies, such as hurricane weather forecasting.

NHC issued a Tropical Storm Watch for Barbuda, Anguilla, St. Maarten, St. Martin, St. Barthelemy, Saba and St. Eustatius.

At 8 a.m. EDT (1200 UTC), the center of Tropical Storm Jerry was located near latitude 16.4 degrees north and longitude 53.9 degrees west. That puts Jerry’s center about 525 miles (845 km) east of the Leeward Islands. Jerry is moving toward the west-northwest near 16 mph (26 kph).  A west-northwest motion at a slightly faster forward speed is expected over the next few days.

Maximum sustained winds remain near 70 mph (110 kph) with higher gusts. Jerry is forecast to become a hurricane later today, with little change in strength anticipated on Friday or Saturday. The estimated minimum central pressure is 995 millibars.

NHC noted in its key messages that “Jerry is expected to become a hurricane before it moves close to the northern Leeward Islands Friday.  Although the core of Jerry is currently expected to pass north of the islands, tropical-storm-force winds and locally heavy rainfall are possible, and tropical storm watches have been issued for a portion of this area.”  Additional key messages for Jerry can be found on the web at: www.hurricanes.gov/text/MIATCDAT5.shtml.

Both the Japan Aerospace Exploration Agency (JAXA) and NASA manage GPM.

For updated forecasts, visit: www.nhc.noaa.gov

By Rob Gutro
NASA’s Goddard Space Flight Center

Imelda – Atlantic Ocean

Sep. 19, 2019 – NASA Estimates Tropical Depression Imelda’s Huge Texas Rainfall

Northeastern Texas has borne the brunt of Tropical Depression Imelda’s heavy rainfall and NASA estimated that rainfall with an algorithm that incorporates data from satellites and observations.

IMERG data on rainfall from Imelda
NASA’s IMERG estimated that by Thursday morning, September 19, Tropical Storm Imelda had dropped over 10 inches of rain (red) over a large area between Houston and Beaumont, Texas. There were several preliminary reports of tornadoes (small red circles) on Wednesday evening, September 18. Credit: NASA Goddard/Owen Kelley

By Thursday morning, September 19, Tropical Storm Imelda had dropped over 10 inches of rain over a large area between Houston and Beaumont, Texas. At NASA’s Goddard Space Flight Center in Greenbelt, Maryland, a graphic was produced that shows precipitation that fell starting on Tuesday, September 17, the day that Imelda formed as a tropical depression in the Gulf of Mexico, intensified into a tropical storm, and made landfall in Texas, all within a few hours.

The near-realtime rain estimate comes from the NASA’s Integrated Multi-satellitE Retrievals for GPM (IMERG) algorithm, which combines observations from a fleet of satellites, in near-realtime, to provide near-global estimates of precipitation every 30 minutes.  This satellite-based rain estimate is somewhat coarse in resolution and can miss short-lived, intense storm-cells, but the IMERG algorithm often does captures the large-scale features of storms wherever they form in the world.  While the United States is fortunate to have a network of ground radars that can provide higher-resolution precipitation estimates, in other parts of the world, notably over most of the world’s oceans, the IMERG rain estimate is an important reference point.

By combining NASA precipitation estimates with other data sources, we can gain a greater understanding of major storms that affect our planet.

NOAA’s Storm Prediction Center also reported several preliminary reports of tornadoes on Wednesday evening, September 18.

On September 19 at 5 a.m. EDT, NOAA’s National Weather Service Weather Prediction Center (NWS NPC) in College Park, Md. forecast indicated that Imelda’s heavy rainfall is expected to continue. Flash flood watches are in effect for parts of eastern Texas and western Louisiana.

The NWS forecasts that Imelda is expected to produce the following rainfall amounts through Friday: Across the Upper Texas Coast into far southeast Texas… an additional 5 to 10 inches with isolated storm totals of 25 to 35 inches are possible. Across portions of southwest Louisiana…an additional 3 to 5 inches with isolated totals of 10 inches are expected. For the rest of east Texas…2 to 4 inches with isolated totals around 8 inches are forecast. These rainfall totals may produce significant to life threatening flash floods.

At 5 a.m. EDT (0900 UTC), the center of Tropical Depression Imelda was located near latitude 31.3 North, longitude 95.5 West. That puts the center of Imelda’s circulation about 110 miles (180 km) north of Houston, Texas and about 70 miles (115 km) northeast of College Station, Texas.  The depression is moving toward the north-northwest near 5 mph (7 kph) and this motion is expected to continue through today. Maximum sustained winds are near 30 mph (45 kph) with higher gusts. The estimated minimum central pressure is 1009 millibars. A gradual weakening is forecast during the next 24 hours.

Hurricanes are the most powerful weather event on Earth. NASA’s expertise in space and scientific exploration contributes to essential services provided to the American people by other federal agencies, such as hurricane weather forecasting.

For more information about NASA’s IMERG, visit: https://pmm.nasa.gov/gpm/imerg-global-image

For updated forecasts on Imelda, visit: www.nhc.noaa.gov

By Owen Kelley / Rob Gutro
NASA’s Goddard Space Flight Center

Humberto – Atlantic Ocean

Sep. 19, 2019 – NASA Satellite Data Shows Humberto’s Structure Change

NASA’s Aqua Satellite provided data on Major Hurricane Humberto that revealed its structure was changing as it was moving through the North Atlantic Ocean and past Bermuda.

Aqua image of Humberto
On Sept. 18, the MODIS instrument that flies aboard NASA’s Aqua provided a visible image of Hurricane Humberto north of Bermuda. Powerful thunderstorms circled the center and a large band stretched hundreds of miles east. Aqua cloud height and temperature data revealed Humberto was taking on an extra-tropical hybrid structure. Credit: NASA Worldview, Earth Observing System Data and Information System (EOSDIS).

On Sept. 18 at 12:30 p.m. EDT, the Moderate Imaging Spectroradiometer or MODIS instrument that flies aboard NASA’s Aqua satellite provided visible data on Humberto and measured clouds heights and temperatures that indicated a shift in the storm.

The visible image revealed powerful thunderstorms circled the center and a large band stretched hundreds of miles east. Additional data showed the highest cloud tops, higher than 12,000 meters (7.65 miles) were located mostly south and southwest of the eye, although a small area circled the eye. Those were the most powerful storms within Humberto. Aqua research data also found that cloud top temperatures were as cold as or colder than 200 Kelvin (minus 99.6 degrees Fahrenheit/minus 73.1 degrees Celsius) around in those storms. NASA research has shown that cloud top temperatures that cold have the capability to generate heavy rainfall.

The cloud height and temperature data was provided by NASA’s Worldview product at NASA’s Goddard Space Flight Center, Greenbelt, Md. Hurricanes are the most powerful weather event on Earth. NASA’s expertise in space and scientific exploration contributes to essential services provided to the American people by other federal agencies, such as hurricane weather forecasting.

Hours later, NOAA’s National Hurricane Center or NHC noted at 5 p.m. EDT, “Humberto is taking on more of a hybrid-extratropical structure based on most of the rain shield having been displaced to the left or poleward side of the circulation now as seen in Bermuda weather radar data, and also in conventional and passive microwave satellite imagery.”

On Sept. 19 at 5 a.m. EDT, NHC indicated that Humberto’s extratropical transition continued and that large-scale models, as well as the Florida State University Cyclone Phase Evolution forecast, indicate that the process will be completed in less than 36 hours.

At 11 a.m. EDT (1500 UTC) on Sept. 19, the center of Hurricane Humberto was located near latitude 35.2 degrees north and longitude 62.2 degrees west. Humberto was about 250 miles (400 km) northeast of Bermuda. Humberto is moving toward the northeast near 22 mph (35 kph).  This general motion is expected to continue today, followed by a north-northeastward motion at a slower forward speed Thursday night and Friday. On the forecast track, the center of Humberto will continue to move away from Bermuda.

Maximum sustained winds are near 125 mph (205 kph) with higher gusts.  Humberto is a category 3 hurricane on the Saffir-Simpson Hurricane Wind Scale. Hurricane-force winds extend outward up to 90 miles (150 km) from the center and tropical-storm-force winds extend outward up to 405 miles (650 km). The estimated minimum central pressure is 952 millibars.

On Sept. 19, Humberto was stirring up the seas and creating hazardous conditions.

Large swells and dangerous surf generated by Humberto will continue along the coast of Bermuda through today, and these could continue to cause coastal flooding. Swells will continue to affect the northwestern Bahamas and the southeastern coast of the United States from east-central Florida to North Carolina during the next couple of days.

The hurricane should start to weaken today, and it is expected to become a post-tropical cyclone by Friday.

For updated forecasts, visit: www.nhc.noaa.gov

By Rob Gutro
NASA’s Goddard Space Flight Center

Lorena – Eastern Pacific Ocean

Sep. 18, 2019 – Tropical Storm Lorena Takes Shape in NASA-NOAA Satellite Image

The shape of a tropical cyclone provides forecasters with an idea of its organization and strength, and NASA-NOAA’s Suomi NPP satellite provided a visible image of the developing storm to forecasters.

Suomi NPP image of Lorena
NASA-NOAA’s Suomi NPP satellite passed over Tropical Storm Lorena after it developed on Sept. 17 and found an improved structure, and a strong band of thunderstorms were located over the northwestern quadrant of the storm. Credit: NASA Worldview, Earth Observing System Data and Information System (EOSDIS)

Visible imagery from NASA satellites help forecasters understand if a storm is organizing or weakening. The Visible Infrared Imaging Radiometer Suite (VIIRS) instrument aboard Suomi NPP provided a visible image of Lorena on Sept. 17 that revealed that the storm’s cloud pattern had become more organized. Strong thunderstorms were found around the center and a strong band of thunderstorms were seen over the northwestern quadrant of the storm in the VIIRS image.

On Sept. 18, Lorena’s cloud pattern continued to improve with the development of a central dense overcast feature, and several bands wrapping around the circulation.

Hurricanes are the most powerful weather event on Earth. NASA’s expertise in space and scientific exploration contributes to essential services provided to the American people by other federal agencies, such as hurricane weather forecasting.

Tropical Storm Lorena formed close enough to the western coast of Mexico to trigger warnings on Sept. 18. NOAA’s National Hurricane Center or NHC posted a Hurricane Warning from Punta San Telmo to Cabo Corrientes, and a Tropical Storm Warning for Zihuatanejo to Punta San Telmo and for Cabo Corrientes to Punta Mita.

At 2 p.m. EDT (1800 UTC), the center of Tropical Storm Lorena was located near latitude 17.6 degrees north and longitude 104.0 degrees west. Lorena is moving toward the northwest near 13 mph (20 kph). A slower northwestward motion is expected during the next couple of days. Maximum sustained winds have increased to near 70 mph (110 kph) with higher gusts. The estimated minimum central pressure is 993 millibars.

On the NHC forecast track, Lorena is expected to move near or over the southwestern coast of Mexico within the hurricane warning area tonight and Thursday. Additional strengthening is forecast during the next 24 hours, and Lorena is expected to become a hurricane as it nears the coast of southwestern Mexico.

For updated forecasts. visit: www.nhc.noaa.gov

By Rob Gutro 
NASA’s Goddard Space Flight Center

Mario – Eastern Pacific Ocean

Sep. 18, 2019 – NASA Sees Heavy Rainfall Occurring in Strengthening Tropical Storm Mario

When the Global Precipitation Measurement mission or GPM core satellite passed over the Eastern Pacific Ocean, it flew over the eastern side of Tropical Storm Mario and measured rainfall.

GPM image of Mario
The GPM core satellite passed over developing Tropical Storm Mario in the eastern Pacific Ocean on Sept. 18 at 3:46 a.m. EDT (0746 UTC) and found the heaviest rainfall (pink) in the southeastern side of the storm falling at a rate of over 36 mm (about 1.4 inch) per hour. GPM data was overlaid on cloud imagery from NOAA’s GOES-West satellite. Credit: NASA/JAXA/NRL

The GPM’s core satellite passed over Mario on Sept. 18 at 3:46 a.m. EDT (0746 UTC). GPM found the heaviest rainfall in the southeastern side of the storm falling at a rate of over 36 mm (about 1.4 inch) per hour. Lighter rainfall was measured throughout the rest of the east and southern quadrants and band of thunderstorms south of center. Forecasters at NOAA’s National Hurricane Center or NHC incorporate the rainfall data into their forecasts.

Mario formed on Sept. 17 as Tropical Depression 14E and six hours later at 6 p.m. EDT, it became a tropical storm.

At 11 a.m. EDT (1500 UTC), NHC forecasters said the center of Tropical Storm Mario was located near latitude 14.5 degrees north and longitude 111.0 degrees west. Mario is far from land, so there are no coastal warnings or watches in effect. Mario is centered about 585 miles (940 km) south of the southern tip of Baja California, Mexico.

Mario is moving toward the northwest near 12 mph (19 kph). This motion is expected to continue through tonight, with a decrease in forward speed beginning on Thursday. Mario is expected to become nearly stationary from early Friday through early Saturday.

Maximum sustained winds have increased to near 65 mph (100 kph) with higher gusts. The estimated minimum central pressure is 996 millibars.

Mario is forecast to become a hurricane by Thursday, Sept. 19.

Hurricanes are the most powerful weather event on Earth. NASA’s expertise in space and scientific exploration contributes to essential services provided to the American people by other federal agencies, such as hurricane weather forecasting.

GPM is a joint mission between NASA and the Japan Aerospace Exploration Agency, JAXA.

For updated forecasts, visit: www.nhc.noaa.gov

By Rob Gutro
NASA’s Goddard Space Flight Center