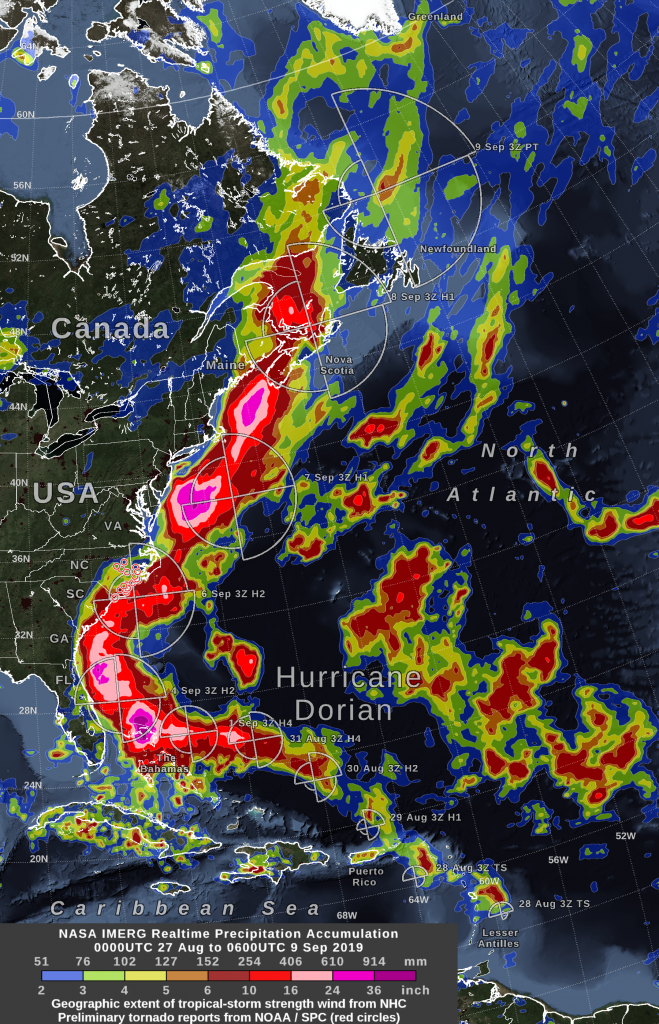
On Monday morning, September 9, Hurricane Dorian was a post-tropical storm after a mid-latitude weather front and cold seas had altered its tropical characteristics over the weekend. NASA compiled data on Hurricane Dorian and created a map that showed the heavy rainfall totals it left in its wake from the Bahamas to Canada.
At one-day intervals, the image shows the distance that tropical-storm force (39 mph) winds extended from Hurricane Dorian’s low-pressure center, as estimated by the National Hurricane Center. The Saffir-Simpson hurricane-intensity category is the number following the “H” in the label on the image. “TS” or “PT” indicate times when the storm was either at tropical storm strength or when the storm was categorized as post-tropical. Red circles over North Carolina indicate preliminary reports of tornadoes on Sept. 5. Credit: NASA Goddard
On Saturday and Sunday, Sept. 7 and 8, Hurricane Dorian struck eastern Canada, causing wind damage and bringing heavy rainfall. According to the Associated Press, a peak of 400,000 people were without power in Nova Scotia, Canada, because of Dorian.
At NASA’s Goddard Space Flight Center in Greenbelt, Maryland, a graphic was produced that shows precipitation that fell during the almost two-week period from August 27 to the early hours of Sept. 9. The near-real-time rain estimates come from the NASA’s IMERG algorithm, which combines observations from a fleet of satellites, in near real time, to provide near-global estimates of precipitation every 30 minutes.
This year, NASA began running an improved version of the IMERG algorithm that does a better job estimating precipitation at high latitudes, specifically north of 60 degrees North latitude. The post-tropical remnants of Hurricane Dorian were approaching this cold region at the end of the analysis period. While the IMERG algorithm is still unable to estimate precipitation falling over ice-covered surfaces (such as Greenland), IMERG can now give a more complete picture of the water cycle in places such as Canada, which is, for the most part, free of snow cover at this time of year.
In addition to rainfall totals, the map includes preliminary reports of tornadoes from 4:50 AM to 5:00 PM EDT on September 5 in North Carolina as provided by NOAA’s Storm Prediction Center.
IMERG showed largest rainfall amounts of more than 36 inches over the Bahamas and in an area off the coast of northeastern Florida. A large area of rainfall between 16 and 24 inches fell in many areas off the U.S. East Coast. Areas include those from South Carolina to the Bahamas, another off the North Carolina coast, a third area off the coasts of southern New Jersey, Delaware and Maryland, and the New England states.
By combining NASA precipitation estimates with other data sources, we can gain a greater understanding of major storms that affect our planet.
On Monday, Sept. 9 at 0300 UTC (Sept. 8 a t 11 p.m. EDT), NOAA’s National Hurricane Center (NHC) issued the final advisory on Dorian. At that time, Dorian had moved into the Labrador Sea and its impacts on Newfoundland were beginning to subside. Post-tropical cyclone Dorian had maximum sustained winds near 50 knots (57 mph/93 kph). It was centered near 52.1 degrees north latitude and 53.4 degrees west longitude. That puts the center about 375 miles north of Cape Race, Newfoundland, Canada. Dorian was speeding to the east-northeast at 21 knots. Minimum central pressure was 980 millibars.
On Sept. 9, additional rainfall totals expected from Dorian in far eastern Quebec, Newfoundland and Labrador are expected to be less than 1 inch. Meanwhile, life-threatening rip tide and surf conditions are expected to affect mid-Atlantic and New England coasts of the U.S., as well as the coast of Atlantic Canada.
The NHC said the cyclone will continue into the open Atlantic, where it will dissipate south of Greenland.
Sep. 08, 2019 – NASA Sees Post-Tropical Cyclone Dorian Over Eastern Canada
NASA’s Aqua satellite provided an infrared look at Post-Tropical Cyclone Dorian lashing parts of eastern Canada.
A tropical cyclone is the general name for a hurricane, tropical storm, depression or typhoon. NASA provides data and research on tropical cyclones to analyze intensification, weakening, structure, and behavior. NOAA’s National Hurricane Center uses that data in their forecasts.
On Sept. 7 at 1:30 a.m. EDT (1730 UTC), the MODIS instrument that flies aboard NASA’s Aqua satellite showed Dorian’s center just south of Nova Scotia, Canada. Credit: NASA/NRL
NASA’s Views of Dorian Before and After Landfall
Instruments aboard NASA’s Aqua satellite use visible, microwave and infrared light to analyze various aspects of a tropical cyclone.
On Sept. 7 at 1:30 p.m. EDT (1730 UTC), the MODIS instrument that flies aboard NASA’s Aqua satellite provided a visible image that clearly showed Dorian’s center just south of Nova Scotia, Canada.
Dorian moved north and five hours later, Post-Tropical Dorian made landfall at 6:15 p.m. EDT near Sambro Creek in Nova Scotia, Canada, or about 15 miles (25 km) south of Halifax. The estimated maximum sustained winds at landfall were 100 mph (155 kph) and the estimated central pressure was 958 millibars.
After Dorian had crossed over Nova Scotia, at 2 a.m. EDT on Sept. 8, it was centered about 5 miles (10 km) north of the Magdalen Islands, near latitude 47.5 degrees north and longitude 61.8 degrees west in the Gulf of St. Lawrence.
NASA’s Aqua satellite passed over Dorian again and looked at the storm in infrared light. NASA uses infrared light to analyze the strength of storms by providing temperature information about the system’s clouds. The strongest thunderstorms that reach high into the atmosphere have the coldest cloud top temperatures.
On Sept. 8 at 3:05 a.m. EDT (0705 UTC), the Moderate Imaging Spectroradiometer or MODIS instrument that flies aboard NASA’s Aqua satellite gathered infrared data on Dorian and showed the storm bringing rains and gusty winds to areas of Newfoundland, Labrador, Quebec south, Prince Edward Island and Nova Scotia. MODIS showed thunderstorms had cloud top temperatures as cold as minus 50 degrees Fahrenheit (minus 45.5 Celsius).
On Sept. 8 at 3:05 a.m. EDT (0705 UTC), the MODIS instrument that flies aboard NASA’s Aqua satellite showed Dorian was bringing rains and gusty winds to areas of Newfoundland, Labrador, Quebec south, Prince Edward Island and Nova Scotia. MODIS showed thunderstorms had cloud top temperatures as cold as minus 50 degrees Fahrenheit (minus 45.5 Celsius). Credit: NASA/NRL
What is a Post-Tropical Storm?
A Post-Tropical Storm is a generic term for a former tropical cyclone that no longer possesses sufficient tropical characteristics to be considered a tropical cyclone. Former tropical cyclones that have become fully extratropical, subtropical, or remnant low pressure areas, are three classes of post-tropical cyclones. In any case, they no longer possesses sufficient tropical characteristics to be considered a tropical cyclone. However, post-tropical cyclones can continue carrying heavy rains and high winds.
Warnings and Watches on Sept. 8, 2019
NOAA’s National Hurricane Center (NHC) noted on Sept. 8 that a Hurricane Warning is in effect for eastern Nova Scotia from Ecum Secum to Brule, and western Newfoundland from Indian Harbour to Hawke’s Bay. A Hurricane Watch is in effect for the Magdalen Islands. A Tropical Storm Warning is in effect for Prince Edward Island, Magdalen Islands, from Stone’s Cove to Indian Harbour, from Hawke’s Bay to Fogo Island and from Mutton Bay to Mary’s Harbour.
The Canadian Meteorological Service issued many warnings and watches on Sunday, September 8, 2019 for Newfoundland, Labrador, Quebec south, Prince Edward Island and Nova Scotia.
NHC noted that at 8 a.m. EDT (1200 UTC), the center of Post-Tropical Cyclone Dorian was located near latitude 49.4 degrees north and longitude 60.6 degrees west. Dorian’s center was about 55 miles (90 km) east-northeast of Heath Point, Anticosti Island, Canada, and about 90 miles (145 km) northwest of Cape St. George, Newfoundland, Canada. A sustained wind of 55 mph (89 km/h) with a gust to 73 mph (117 kph) was reported at Heath Point on Anticosti Island.
The post-tropical cyclone is moving toward the north-northeast near 26 mph (43 kph), and this general motion with a turn to the northeast is expected during the next couple of days. Maximum sustained winds are near 80 mph (130 kph) with higher gusts. These winds are occurring mainly over water. The post-tropical cyclone is forecast to drop below hurricane strength after passing Newfoundland later today.
The estimated minimum central pressure is 961 millibars.
What’s Next for Dorian?
Dorian is expected to remain a powerful storm through this afternoon, but the global models show steady weakening after the center moves northeast of Newfoundland tonight. Forecasters at NHC said “Dorian should continue north-northeastward today, then turn east-northeastward over the North Atlantic as it remains embedded within the mid-latitude westerlies.”
The forecast track takes Dorian south of Greenland on its trek across the Northern Atlantic. The post-tropical cyclone should should be absorbed by another extratropical low over the North Atlantic in 2 to 3 days.
Sept. 7, 2019 – Update #3 – NASA Finds Dorian Transitioning to an Extra-Tropical Cyclone
NASA satellites provided forecasters at the National Hurricane Center with infrared data and cloud top temperature information for Hurricane Dorian. Infrared data revealed that Dorian was becoming an extra-tropical cyclone as it moved northeast along the U.S. east coast and the area of strong storms had diminished around the storm.
NASA researches tropical cyclones and infrared data is one of the ways NASA uses. Cloud top temperatures provide information to forecasters about where the strongest storms are located within a tropical cyclone. The stronger the storms, the higher they extend into the troposphere, and they have the colder cloud temperatures.
On Sept. 6, at 2:23 p.m. EDT (1823 UTC), NASA’s Aqua satellite analyzed the storm using the Atmospheric Infrared Sounder or AIRS instrument. AIRS found coldest cloud top temperatures as cold as or colder than minus 80 degrees Fahrenheit (minus 62.2 degrees Celsius) circling around the center (eye) and in a thick band of thunderstorms northeast of the center. NASA research has shown that cloud top temperatures that cold indicate strong storms that have the capability to create heavy rain.
On Sept. 6, at 2:23 p.m. EDT (1823 UTC) the AIRS instrument aboard NASA’s Aqua satellite analyzed cloud top temperatures of Hurricane Dorian in infrared light. AIRS found coldest cloud top temperatures (purple) of strongest thunderstorms were as cold as or colder than minus 80 degrees Fahrenheit (minus 62.2 degrees Celsius) around the center and in a thick band of thunderstorms northeast of the center. Credit: NASA JPL/Heidar Thrastarson
On Sept. 7 at 3 a.m. EDT (0700 UTC), it was NASA-NOAA’s Suomi NPP satellite that provided an infrared view of Hurricane Dorian as it was transitioning into an extra-tropical storm. Strongest storms had cloud top temperatures as cold as or colder than minus 80 degrees Fahrenheit (minus 62.2 degrees Celsius) where the heaviest rain was falling over the open waters of the Atlantic Ocean. Those storms were now limited to the southern side of the storm, unlike the previous day, when they circled the eye.
NASA-NOAA’s Suomi NPP satellite provided an infrared view of Hurricane Dorian as it was transitioning into an extra-tropical storm on Sept. 7 at 3 a.m. EDT (0700 UTC). Strongest storms (red) had cloud top temperatures as cold as or colder than minus 80 degrees Fahrenheit (minus 62.2 degrees Celsius) where the heaviest rain was falling over the open waters of the Atlantic Ocean. Credit: NASA/NOAA/NRL
NOAA’s National Hurricane Center’s (NHC) discussion said “Satellite imagery this morning [Sept. 7] indicates that Dorian is starting extratropical transition, with cold air clouds entraining [moving] into the southwestern side of the cyclone and a developing warm front to the north and east.”
What is an Extra-Tropical Cyclone?
When a storm transitions into an extra-tropical cyclone, it means that a tropical cyclone has lost its tropical characteristics. The National Hurricane Center defines “extra-tropical” as a transition that implies both poleward displacement (meaning it moves toward the north or south pole) and the conversion of the cyclone’s primary energy source from the release of latent heat of condensation to baroclinic (the temperature contrast between warm and cold air masses) processes. It is important to note that cyclones can become extratropical and still retain winds of hurricane or tropical storm force.
Warnings and Watches in Effect on Sept. 7
NOAA’s National Hurricane Center’s (NHC) continued to issue warnings and watches as Dorian makes its way toward Canada today. A Hurricane Warning is in effect for eastern Nova Scotia from lower east Pubnico to Brule, and for western Newfoundland from Indian Harbour to Hawke’s Bay, Canada. A Hurricane Watch is in effect for Prince Edward Island and the Magdalen Islands.
A Tropical Storm Warning is in effect from east of Bar Harbor to Eastport, ME, and for Prince Edward Island, Canada. It is also in effect for southwestern Nova Scotia from Avonport to north of Lower East Pubnico, Fundy National Park to Shediac, Stone’s Cove to Indian Harbour, Hawke’s Bay to Fogo Island and from Mutton Bay to Mary’s Harbour, Canada.
Status of Hurricane Dorian on Saturday, September 7, 2019
On Saturday, September 7, 2019 at 11 a.m. EDT (1500 UTC), the center of Hurricane Dorian was located near latitude 42.0 degrees north and longitude 66.0 degrees west.
Dorian’s center is about 205 miles (330 km) south-southeast of Eastport, Maine and about 215 miles (350 km) southwest of Halifax, Nova Scotia, Canada.
The NHC said Dorian is moving toward the northeast near 29 mph (46 kph), and a general motion toward the northeast is expected to continue through Sunday night. Maximum sustained winds are near 85 mph (140 kph) with higher gusts. Dorian is expected to become a hurricane-force post-tropical cyclone as it moves across eastern Canada tonight or on Sunday, Sept. 8. The estimated minimum central pressure is 953 millibars.
What’s Next for Dorian?
Dorian is expected to finish transition into an extratropical cyclone over the next day as it merges with a strong mid- to upper-level trough (elongated area of low pressure) and its associated surface front.
On the NHC forecast track, the center of Dorian is expected to move across central or eastern Nova Scotia this afternoon or this evening, pass near or over Prince Edward Island tonight, and then move near or over portions of Newfoundland and Labrador on Sunday.
Sep. 07, 2019 – Update #2 – In the Wake of Hurricane Dorian
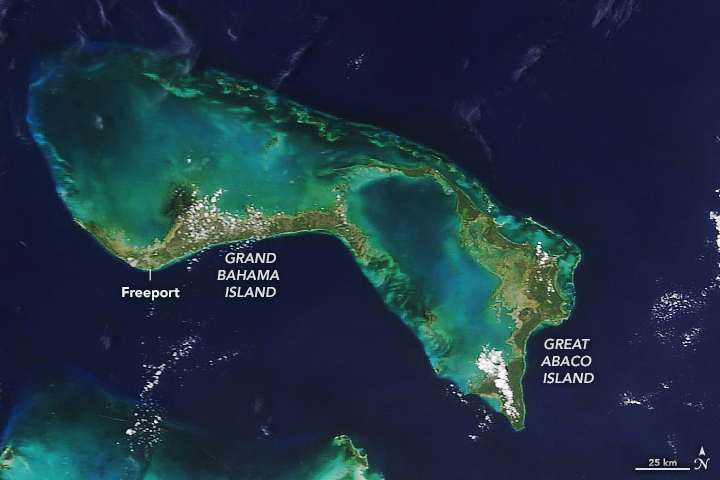
The Moderate Resolution Imaging Spectroradiometer (MODIS) on NASA’s Terra satellite acquired these natural-color images of Great Abaco Island and Grand Bahama on August 17, 2019. Credit: NASA
In the first week of September 2019, Hurricane Dorian left a path of destruction from the Caribbean to the Canadian Maritimes. Reaching category 5 strength for nearly two days and sustaining major hurricane status from August 30 to September 3, the storm devastated the northern Bahama Islands, strafed the southeast U.S. coast, and arrived in Nova Scotia as one of the five strongest hurricanes on record for that region.
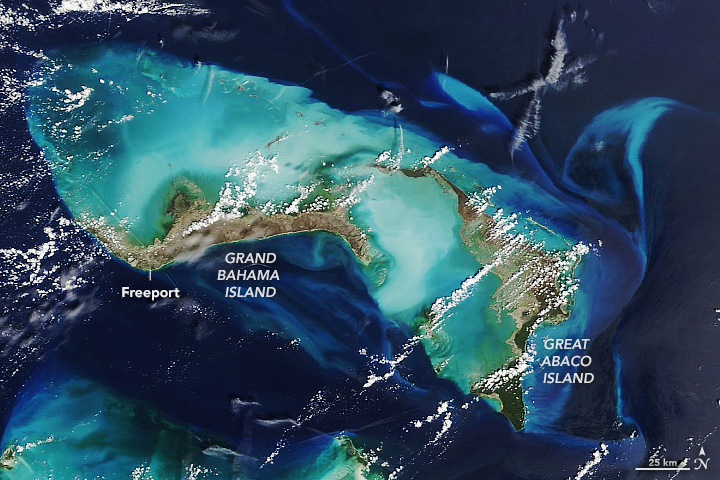
The Moderate Resolution Imaging Spectroradiometer (MODIS) on NASA’s Terra satellite acquired these natural-color images of Great Abaco Island and Grand Bahama on September 7, 2019. Credit: NASA
The images above provide a broad view of the devastation in the northern Bahamas, which were lashed for nearly 40 hours by the second strongest Atlantic hurricane in modern meteorological records. The Moderate Resolution Imaging Spectroradiometer (MODIS) on NASA’s Terra satellite acquired these natural-color images of Great Abaco Island and Grand Bahama on August 17 and September 7, 2019. Note the change in the color of the island landscape from green to brown, as well as the brightening of the reefs and shoals around the island due to sediments stirred up by the storm.
The widespread browning of Great Abaco and Grand Bahama could have several causes. Many trees were uprooted and destroyed by the storm, and some species of vegetation in the tropics have evolved to lose leaves and small branches in strong winds. The loss of leafy vegetation would give the satellite a view of more bare ground. Another possibility is that salt spray whipped up by the hurricane coated and desiccated some leaves while they were still on the trees.
Government officials from the Bahamas have reported at least 40 deaths, according to news accounts, though the number is expected to rise after search and rescue operations are complete. Hundreds of people are missing and an estimated 70,000 are homeless. Few areas have electric power or running water. National and international relief supplies are just beginning to arrive in the area, though transportation is difficult.
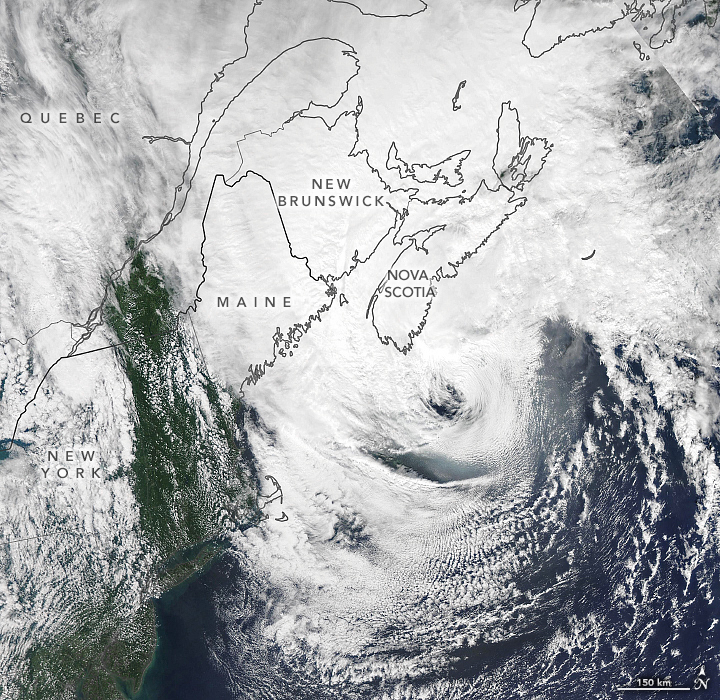
At the other end of the storm track, Dorian brought destructive winds and waves 1500 miles (2400 kilometers) to the north. After transitioning to an extra-tropical cyclone, the storm made landfall in Nova Scotia on the evening of September 7 at category 2 strength. Maximum wind speeds approached 100 miles (160 kilometers) per hour at the coast. According to Weather Underground, hurricane-force winds extended 115 miles (185 kilometers) from the center of the storm, and tropical storm-force winds extended 300 miles (500 kilometers).
The Moderate Resolution Imaging Spectroradiometer (MODIS) on NASA’s Aqua satellite captured this natural-color image of the vast storm just after midday on September 7, 2019. Credit: NASA
According to news reports, Dorian knocked out power to more than 500,000 customers in the Canadian Maritime Provinces, including Nova Scotia. A near-record storm surge was observed in the harbor at Halifax and along the coast of New Brunswick. And according to preliminary weather data, an offshore weather buoy measured a peak wave height of 30.7 meters (100.7 feet) in the open ocean.
Sep. 07, 2019 – Update #1 – NASA Images Temperature of Hurricane Dorian from Space Station
NASA’s ECOsystem Spaceborne Thermal Radiometer Experiment on Space Station (ECOSTRESS) has imaged the temperature of Hurricane Dorian from the International Space Station. ECOSTRESS provides NASA’s highest resolution temperature measurement from space, and is able to map fine detail in temperature patterns from the hurricane. The patterns reveal the small cloud structures that contribute to the formation of the larger hurricane.
NASA’s ECOsystem Spaceborne Thermal Radiometer Experiment on Space Station (ECOSTRESS) has imaged the temperature of Hurricane Dorian from the International Space Station. ECOSTRESS provides NASA’s highest resolution temperature measurement from space, and is able to map fine detail in temperature patterns from the hurricane. The patterns reveal the small cloud structures that contribute to the formation of the larger hurricane. Credit: NASA JPL
The image shows Hurricane Dorian on September 6, 2019 at 5:43 a.m. EDT, as it made landfall in North Carolina. Red colors are hotter temperatures, and purple/blue colors are cooler temperatures. The width of the color image is based on what ECOSTRESS sees as the Space Station flies over any given spot on Earth.
Launched to the International Space Station in June 2018, ECOSTRESS measures the surface temperature of the planet with high detail. ECOSTRESS measures variations in temperatures to within a few tenths of a degree and is able to detect temperature changes at various times of day over areas as small as a single farm. These measurements are used for a wide variety of applications, including plant stress and water use, urban heat, fires, water quality, volcanic activity, and hurricanes.
JPL built and manages the ECOSTRESS mission for NASA’s Earth Science Division in the Science Mission Directorate at NASA Headquarters in Washington. ECOSTRESS is an Earth Venture Instrument mission; the program is managed by NASA’s Earth System Science Pathfinder program at NASA’s Langley Research Center in Hampton, Virginia.
Sep. 06, 2019- NASA Finds Classic Comma-Shape in Tropical Storm Faxai
NASA’s Aqua satellite passed over the Northwestern Pacific Ocean and looked at comma-shaped Tropical Storm Faxai in infrared light.
On Sept. 6 at 11:40 a.m. EDT (1540 UTC), the MODIS instrument that flies aboard NASA’s Aqua satellite showed the classic comma-shaped Tropical Storm Faxai where the strongest thunderstorms had cloud top temperatures as cold as minus 80 degrees (yellow) Fahrenheit (minus 62.2 Celsius). Credit: NASA/NRL
At 11 a.m. EDT (1500 UTC), the Joint Typhoon Warning Center or JTWC reported that Tropical Storm Faxai had maximum sustained winds near 55 knots (63 mph/102 kph). JTWC said the storm is intensifying and that is evident by the powerful thunderstorms that NASA’s Aqua satellite found using infrared imagery.
Faxai was located near 24.7 degrees north latitude and 148.1 degrees east longitude, about 371 nautical miles east of Iwo To Island, Japan. Faxai was moving to the west-northwest.
On Sept. 6 at 11:40 a.m. EDT (1540 UTC), the Moderate Imaging Spectroradiometer or MODIS instrument that flies aboard NASA’s Aqua satellite used infrared light to analyze the strength of storms within the storm.
NASA researches tropical cyclones with satellites, field missions and computer modeling to determine how they rapidly intensify, develop and behave.
Tropical cyclones are made of up hundreds of thunderstorms, and infrared data can show where the strongest storms are located. They can do that because infrared data provides temperature information, and the strongest thunderstorms that reach highest into the atmosphere have the coldest cloud top temperatures.
MODIS found those strongest storms were around the center of circulation where cloud top temperatures were as cold as minus 80 degrees Fahrenheit (minus 62.2 Celsius). NASA research has found that cloud top temperatures that cold indicate strong storms with the potential to generate heavy rainfall. Those strong storms were surrounded by slightly less powerful storms that also extended in a band of thunderstorms that formed a “tail” stretching from the north to the east. That large, thick band of strong thunderstorms helped give Faxai the comma shape.
Faxai is forecast to move to the west-northwest and turn north after three days where it is forecast to make landfall near Tokyo at 80 knots (92 mph) on Sept. 8.
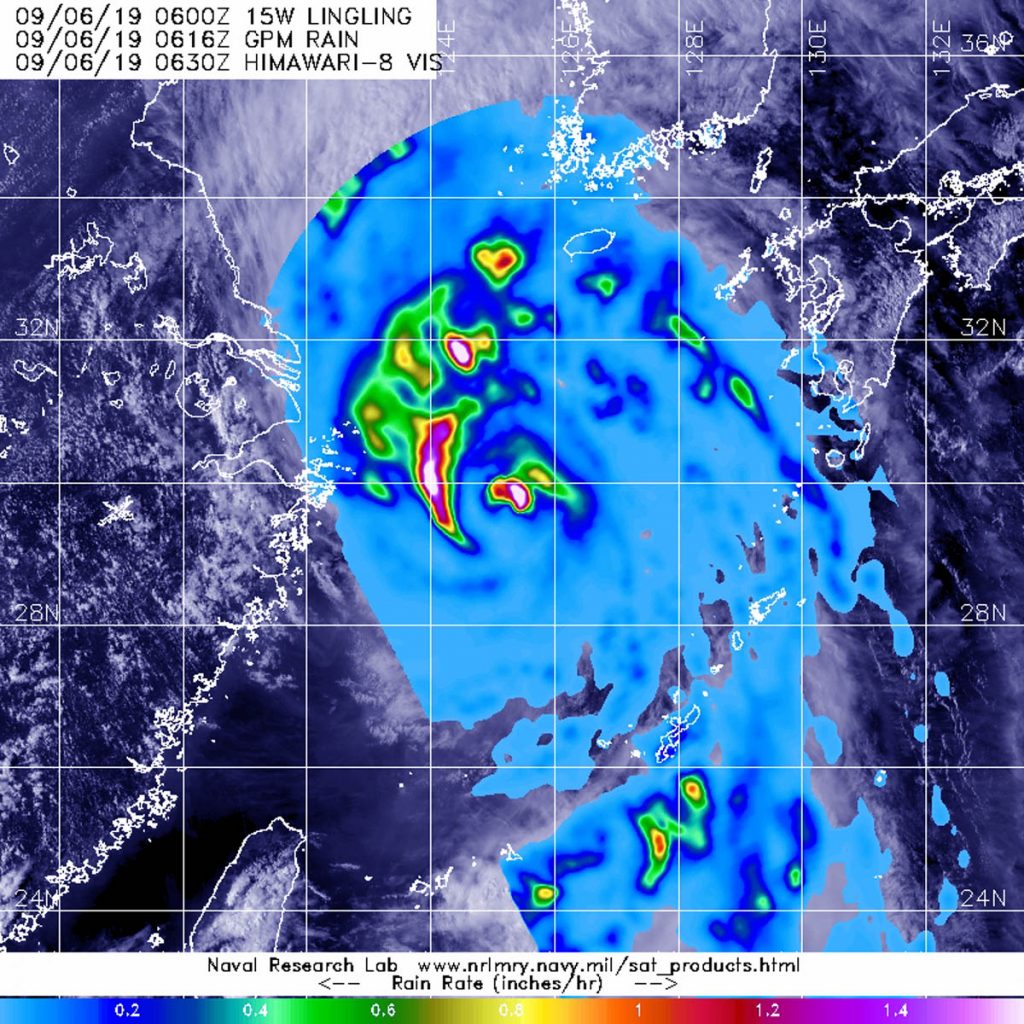
Sep. 06, 2019 – GPM Satellite Finds Heavy Rainfall on Northern Side of Typhoon Lingling
The Global Precipitation Measurement mission or GPM core satellite analyzed the rainfall rates happening within Typhoon Lingling and found the heaviest precipitation on its northern side.
The GPM core satellite passed over Typhoon Lingling in the South China Sea on Sept. 6 at 2:16 a.m. EDT (0616 UTC). GPM found the heaviest rainfall (pink) at a rate greater than 1.6 inches (40 mm) per hour, falling northwest and northeast of center in fragmented thunderstorms. The heaviest rain areas were surrounded by less heavy rain falling at a rate of 20 mm (about 0.8 inch) per hour. Lighter rainfall rates (blue) around those areas was between 0.2 and 0.4 inches (5 and 10 mm) per hour. The GPM rain data was overlaid on Japan’s Himawari-8 satellite visible imagery of clouds. Credit: NASA/JAXA/NRL
The GPM core satellite passed over Typhoon Lingling in the South China Sea on Sept. 6 at 2:16 a.m. EDT (0616 UTC). GPM found the heaviest rainfall at a rate greater than 1.6 inches (40 mm) per hour, falling northwest and northeast of center in fragmented thunderstorms. The heaviest rain areas were surrounded by less heavy rain, falling at a rate of 20 mm (about 0.8 inch) per hour. Lighter rainfall rates around those areas was between 0.2 and 0.4 inches (5 and 10 mm) per hour. NASA and the Japan Aerospace Exploration Agency, JAXA.
NASA researches tropical cyclones and provides data to international partners to use in their forecasting.
At 11 a.m. EDT (1500 UTC), Typhoon Lingling had maximum sustained winds near 100 knots (115 mph/185 kph). It was centered near 31.2 degrees north latitude and 125.0 degrees east longitude, about 293 nautical miles south-southwest of Kunsan Air Base, South Korea.
The Joint Typhoon Warning Center forecast calls for Lingling to move north through the Gulf of Tonkin. The Gulf of Tonkin is located off the coast of northern Vietnam and southern China. It is considered a northern arm of the South China Sea. Lingling is forecast to make landfall near Pyongyang, North Korea.
Sep. 06, 2019 – NASA Finds Akoni Already Post-Tropical
Tropical Storm Akoni had a quick life as a tropical storm before transitioning into a post-tropical storm. NASA captured a visible image of as it was becoming a tropical storm and an infrared image after it transitioned.
NASA’s Aqua satellite provided a visible image of Akoni when it was strengthening into a tropical storm. This image was taken at 4:30 p.m. EDT (2230 UTC) on Sept. 5, 2019. Credit: NASA/NRL
Akoni developed as Tropical Depression 12E on Sept. 4 in the far eastern Pacific Ocean. On Sept. 5 it strengthened into a tropical storm at 7 p.m. EDT. That’s when it became Akoni. By 5 a.m. EDT on Sept. 6, Akoni had transitioned into a post-tropical storm.
The Moderate Resolution Imaging Spectroradiometer or MODIS instrument aboard NASA’s Aqua satellite provided a visible image of Akoni as it was strengthening into a tropical storm. The image was taken at 4:30 p.m. EDT (2230 UTC) on Sept. 5, 2019 and it revealed a rounded storm.
An infrared image from MODIS was taken later on Sept. 6 at 6:45 a.m. EDT (1045 UTC) once Akoni had become Post-Tropical. That infrared MODIS image showed just a small area of strong storms located just southeast of center where cloud top temperatures were near minus 70 degrees Fahrenheit ( minus 56.6 degrees Celsius).
A Post-Tropical Storm is a generic term for a former tropical cyclone that no longer possesses sufficient tropical characteristics to be considered a tropical cyclone. Former tropical cyclones can become fully extratropical, subtropical, or remnant lows, and all three are classes of post-tropical cyclones. In any case, they no longer possesses sufficient tropical characteristics to be considered a tropical cyclone. However, post-tropical cyclones can continue carrying heavy rains and high winds.
NOAA’s National Hurricane Center (NHC) said, “Although showers and thunderstorms continue to pulse near Akoni’s elongated low-level circulation center (LLCC), they have not been sufficiently persistent or organized to continue to classify the system as a tropical cyclone, and Akoni is being downgraded to a post-tropical remnant low.”
At 5 a.m. EDT (0900 UTC), NHC reported in their final advisory on the system that “the center of Post-Tropical Cyclone Akoni was located near latitude 11.2 degrees north and longitude 149.7 degrees west. That’s about 690 miles (1,105 km) south-southeast of Hilo, Hawaii. Maximum sustained winds are near 35 mph (55 kph) with higher gusts. Little change in strength is forecast during the next couple of days. The estimated minimum central pressure is 1007 millibars.”
The post-tropical cyclone is moving toward the west near 16 mph (26 kph), and this motion is expected to continue the next couple of days, with some increase in forward speed over the weekend.
Sep. 06, 2019 – NASA Finds a Weaker Hurricane Juliette
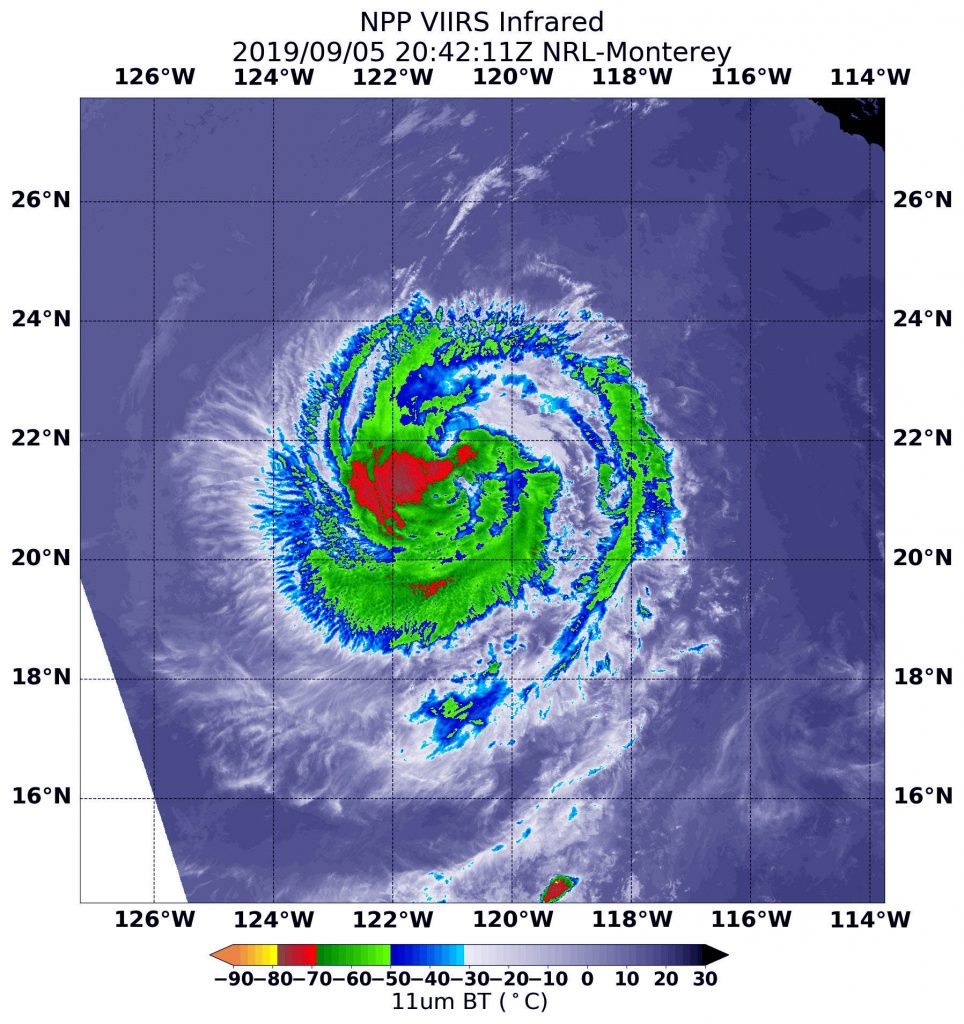
Hurricane Juliette has been weakening and NASA-NOAA’s Suomi NPP satellite provided a look at the strength of storms within.
NASA-NOAA’s Suomi NPP satellite passed over Hurricane Juliette in the eastern Pacific Ocean and the VIIRS instrument aboard captured an image of the storm on Sept. 6 at 4:42 p.m. EDT (20:42 UTC). Coldest (red) cloud top temperatures were as cold as minus 70 degrees Fahrenheit (minus 56.6 Celsius). Credit: NASA/NOAA/NRL
At 5:00 a.m. EDT (11:00 PM HST) on Sept. 6, the National Hurricane Center (NHC) projected that Hurricane Juliette would decline to a tropical storm sometime on Friday and NASA had satellites hovering overhead revealed the hurricane’s slow decline.
The NOAA-NASA Suomi NPP satellite passed over the decaying storm on Sept. 5 at 4:42 p.m. EDT (20:42 UTC) and observed the storm using the Visible Infrared Imaging Radiometer Suite (VIIRS) instrument. VIIRS showed the strongest storms were located in the western quadrant of Juliette. The National Hurricane Center noted 18 minutes later, “Deep convection associated with Juliette has decreased in coverage over the past 24 hours, however, the remaining convection still wraps completely around the center.”
Infrared imagery reveals cloud top temperatures, and the higher the cloud top, the colder it is, and the stronger the storm. Coldest cloud top temperatures were as cold as minus 70 degrees Fahrenheit (minus 56.6 Celsius) and found west of the center of circulation. Storms with cloud tops that cold have been found to generate heavy rainfall. Probably due to the fact that Juliette is decaying, the eye is not well-defined in this image and the strongest storms are no longer ringing the eye.
The NHC reported that at 5 a.m. EDT “(0900 UTC), the center of Hurricane Juliette was located near latitude 22.4 degrees north and longitude 122.7 degrees west which is about 815 miles (1,315 km) west of the southern tip of Baja, California. The maximum sustained winds are 80 mph (130 kph). Juliette is moving toward the northwest near 10 mph (17 kph). A motion toward the west-northwest should begin later tonight or Friday. A turn toward the west is forecast on Saturday and a general westward motion should continue through the weekend. The estimated minimum central pressure is 984 millibars.”
NHC predicts that additional weakening during the next few days, and Juliette is expected to become a tropical storm by Friday night, and degenerate into a remnant low pressure area on Sunday.
Sep. 06, 2019 – NASA Examines Dorian’s Rainfall, Temperatures Along Carolina Coast
As Hurricane Dorian continued to lash the coast of the Carolinas NASA’s IMERG assessed the rainfall the storm generated and NASA’s Aqua satellite provided a look at the temperatures of the cloud tops to assess strength.
NASA’s IMERG Analyzes Rainfall
NASA’s IMERG showed during the past day, most of the areas experiencing over 10 inches of rain accumulation remained offshore, while Dorian did drop heavy rain on South Carolina and North Carolina. The graphic shows the distance that tropical-storm force (39 mph) winds extend from Hurricane Dorian’s low-pressure center, as estimated by the National Hurricane Center. The Saffir-Simpson intensity category is the number following the “H” in the label on the image. The preliminary reports of tornadoes were obtained from NOAA’s Storm Prediction Center, and are shown on the graphic as red circles. Visualization by NASA Goddard.
By Friday morning, September 6, Hurricane Dorian was located off the coast of North Carolina, having generated tornadoes the previous day as the northern rainband came ashore in North Carolina. NASA’s satellite-based real time precipitation estimates suggest that, during the past day, most of the areas experiencing over 10 inches of rain accumulation remained offshore, while Dorian did drop heavy rain on South Carolina and North Carolina.
IMERG showed largest rainfall amounts of more than 36 inches over the Bahamas and in an area off the coast of northeastern Florida. A large area of rainfall between 16 and 24 inches fell off the coast from South Carolina to the Bahamas and in a small area far off the North Carolina coast.
The National Weather Service in Charleston, South Carolina noted that 3.06” fell yesterday, Sept. 5. In Wilmington, North Carolina, a rainfall record was set when Dorian dropped 8.58 inches. New Bern, North Carolina also set a rainfall record, when Dorian dropped 2.95 inches there.
The near-realtime rain estimates come from the NASA’s IMERG algorithm, which combines observations from a fleet of satellites, in near-realtime, to provide global estimates of precipitation every 30 minutes. The storm-total rainfall at a particular location varies with the forward speed of the hurricane, with the size of the hurricane’s wind field, and with how vigorous the updrafts are inside the hurricane. This graphic only shows precipitation that fell starting at 0000 UTC on September 1, and therefore does not show the precipitation that fell in late August, prior to Hurricane Dorian’s approach to the Bahamas.
More Rainfall Forecast from NHC
Using data from the GPM and other satellites, forecasters can estimate rainfall that Dorian will generate along its path.
The NHC said Dorian is expected to produce the following rainfall totals through Saturday: In northeastern North Carolina and additional 3 to 8 inches is forecast with isolated storm totals to 15 inches. Far southeast Virginia can expect 3 to 8 inches, extreme southeastern New England…2 to 4 inches, Nova Scotia and Prince Edward Island…3 to 5 inches and Newfoundland…1 to 2 inches.
Tornado Possibilities
NHC said a few tornadoes were possible during the morning of Sept. 6 across eastern North Carolina into southeastern Virginia.
As Hurricane Dorian interacted with the U.S. East Coast, the only tornado reports occurred from 4:50 a.m. to 5 p.m. EDT on September 5 in North and South Carolina. Scientists think of a hurricane as a heat engine that converts the warmth of the sun-warmed ocean into the kinetic energy of the hurricane’s strong, horizontal wind. When these strong winds reach land, the increased friction of the land surface vs. the ocean surface can convert some of this kinetic energy into tornadoes within the hurricane.
For information about Dorian’s winds, dangerous surf and storm surge, visit www.nhc.noaa.gov.
NASA’s Aqua Satellite Double View
On Sept. 6 at 3:20 a.m. EDT (0720 UTC), NASA’s Aqua satellite provided temperature data on Hurricane Dorian to show where strongest storms were located (red) with cloud top temperatures as cold as minus 70 degrees Fahrenheit (minus 56.6 Celsius). Credit: NASA/NRL
Two instruments aboard NASA’s Aqua satellite used infrared light to analyze the strength of storms Dorian. Infrared data provides temperature information, and the strongest thunderstorms that reach high into the atmosphere have the coldest cloud top temperatures.
On Sept. 6 at 3:20 a.m. EDT (0720 UTC), NASA’s Aqua satellite provided temperature data on Hurricane Dorian to show where strongest storms were located with cloud top temperatures as cold as minus 70 degrees Fahrenheit (minus 56.6 Celsius).
On Sept. 5 at 8:15 a.m. EDT (1215 UTC), the Moderate Imaging Spectroradiometer or MODIS instrument that flies aboard NASA’s Aqua satellite found strongest thunderstorms had cloud top temperatures as cold as or colder than minus 70 degrees Fahrenheit (minus 56.6 Celsius). Those temperatures were in cloud tops of storms around the low-level center of circulation and in a thick band of thunderstorms that wrapped around the storm from west to north to east. Cloud top temperatures that cold indicate strong storms with the potential to generate heavy rainfall.
This false-colored infrared image of Dorian was generated from data taken from the AIRS instrument aboard NASA’s Aqua satellite on Sept. 6 at 3:17 a.m. EDT (0717 UTC). The purple areas indicate strongest storms which were mostly over the Atlantic Ocean and east of the center. Credit: NASA JPL/Heidar Thrastarson
A second instrument aboard NASA’s Aqua satellite called the Atmospheric Infrared Sounder or AIRS instrument also provided infrared data. That data was false-colored in an infrared image created at NASA’s Jet Propulsion Laboratory in Pasadena, Calif. AIRS gathered that data on Sept. 6 at 3:17 a.m. EDT (0717 UTC). The strongest storms were mostly over the Atlantic Ocean and east of the center.
Warnings and Watches on Sept. 6
The NHC posted many warnings and watches on Sept. 6. A Storm Surge Warning is in effect for Salter Path, NC to Poquoson, VA, for the Pamlico and Albemarle Sounds, the Neuse and Pamlico Rivers and the Hampton Roads area of Virginia. A Hurricane Warning is in effect from Surf City to the North Carolina/Virginia border and for the Pamlico and Albemarle Sounds. A Hurricane Watch is in effect for Nova Scotia, Canada.
A Tropical Storm Warning is in effect for the North Carolina/Virginia border to Fenwick Island, DE, for the Chesapeake Bay from Drum Point southward, for the Tidal Potomac south of Cobb Island, for Woods Hole to Sagamore Beach, MA, and for Nantucket and Martha’s Vineyard, MA. A Tropical Storm Watch is in effect for Prince Edward Island, Canada, the Magdalen Island, Fundy National Park to Shediac, and Francois to Boat Harbour.
The Hurricane Warning and the Tropical Storm Warning have been discontinued west of Surf City, North Carolina. The Storm Surge Warning south of Salter Path, North Carolina has been discontinued.
Hurricane Dorian’s Eye Near Cape Hatteras on Sept. 6
At 8 a.m. EDT on Sept. 6, the National Hurricane Center said the eye of Dorian was near Cape Hatteras, North Carolina. It was located near latitude 35.2 degrees north and longitude 75.7 degrees west. Dorian is moving toward the northeast near 14 mph (22 km/h) and this general motion with an increase in forward speed is expected through Saturday, Sept. 7.
Maximum sustained winds are near 90 mph (150 kph) with higher gusts. Dorian is forecast to become a post-tropical cyclone with hurricane-force winds by Saturday night as it approaches Nova Scotia, Canada.
The estimated minimum central pressure based on data from the Air Force Hurricane Hunters and surface observations is 956 millibars.
On the NHC forecast track, the center of Dorian should move to the southeast of extreme southeastern New England tonight and Saturday morning, and then across Nova Scotia late Saturday or Saturday night.
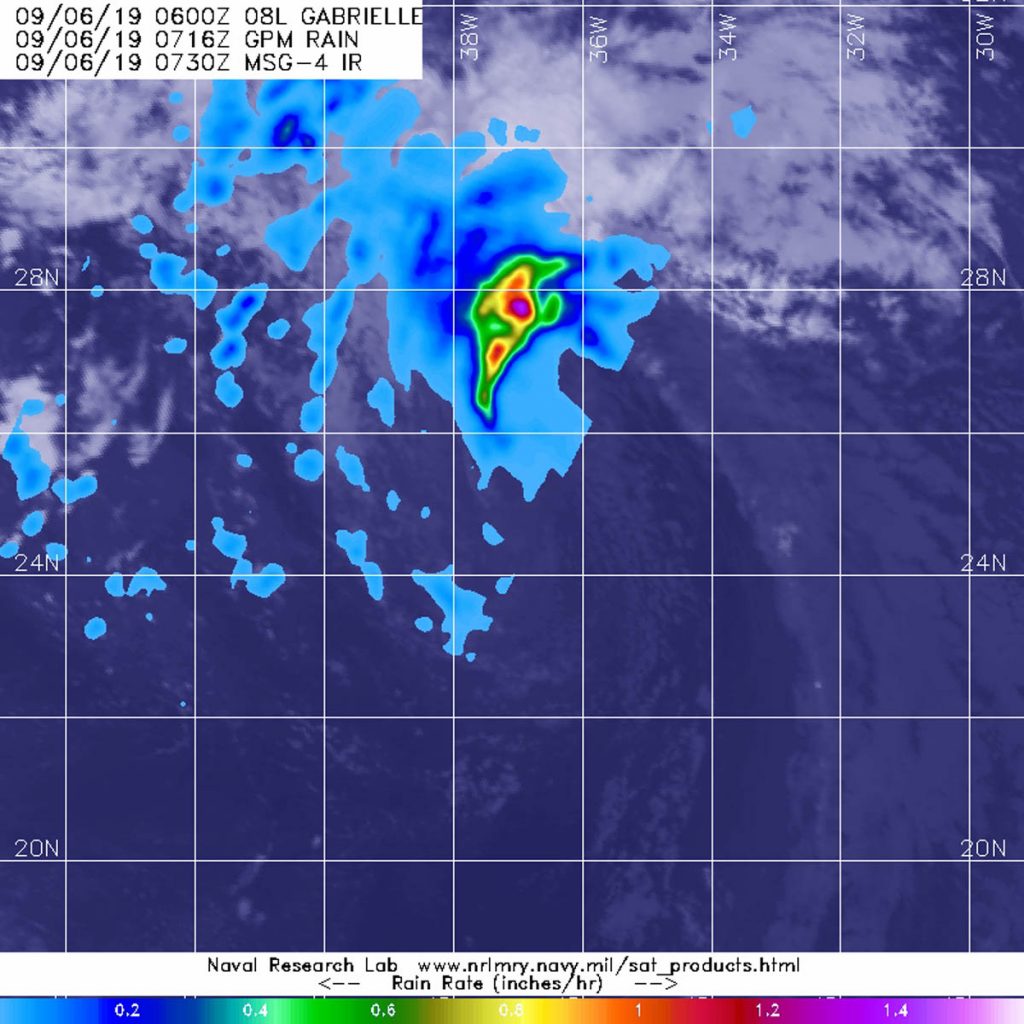
Sep. 06, 2019 – NASA Sees Gabrielle Go “Post-Tropical…” for Now
The Global Precipitation Measurement mission or GPM core satellite passed over the Eastern Atlantic Ocean and observed that Tropical Storm Gabrielle had become post-tropical. GPM also gathered data on rainfall rates occurring in transformed and elongated storm.
The GPM core satellite passed over Post-Tropical Storm Gabrielle on Sept. 6 at 3:30 a.m. EDT (0730 UTC). GPM found the heaviest rainfall (purple) occurring nearly 200 miles north of the elongated center where it was falling at a rate of over 36 mm (about 1.4 inch) per hour. Areas of rainfall of about 25 mm (1 inch per hour) surrounded those stronger storms. Credit: NASA/JAXA/NRL
NOAA’s National Hurricane Center (NHC) said at 5 a.m. EDT on Sept. 6 that Gabrielle has become a post-tropical cyclone over the eastern Atlantic, because “Poorly defined Gabrielle has not produced any organized deep convection (strong thunderstorms) since Thursday morning.” However, regeneration into a tropical storm is expected to occur over the weekend.
A Post-Tropical Storm is a generic term for a former tropical cyclone that no longer possesses sufficient tropical characteristics to be considered a tropical cyclone. Former tropical cyclones that have become fully extratropical, subtropical, or remnant lows, are three classes of post-tropical cyclones. In any case, they no longer possesses sufficient tropical characteristics to be considered a tropical cyclone. However, post-tropical cyclones can continue carrying heavy rains and high winds.
The GPM satellite passed over Gabrielle on Sept. 6 at 3:30 a.m. EDT (0730 UTC). GPM found the heaviest rainfall in nearly 200 miles north of the elongated center, where it was falling at a rate of over 36 mm (about 1.4 inch) per hour. Areas of rainfall of about 25 mm (1 inch per hour) surrounded those stronger storms. GPM is a joint mission between NASA and the Japan Aerospace Exploration Agency, JAXA.
At 5 a.m. EDT (0900 UTC), NHC reported the center of Post-Tropical Cyclone Gabrielle was located near latitude 25.5 degrees north and longitude 37.6 degrees west. That is about 1,095 miles (1,760 km) northwest of the Cabo Verde Islands. The post-tropical cyclone is moving toward the northwest near 12 mph (19 kph). A turn to the west-northwest with a slight increase in forward speed is expected over the next couple of days. A decrease in forward speed and a turn to the north are forecast to occur by Sunday morning. Maximum sustained winds are near 40 mph (65 kph) with higher gusts.
Gabrielle is expected to weaken into a post-tropical remnant low by tonight. Thereafter, slow strengthening is expected to occur over the weekend, and the remnants of Gabrielle is forecast to regenerate into a tropical cyclone at that time.
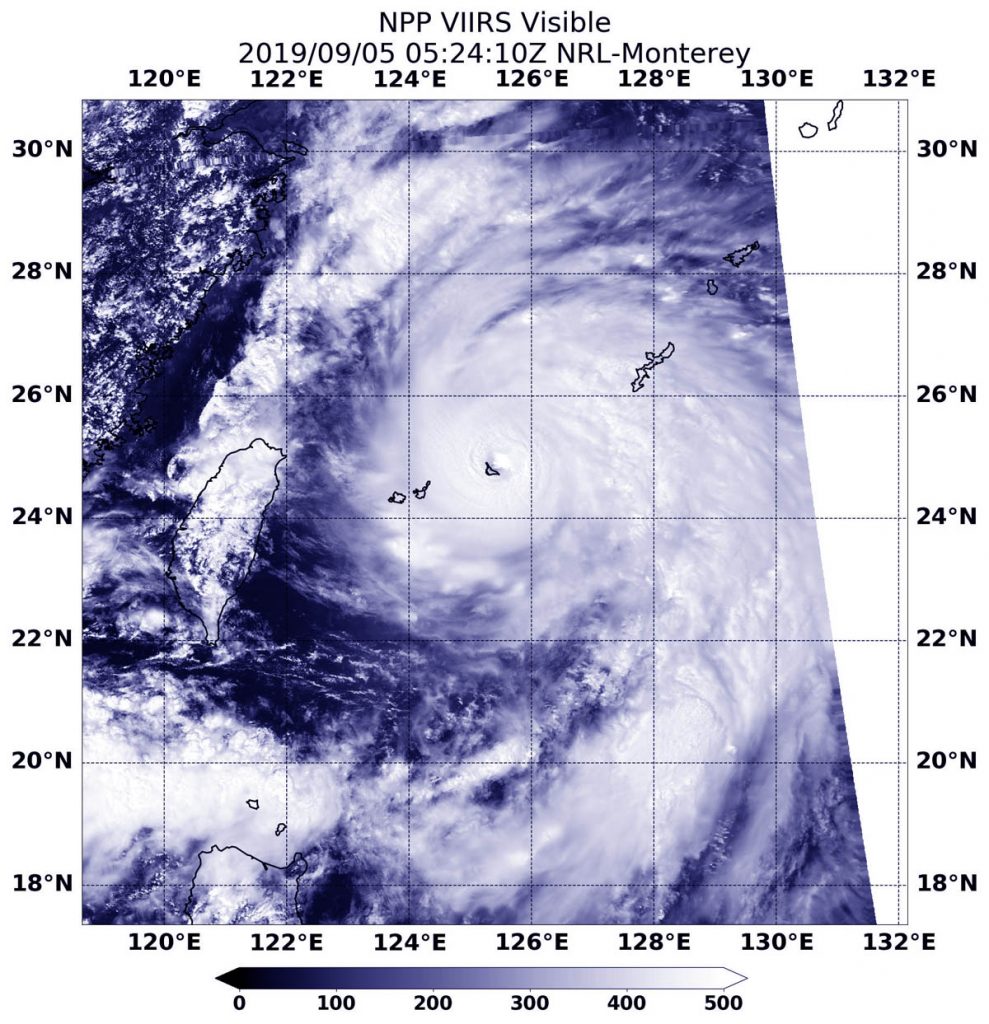
Sep. 05, 2019 – NASA-NOAA Satellite Sees Typhoon Lingling’s Eye Near Miyako
Typhoon Lingling’s eye was passing near the island of Miyako when NASA-NOAA’s Suomi NPP satellite passed overhead on Sept. 5. Miyako is one of the Ryukyu Islands located in the Northwestern Pacific Ocean.
NASA-NOAA’s Suomi NPP satellite passed over Typhoon Lingling and the VIIRS instrument aboard captured this image of the storm on Sept. 5 at 1:24 a.m. EDT (0524 UTC) that showed the southwestern part of the eye near the Ryukyu Island chain’s Miyako Island. Credit: NASA/NOAA/NRL
The Ryukyu Islands are a chain of Japanese islands that stretch southwest from Kyushu to Taiwan.
On Sept. 5 at 1:24 a.m. EDT (0524 UTC), the Visible Infrared Imaging Radiometer Suite (VIIRS) instrument aboard Suomi NPP captured the visible image that showed the southwestern eyewall of Typhoon Lingling over the island of Miyako. In the image, Okinawa was being affected by the northeastern quadrant of the storm, and the islands of Senkaku and Yaeyama were experiencing winds and rain from the southwestern quadrant.
At 11 a.m. EDT (1500 UTC) on Sept. 5, the Joint Typhoon Warning Center (JTWC) noted that Lingling had maximum sustained winds near 115 knots. It was centered near 25.7 degrees north latitude and 125.3 degrees east longitude, about 143 miles west-southwest of Kadena Air Base, Okinawa Island, Japan. It was moving to the north.
Lingling is moving north and the JTWC forecasters noted it has reached peak intensity. The system is expected to weaken on approach to the Korean peninsula, but still be at typhoon strength at landfall near Pyongyang, North Korea.