Sep. 14, 2020 – NASA’s Aqua Satellite Finds Rene Barely a Depression Battered by Wind Shear
Tropical Depression Rene continues to be the victim of strong wind shear and forecasters anticipate it will lead to the storm’s demise in the next couple of days. NASA’s Aqua satellite viewed the storm in infrared light to find wind shear was pushing Rene’s strongest storms away from the center, preventing the storm from re-organizing and strengthening.
NASA’s Aqua Satellite Reveals Effects of Wind Shear
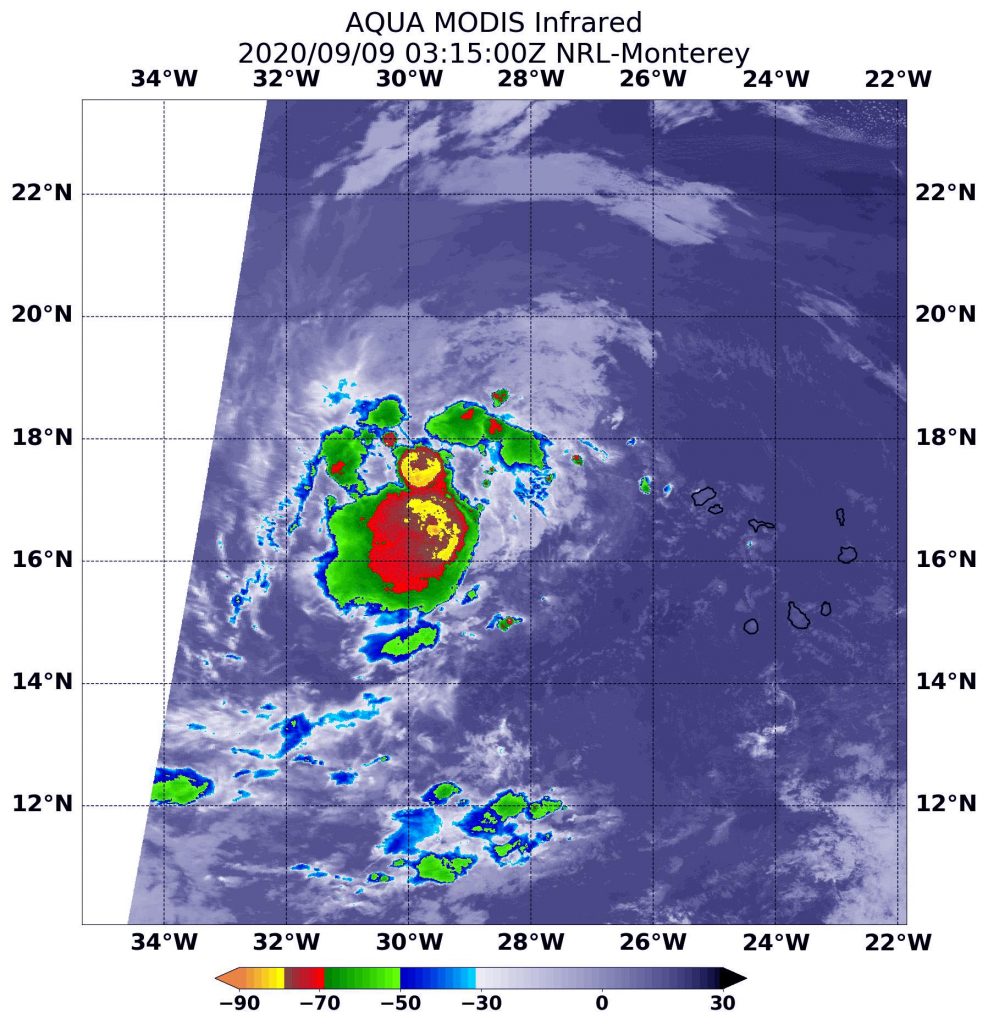
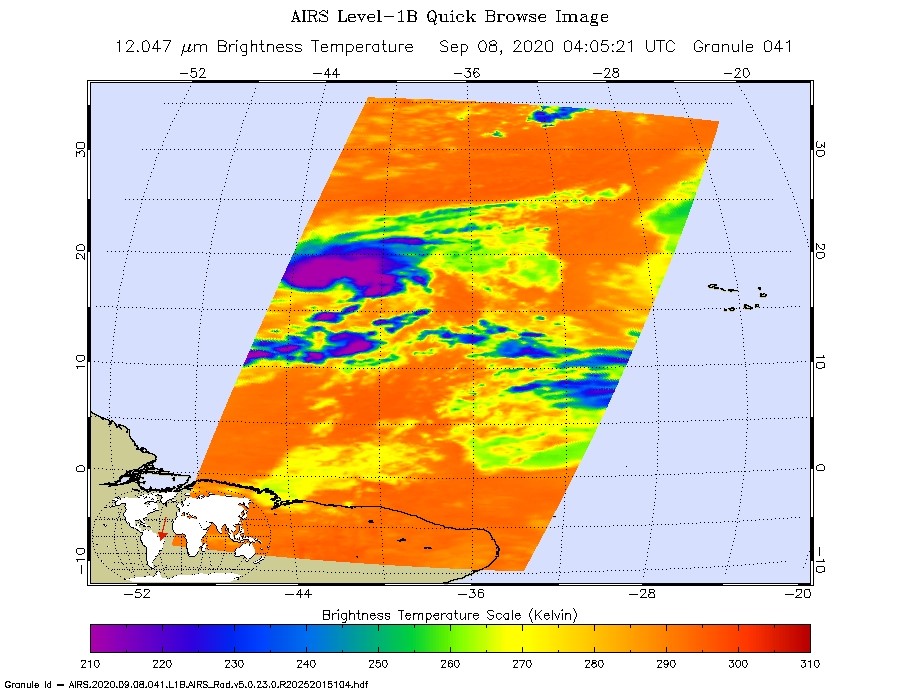
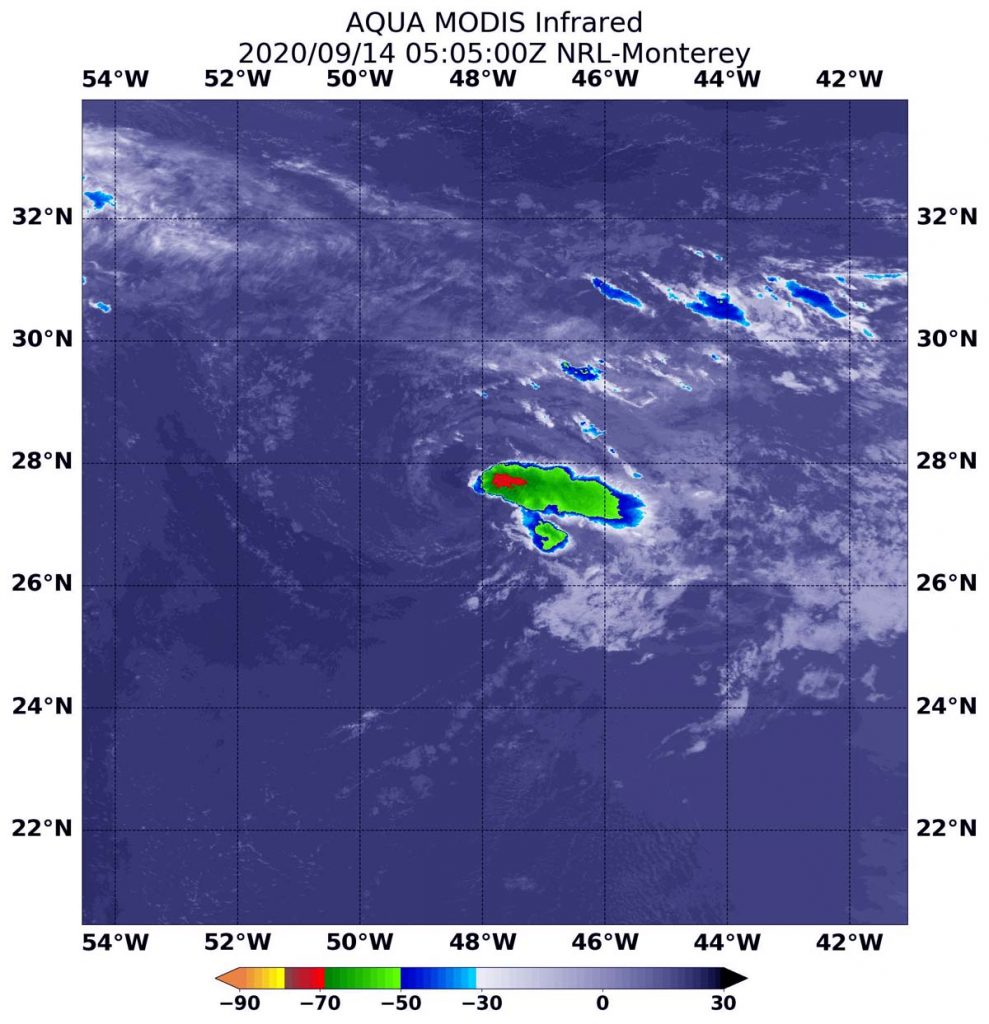
On instrument aboard NASA’s Aqua satellite uses infrared light to analyze cloud top temperatures in a tropical cyclone’s clouds to determine strength. The strongest thunderstorms that reach high into the atmosphere have the coldest cloud top temperatures.
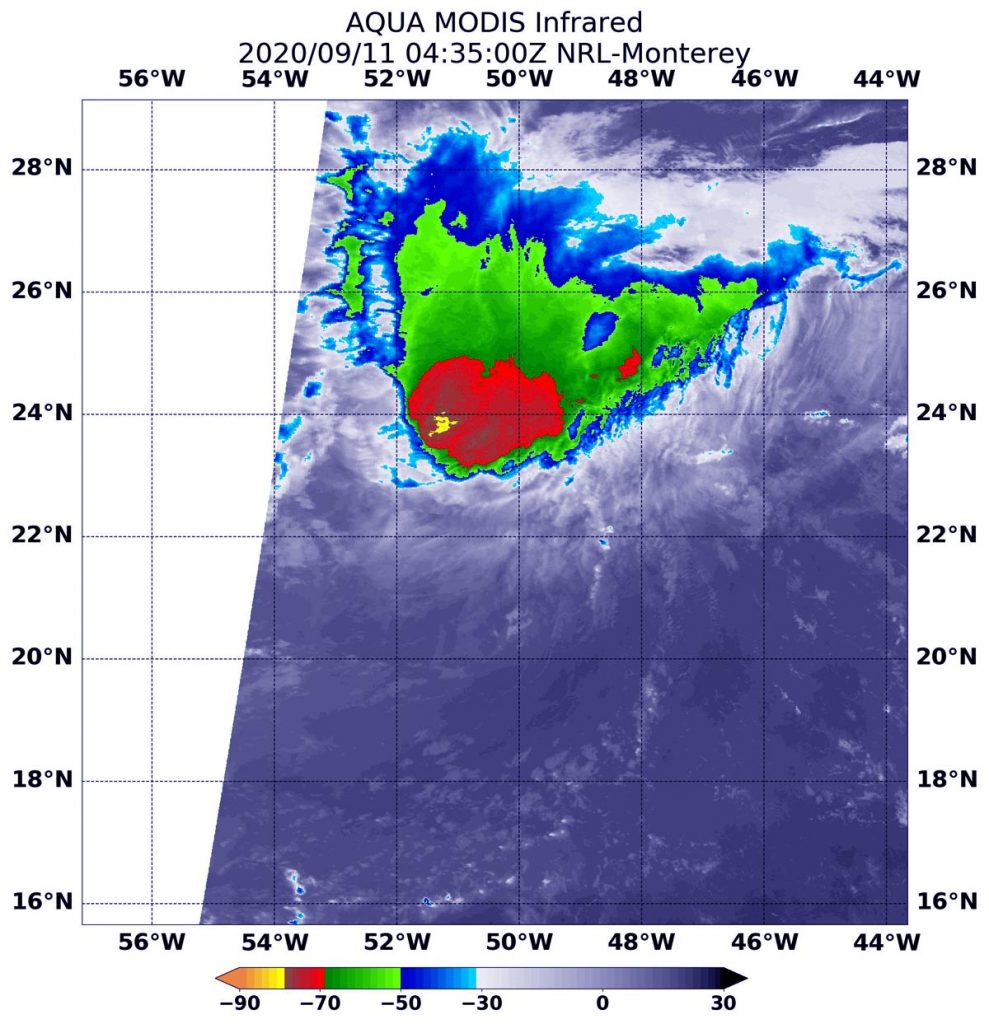
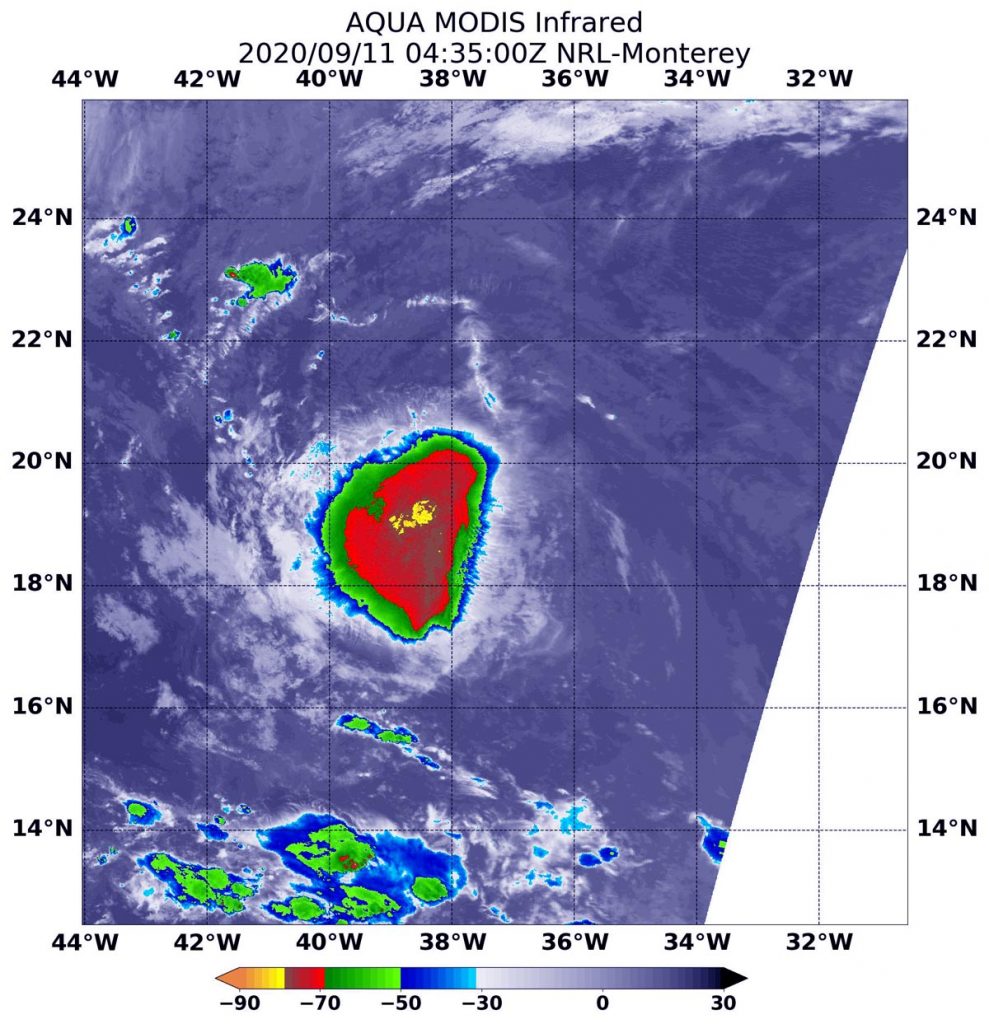
On Sept. 15 at 1:05 a.m. EDT (0505 UTC), the Moderate Resolution Imaging Spectroradiometer or MODIS instrument that flies aboard NASA’s Aqua satellite gathered infrared data on Rene that confirmed wind shear was adversely affecting the storm. Persistent north-northeasterly vertical wind shear showed strongest storms (red) pushed to the east-southeast of the center where cloud top temperatures were as cold as minus 70 degrees Fahrenheit (minus 56.6 Celsius).
National Hurricane Center forecaster Jack Beven noted, “Rene continues to produce just enough deep convection to keep it from degenerating to a remnant low. However, it is expected to degenerate later today due to the ongoing impact of strong west-northwesterly vertical shear and dry air entrainment.”
Wind Shear Affecting Rene
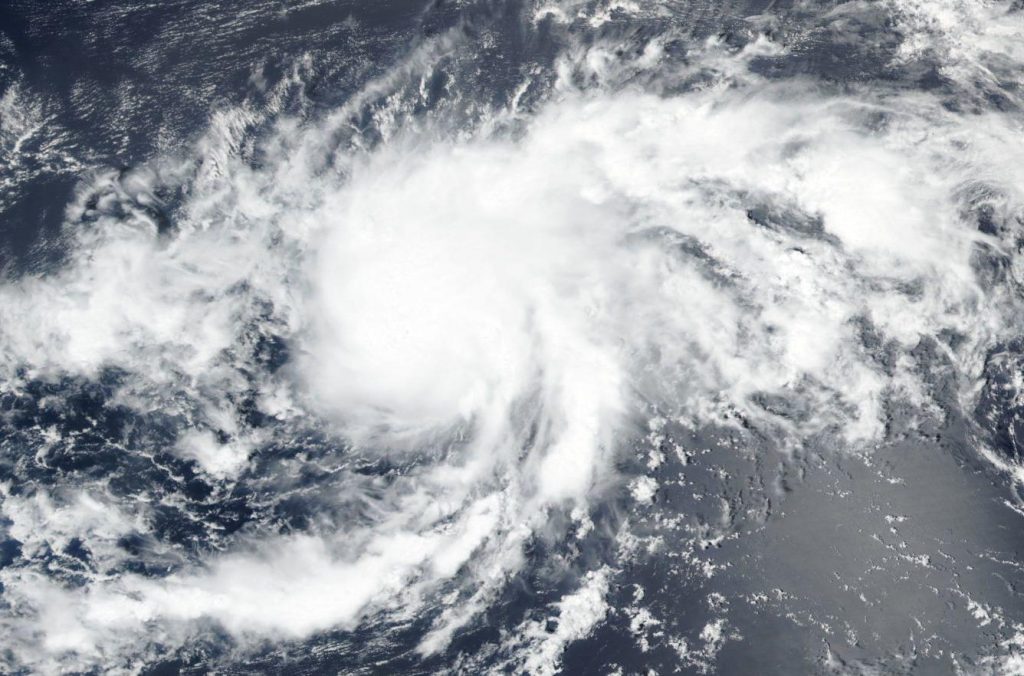
The shape of a tropical cyclone provides forecasters with an idea of its organization and strength. When outside winds batter a storm, it can change the storm’s shape and push much of the associated clouds and rain to one side of it. That is what wind shear does.
In general, wind shear is a measure of how the speed and direction of winds change with altitude. Tropical cyclones are like rotating cylinders of winds. Each level needs to be stacked on top each other vertically in order for the storm to maintain strength or intensify. Wind shear occurs when winds at different levels of the atmosphere push against the rotating cylinder of winds, weakening the rotation by pushing it apart at different levels.
Status of Tropical Depression Rene
At 5 a.m. EDT (0900 UTC), the center of Tropical Depression Rene was located near latitude 27.4 degrees north and longitude 48.3 degrees west. Rene is centered about 1,115 miles (1,795 km) northeast of the Leeward Islands. The depression is moving toward the west near 3 mph (6 km/h). Maximum sustained winds are near 30 mph (45 kph) with higher gusts. The estimated minimum central pressure is 1011 millibars.
Rene’s Forecast
A faster motion toward the west-southwest or southwest is forecast to begin later today, Sept. 14 and continue through dissipation. Weakening is forecast, and Rene is expected to become a remnant low later today and dissipate by Wednesday, Sept. 16.
NASA Researches Tropical Cyclones
Hurricanes/tropical cyclones are the most powerful weather events on Earth. NASA’s expertise in space and scientific exploration contributes to essential services provided to the American people by other federal agencies, such as hurricane weather forecasting.
For more than five decades, NASA has used the vantage point of space to understand and explore our home planet, improve lives and safeguard our future. NASA brings together technology, science, and unique global Earth observations to provide societal benefits and strengthen our nation. Advancing knowledge of our home planet contributes directly to America’s leadership in space and scientific exploration.
For updated forecasts. visit: www.nhc.noaa.gov