Alvin (Eastern Pacific Ocean)

June 27, 2019 – NASA’s Terra Satellite Eyes Tropical Storm Alvin

Visible imagery from NASA’s Terra satellite showed Tropical Storm Alvin had organized and strengthened into a strong tropical storm, just over 500 miles from Mexico’s Baja California peninsula.

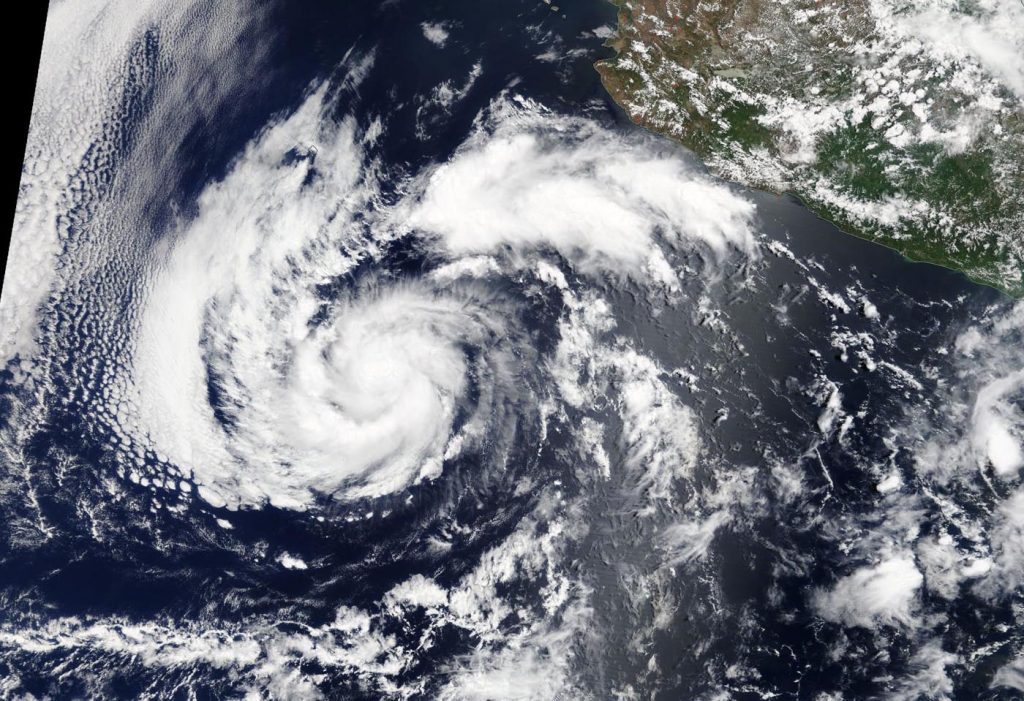
On June 27, the Moderate Resolution Imaging Spectroradiometer or MODIS instrument aboard NASA’s Terra satellite provided a visible image of Alvin. Satellite imagery revealed that Alvin’s clouds appeared more organized than they did the previous day.
satellite image of Alvin
On June 27, 2019, the MODIS instrument aboard NASA’s Terra satellite provided a visible image of Tropical Cyclone Alvin, located over 500 miles west of Baja California, Mexico. Credit: NASA Worldview, Earth Observing System Data and Information System (EOSDIS)

Recent microwave imagery also showed that Alvin’s “convective structure,” or the development and organization of thunderstorms around the low-level center) has improved during the morning of June 27. AT 6:57 a.m. EDT (1057 UTC). The Special Sensor Microwave/Imager (SSM/I) instrument aboard Defense Meteorological Satellite Program satellite showed a closed ring of convection (clouds and storms) around the mid-level center of the small tropical storm. Infrared satellite imagery revealed that Alvin has not changed significantly.

NOAA’s National Hurricane Center (NHC) reported at 11 a.m. EDT (1500 UTC), the center of Tropical Storm Alvin was located near latitude 15.8 degrees north and longitude 113.1 degrees west. That’s about 535 miles (855 km) south-southwest of the southern tip of Baja California.

Maximum sustained winds are near 60 mph (95 kph) with higher gusts. Alvin is moving toward the west-northwest near 14 mph (22 kph), and this general motion is expected to continue for the next day or so. The estimated minimum central pressure is 999 millibars (29.50 inches).

Some strengthening is possible during the next 24 hours before Alvin reaches cooler waters.  Weakening is the expected to begin on Friday and the NHC said Alvin is forecast to become a remnant low on Saturday.

For updated forecasts, visit: www.nhc.noaa.gov

Rob Gutro
NASA’s Goddard Space Flight Center, Greenbelt, Md.

Alvin – Eastern Pacific Ocean

June 26, 2019 – NASA Analyzes Alvin, the First Eastern Pacific Tropical Storm

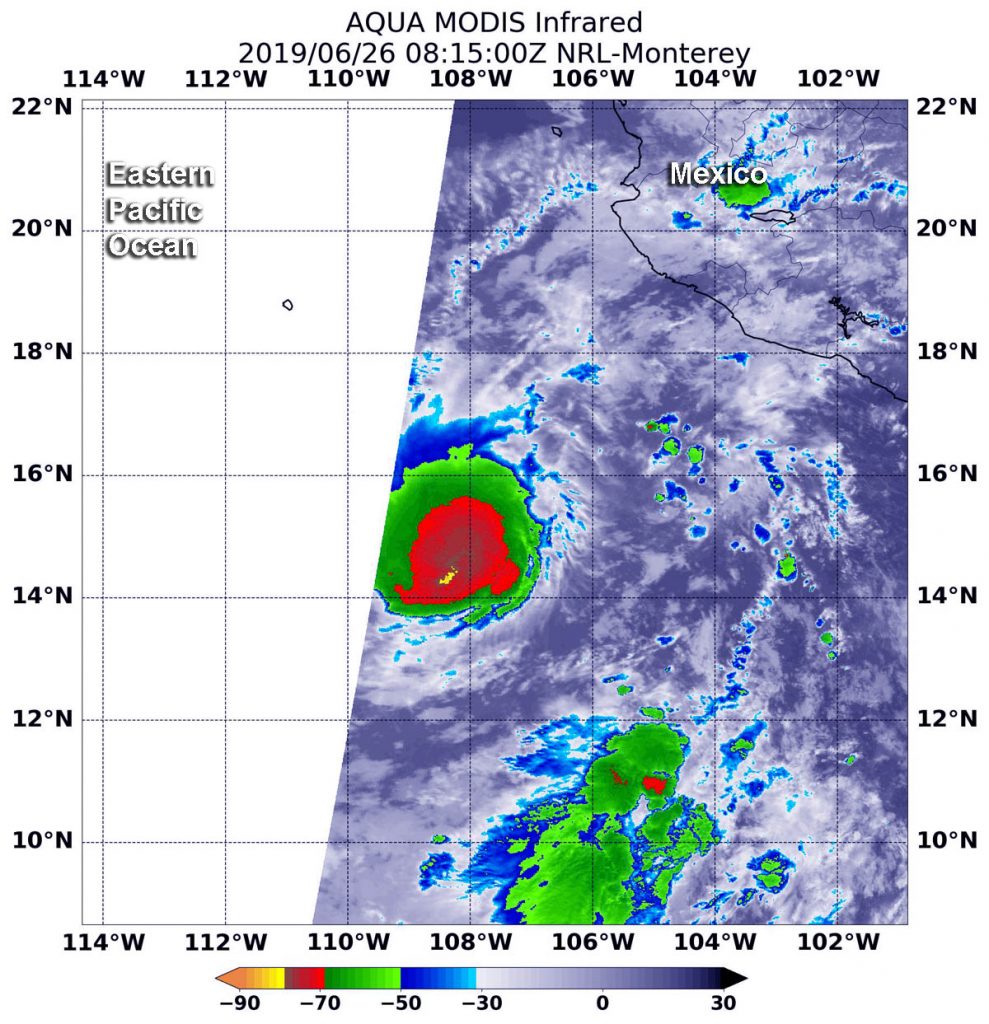
The Eastern Pacific Ocean has spawned its first tropical storm of the 2019 hurricane season, and NASA’s Aqua satellite measured the cloud top temperatures within to gauge its strength.

infrared image of Alvin
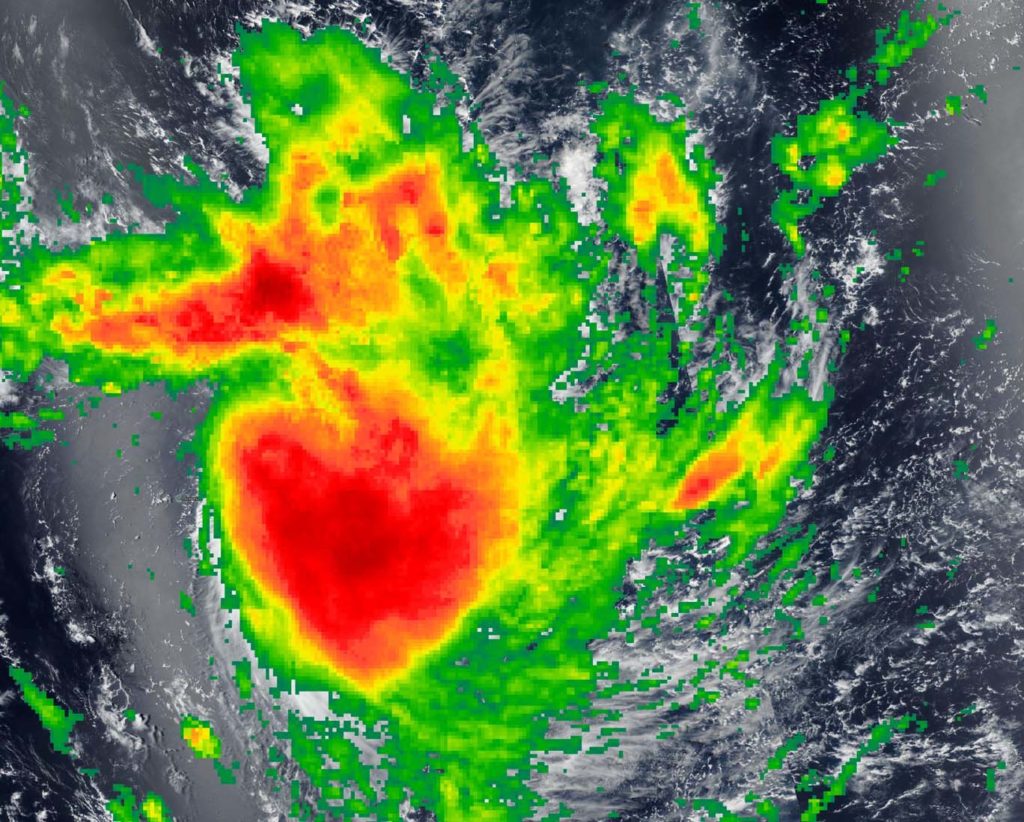
On June 26 at 4:15 a.m. EDT (0815 UTC), NASA’s Aqua satellite revealed cloud top temperatures in strongest storms were near Tropical Storm Alvin’s center of circulation. Those temperatures were as cold as or colder than minus 70 degrees (red) Fahrenheit (minus 56.6 degrees Celsius). Credit: NASA/NRL

Infrared satellite imagery provides temperature data, and when NASA’s Aqua satellite passed over the system it was still a depression, but showing powerful thunderstorm development. Cloud top temperatures determine strength of the thunderstorms that make up a tropical cyclone. The colder the cloud tops, the stronger the uplift in the storms that help thunderstorm development. Infrared data helps determine where the most powerful storms are within a tropical cyclone.

The Moderate Resolution Imaging Spectroradiometer or MODIS instrument aboard Aqua provided that infrared data on June 26 at 4:15 a.m. EDT (0815 UTC). The MODIS data showed the strongest thunderstorms were near the center of circulation. They were as cold as or colder than minus 70 degrees Fahrenheit (minus 56.6 degrees Celsius). NASA research indicates very cold cloud tops with the potential to generate very heavy rainfall.

Tropical Depression One-E strengthened into a tropical storm and named Alvin at 11 a.m. EDT (1500 UTC) on Wednesday, June 26, 2019. At that time, NOAA’s National Hurricane Center noted that the center of Tropical Storm Alvin was located near latitude 14.7 degrees north and longitude 109.4 degrees west. That puts Alvin far from land areas and about 450 miles (725 km) southwest of Manzanillo, Mexico. Alvin is also about 565 miles (915 km) south of the southern tip of Baja California. As a result, there are no coastal watches or warnings in effect.
Alvin is moving toward the west near 14 mph (22 kph) and the NHC expects a westward to west-northwestward motion with some decrease in forward speed over the next few days. Maximum sustained winds have increased to near 40 mph (65 kph) with higher gusts.

Some additional strengthening is forecast during the next day or so. Weakening is forecast to begin on Friday, and Alvin is expected to become a remnant low on Saturday.

For updated forecasts, visit: www.nhc.noaa.gov.

By Rob Gutro
NASA’s Goddard Space Flight Center, Greenbelt, Md.
Vayu (was 02A) – Northern Indian Ocean

June 17 Update – NASA-NOAA Satellite Finds Dry Air Affecting Tropical Cyclone Vayu

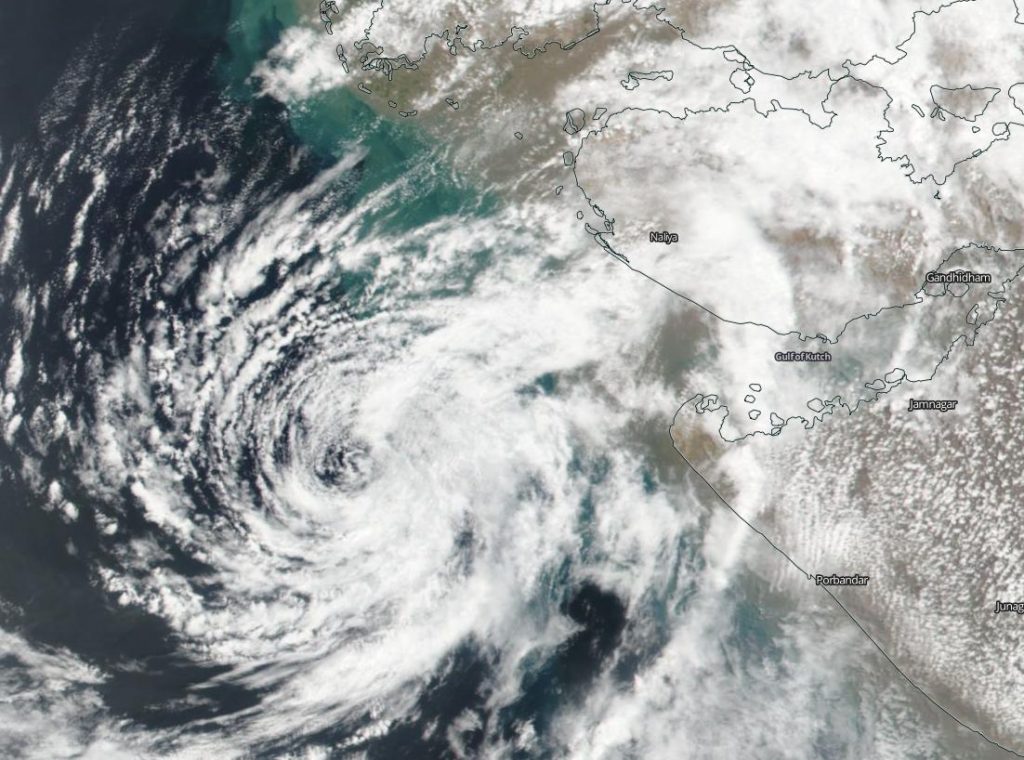
Tropical Cyclone Vayu was fading as it neared the coast of southwestern Pakistan and northwestern India. Dry air and wind shear were preventing development the development of thunderstorms, making the clouds on the storm’s western side appear wispy in an image from NASA-NOAA’s Suomi NPP satellite.

satellite image of Vayu
NASA-NOAA’s Suomi NPP satellite passed over the Arabian Sea on June 17 and saw the effects of dry air on Tropical Cyclone Vayu’s western quadrant where only wispy clouds were seen. Credit: NASA Worldview, Earth Observing System Data and Information System (EOSDIS).

The Visible Infrared Imaging Radiometer Suite (VIIRS) instrument aboard Suomi NPP provided a visible image of the storm on June 17, 2019. The VIIRS image showed that dry air that moved into the storm on the western side had prevented further development of the thunderstorms that make up a tropical cyclone. Clouds on that side of Vayu appeared wispy and were precipitation free. Thicker clouds were visible on Vayu’s eastern side where some had already spread over the coast of northwestern Indian near Naliya. Vayu is forecast to make landfall near Naliya later in the day.

On June 17 at 0300 UTC (June 16 at 11 p.m. EDT), the Joint Typhoon Warning Center issued the final warning on Vayu. At that time, Tropical Cyclone Vayu was located near 21.8 degrees north latitude and 66.8 degrees east longitude, approximately 180 nautical miles south of Karachi, Pakistan. Vayu was moving to the northeast and had maximum sustained winds near 35 knots (40 mph/65 kph) making it a minimal tropical storm.

In addition to dry air sapping the tropical cyclone’s ability to create more thunderstorms, wind shear is pushing the remaining storms to the east of the center.

In general, wind shear is a measure of how the speed and direction of winds change with altitude. Tropical cyclones are like rotating cylinders of winds. Each level needs to be stacked on top each other vertically in order for the storm to maintain strength or intensify. Wind shear occurs when winds at different levels of the atmosphere push against the rotating cylinder of winds, weakening the rotation by pushing it apart at different levels.

Vayu is forecast to dissipate later in the day on June 17.

By Rob Gutro
NASA’s Goddard Space Flight Center  

Idai (Southern Indian Ocean)

March 22, 2019 – NASA’s IMERG Calculates Excessive Mozambique Rainfall from Cyclone Idai

Tropical Cyclone Idai brought heavy rainfall and deadly flooding to Mozambique. Idai made landfall directly on top of the City of Beira in Mozambique. This City is home to more than 500,000 people who have been impacted by flooding and other damage caused by the cyclone.

The Precipitation Processing System (PPS) at NASA’s Goddard Space Flight Center in Greenbelt, Md. processes and creates the realtime IMERG data products.  This Global Precipitation Measurement mission or GPM IMERG animation, created at NASA shows accumulated precipitation for the region from March 3 to 19.  IMERG showed over 20 inches of rain fell in some areas. The other piece of analysis is that the early precipitation saturated the soil, which made the flooding worse when the cyclone turned around and made landfall.

The Integrated Multi-satellitE Retrievals for GPM (IMERG) creates a merged precipitation product from the GPM constellation of satellites. These satellites include DMSPs from the U.S. Department of Defense, GCOM-W from the Japan Aerospace Exploration Agency (JAXA), Megha-Tropiques from the Centre National D’etudies Spatiales (CNES) and Indian Space Research Organization (ISRO), NOAA series from the National Oceanic and Atmospheric Administration (NOAA), Suomi-NPP from NOAA-NASA, and MetOps from the European Organisation for the Exploitation of Meteorological Satellites (EUMETSAT).  All of the instruments (radiometers) onboard the constellation partners are intercalibrated with information from the GPM Core Observatory’s GPM Microwave Imager (GMI) and Dual-frequency Precipitation Radar (DPR).

For NASA’s Disaster resource website, visit: https://disasters.nasa.gov/cyclone-idai-2019

By Jacob Reed
NASA’s Goddard Space Flight Center, Greenbelt, Md.
Joaninha (Southern Indian Ocean)

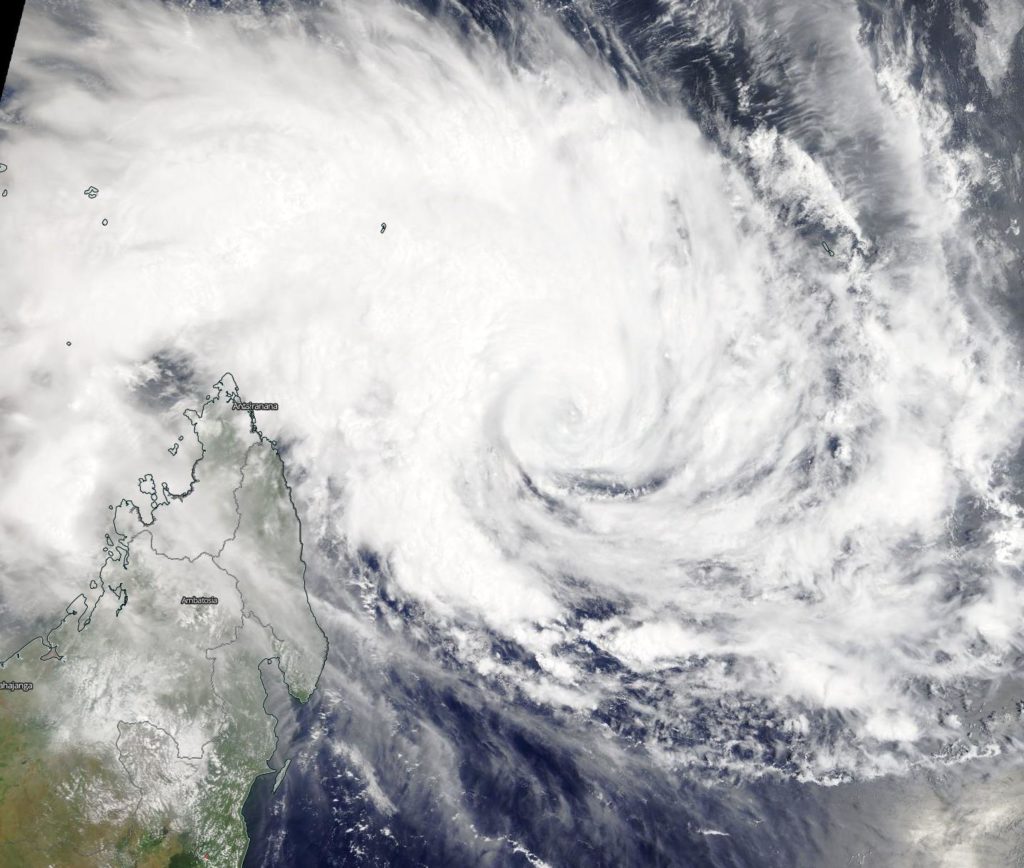
March 22, 2019 – NASA Catches Development of Tropical Cyclone Joaninha
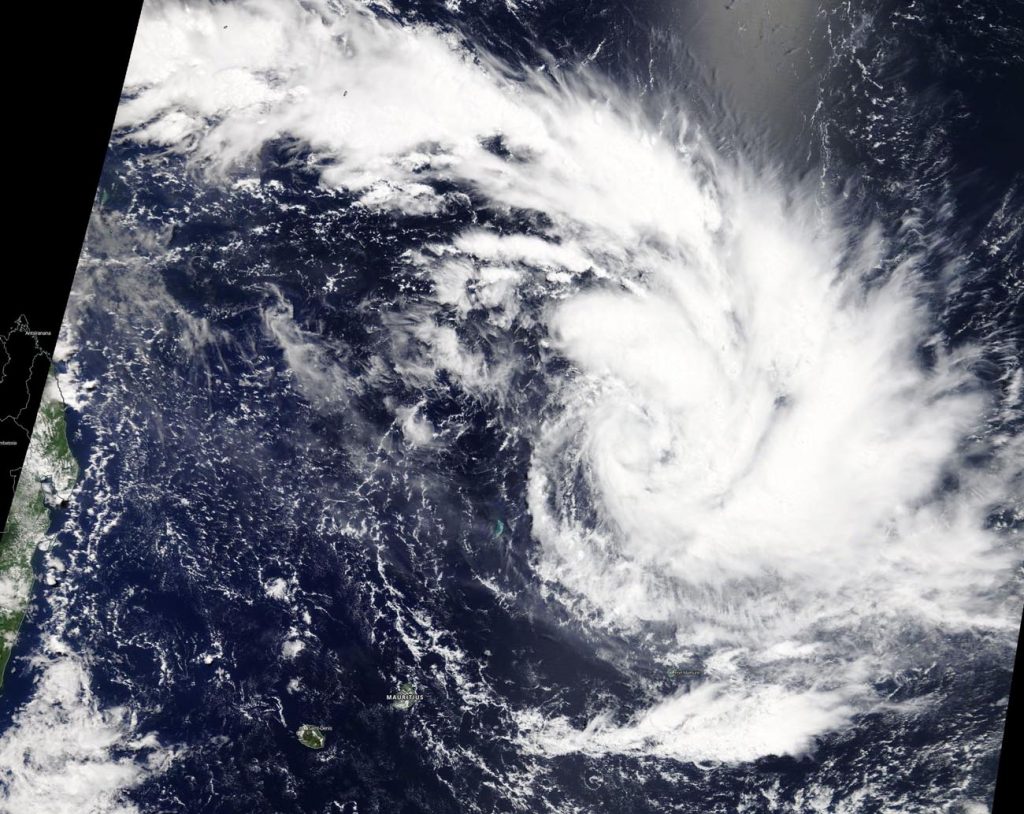
satellite image of Joaninha
On March 22, 2019, the MODIS instrument aboard NASA’s Terra satellite provided a visible image of Tropical Cyclone Joaninha in the Southern Indian Ocean, east of Madagascar (seen to the left). Credit: NASA Worldview, Earth Observing System Data and Information System (EOSDIS)

Visible imagery from NASA’s Terra satellite showed Tropical Cyclone Joaninha in the Southern Indian Ocean, far to the east of Madagascar.

On March 22 the Moderate Resolution Imaging Spectroradiometer or MODIS instrument aboard NASA’s Terra satellite provided a visible image of Joaninha soon after it developed. Born as Tropical Depression 22S, it quickly intensified into a tropical storm and was renamed Joaninha. Convective (rising air that consolidates into clouds and storms) bands of thunderstorms spiraled into the center of circulation from the north and east. The center of circulation was obscured by high clouds.

At 11 a.m. EDT on March 22, 2019, maximum sustained winds near Joaninha’s center were near 46 mph (40 knots/74 kph). Joaninha was centered near 15.0 degrees south latitude and 62.4 degrees east longitude. That’s about 760 nautical miles southwest of Diego Garcia in the Central Indian Ocean. Diego García is an atoll, located just south of the equator.

Joaninha is forecast to move south, later southeast, while continuing to intensify. The Joint Typhoon Warning Center or JTWC expects Joaninha’s sustained winds to peak at 115 mph (100 knots /185 kph). The storm is forecast to pass far to the east of Mauritius and La Reunion Island. After four days, at the tropical cyclone will start to weaken as conditions deteriorate.

By Rob Gutro
NASA’s Goddard Space Flight Center, Greenbelt, Md.
Gelena (Southern Indian Ocean)

Feb. 8, 2019 – NASA’s Aqua Satellite Finds Tropical Cyclone Gelena’s Strongest Side

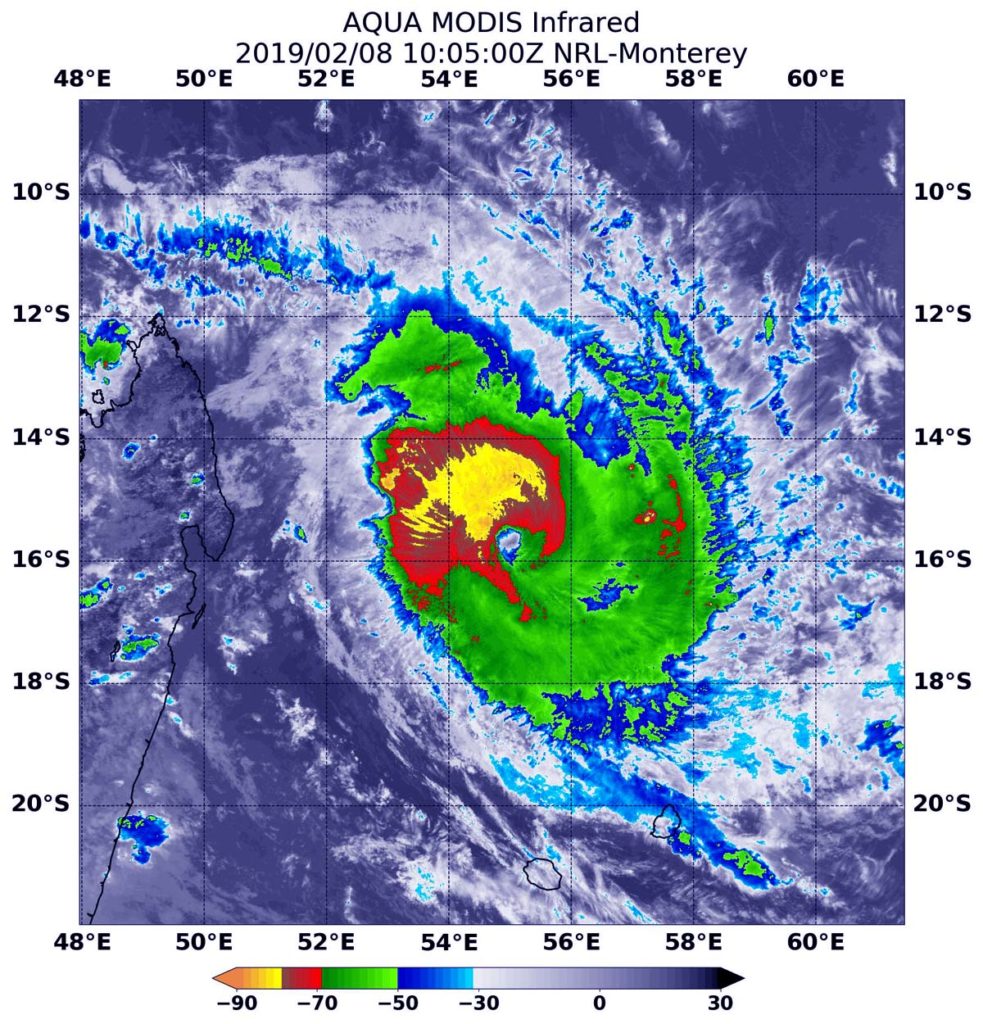
NASA’s Aqua satellite passed over the Southern Indian Ocean and captured an infrared image of Tropical Cyclone Gelena that revealed strongest storms were northwest of the eye.

Satellite image of storm Gelena
At 5:05 a.m. EST (1005 UTC) on Feb. 8, the MODIS instrument that flies aboard NASA’s Aqua satellite gathered infrared data on Tropical Cyclone Gelena. Strongest thunderstorms were in the northwestern quadrant of the storm, where cloud top temperatures were as cold as minus 80 degrees Fahrenheit (minus 62 Celsius) and appear in yellow in this false colored image. Credit: NASA/NRL

On Feb. 8, a tropical cyclone warning class 2 is in force at Mauritius and Rodrigues.

At 5:05 a.m. EST (1005 UTC) on Feb. 8 the MODIS instrument that flies aboard NASA’s Aqua satellite gathered infrared data on Tropical Cyclone Gelena. Infrared data provides temperature information. MODIS found coldest cloud top temperatures as cold as minus 80 degrees Fahrenheit (minus 62 Celsius) in storms in the northwestern quadrant, outside of the eye. NASA research has shown that cloud tops with temperatures that cold were high in the troposphere and have the ability to generate heavy rain.

At 10 a.m. EDT (1500 UTC), the center of Tropical Cyclone Gelena was located near latitude 15.7 degrees south and longitude 55.3 degrees east. That’s about 288 nautical miles north-northwest of Port Louis, Mauritius. Maximum sustained winds were near 105 knots (121 mph/194.5 kph) and strengthening.

The Joint Typhoon Warning Center noted that Gelena will strengthen to 130 knots (149.6 /241 kph) within 24 hours. Although a weakening trend will then begin, Gelena is forecast to have winds of about 120 knots (138 mph/222 kph) upon closest approach to Rodrigues on Feb. 9.

Rob Gutro
NASA’s Goddard Space Flight Center, Greenbelt, Md.
Funani (Southern Indian Ocean)

Feb. 8, 2019 – NASA Looks at Tropical Cyclone Funani’s Rainfall Rates

Tropical Cyclone Funani continued tracking southeast through the Southern Indian Ocean on Feb. 7, 2019. When the GPM satellite passed overhead, it revealed that Funani’s strongest rains wrapped around the center and extended northwest.

The Global Precipitation Measurement mission, or GPM, core satellite passed over Tropical Cyclone Funani on Feb. 8. GPM found the heaviest rainfall around the center and a fragmented band of thunderstorms northwest of center. In both areas rain was falling at a rate between 10 and 13 mm (0.4 and 0.5 inches) per hour. GPM is a joint mission between NASA and the Japan Aerospace Exploration Agency, JAXA.

satellite image of Funani rainfall
The GPM core satellite passed over Tropical Cyclone Funani on Feb. 8, 2019. GPM found the heaviest rainfall (red) was around the center and a fragmented band of thunderstorms northwest of center. In both areas rain was falling at a rate between 10 and 13 mm (0.4 and 0.5 inches) per hour. Credit: NASA Worldview, Earth Observing System Data and Information System (EOSDIS), JAXA
Link to high-res image: https://go.nasa.gov/2Sg1ASi

At 10 a.m. EST (1500 UTC), the center of Funani was located near latitude 24.4 degrees south and longitude 71.2 degrees west. That’s about 813 nautical miles east-southeast of Port Louis, Mauritius. Maximum sustained winds were near 105 knots (121 mph/195 kph).

Forecasters at the Joint Typhoon Warning Center expect Funani will continue to move southeast. The storm will gradually weaken before becoming extra-tropical after a day or so.

Rob Gutro
NASA’s Goddard Space Flight Center, Greenbelt, Md.  
Gelena (Southern Indian Ocean)

Feb. 7, 2019 – NASA Satellite Shows Tropical Cyclone Gelena Near Madagascar

A visible-light image from NASA’s Terra satellite revealed Tropical Cyclone Gelena was strengthening off the northeastern coast of Madagascar.

Satellite image of Gelena
On Feb. 7, 2019, the MODIS instrument aboard NASA’s Terra satellite provided a visible-light image of Tropical Cyclone Gelena in the Southern Indian Ocean. The image showed thunderstorms wrapping into the low-level center. Credit: NASA Worldview, Earth Observing System Data and Information System (EOSDIS)
High-resolution Link: https://go.nasa.gov/2HYKvru

On Feb. 7, 2019, the Moderate Resolution Imaging Spectroradiometer, or MODIS, instrument aboard NASA’s Terra satellite captured a visible image of Tropical Cyclone Gelena. The visible-light image showed bands of thunderstorms wrapping into what the Joint Typhoon Warning Center called “an intermittent eye feature.” The western quadrant had the bulk of clouds and thunderstorms that extended to the northern tip of Madagascar.

At 10 a.m. EDT (1500 UTC) on Feb. 7, Gelena was located near 13.1 degrees south latitude and 53.7 east longitude, approximately 453 nautical miles north-northwest of St. Denis, La Reunion Island. Gelena was moving to south-southeast. Maximum sustained winds were near 75 knots (86 mph/139 kph). Gelena is a Category 1 hurricane on the Saffir-Simpson hurricane scale.

Forecasters at the Joint Typhoon Warning Center expect Gelena to strengthen rapidly while moving southeast. Gelena is forecast to move away from Madagascar over the next several days, but will pass close enough to Mauritius for the island to feel the tropical cyclone’s effects.

The storm will peak at 120 knots (138 mph/222 kph) upon closest approach to Rodrigues on Saturday, Feb. 9.

Rob Gutro
NASA’s Goddard Space Flight Center

Funani (Southern Indian Ocean)

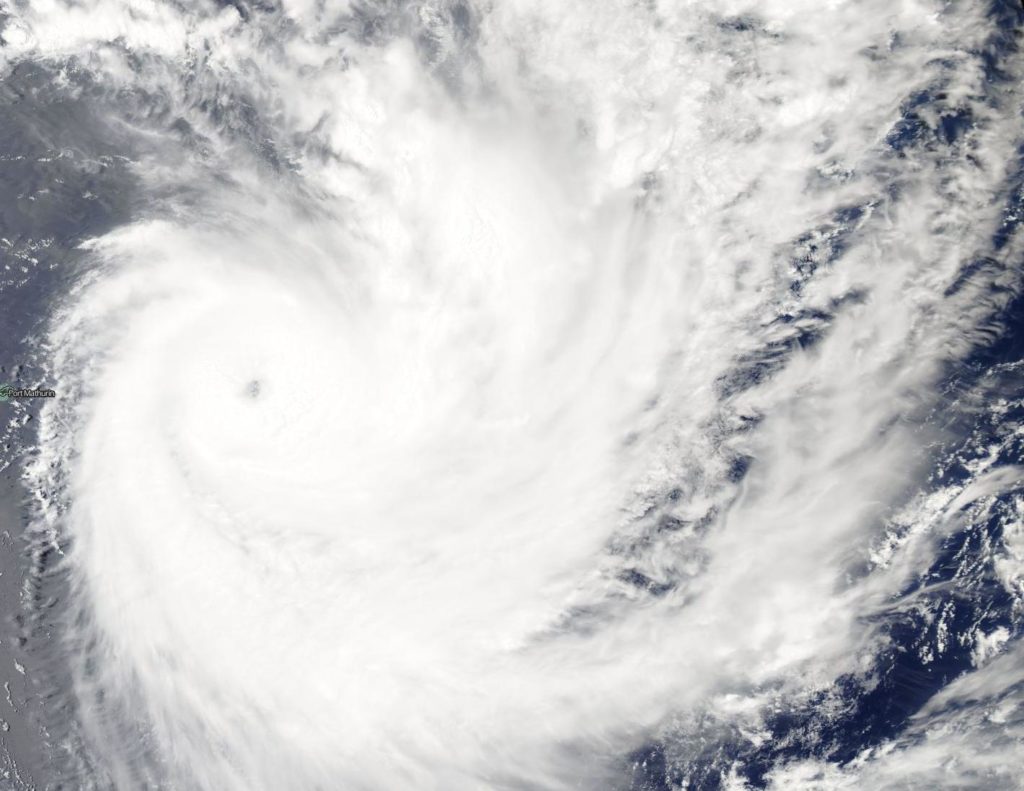
Feb. 7, 2019 – NASA Finds a Pinhole Eye in Tropical Cyclone Funani

Visible-light imagery from NASA’s Aqua satellite revealed the development of a small eye in Tropical Cyclone Funani as the storm rapidly intensified into a major hurricane in the Southern Indian Ocean.

On Feb. 7, 2019, the Moderate Resolution Imaging Spectroradiometer, or MODIS, instrument aboard NASA’s Aqua satellite captured a visible image of Tropical Cyclone Funani. The visible image revealed a pinhole eye surrounded by a thick ring of powerful thunderstorms.

satellite image of Funani
On Feb. 7, 2019, the MODIS instrument aboard NASA’s Aqua satellite provided a visible image of Tropical Cyclone Funani in the Southern Indian Ocean. The image revealed a pinhole eye surrounded by a thick ring of powerful thunderstorms. Credit: NASA Worldview, Earth Observing System Data and Information System (EOSDIS)

At 10 a.m. EDT (1500 UTC) on Feb. 7, Funani was located near 19.9 degrees south latitude and 66.7 east longitude, approximately 530 nautical miles east of Port Louis, Mauritius. Funani was moving to south-southeast. Maximum sustained winds were near 115 knots (132 mph/213 kph). Funani is now a Category 4 hurricane on the Saffir-Simpson Hurricane Wind Scale.

Forecasters at the Joint Typhoon Warning Center expect Funani to strengthen slightly more and then begin a weakening trend on its trek to the south-southeast.

Rob Gutro
NASA’s Goddard Space Flight Center

Funani (Southern Indian Ocean)

Feb. 6, 2019 – NASA Looks at Tropical Storm Funani’s Rainfall

Tropical Storm Funani (formerly classified as 12S) continued to affect Rodrigues Island in the South Pacific Ocean when the GPM satellite passed overhead and analyzed its rainfall.

On Feb. 6, a tropical cyclone warning class 2 is in force at Rodrigues, with cyclonic conditions starting to occur from late evening (local time).

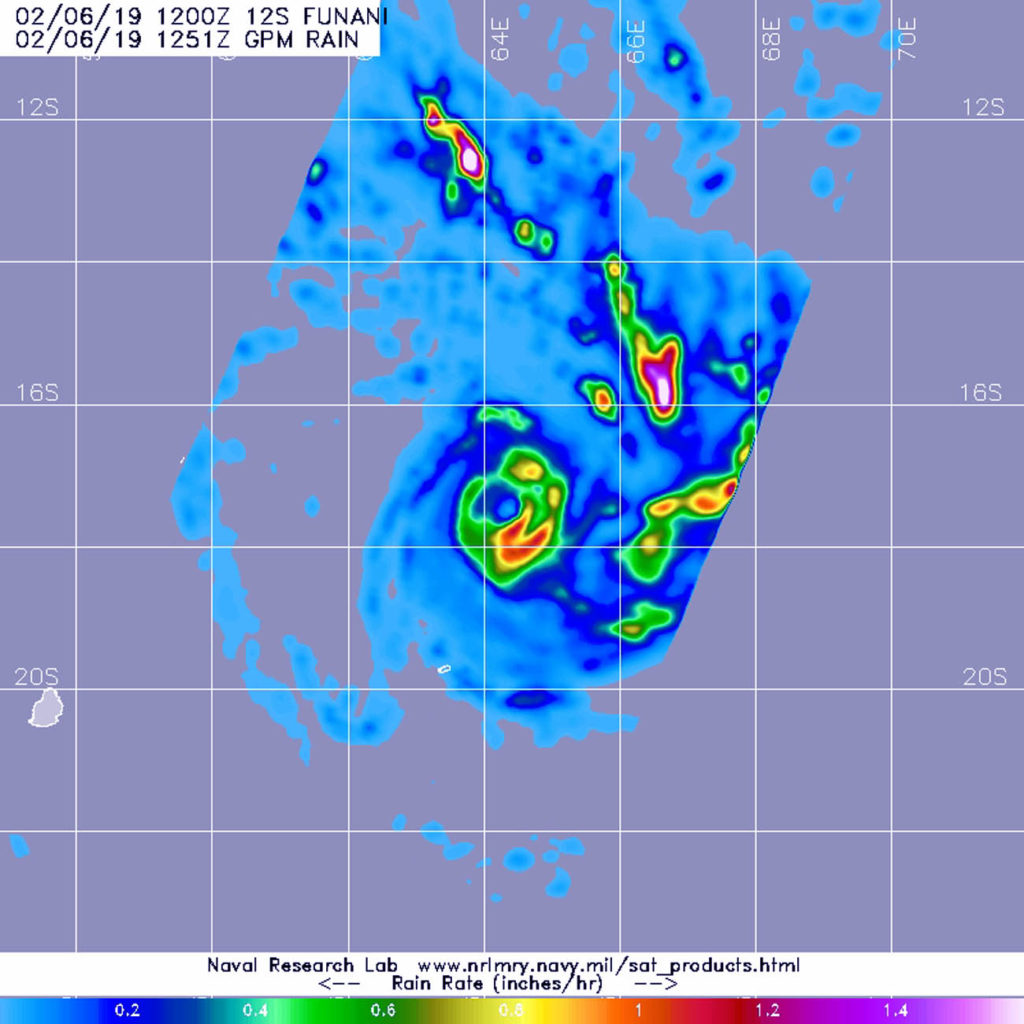
The Global Precipitation Measurement mission, or GPM, Core Satellite passed over Tropical Storm Funani at 7:51 a.m. EDT (1251 UTC). GPM found the heaviest rainfall was southwest of the center of circulation. There, rain was falling at a rate of 1.2 inches per hour. Other areas of heavy rainfall were occurring in fragmented bands of thunderstorms east of the center. GPM is a joint mission between NASA and the Japan Aerospace Exploration Agency, JAXA.

Satellite image of Funani
The GPM Core Observatory passed over Tropical Storm Funani at 7:51 a.m. EDT (1251 UTC). GPM found the heaviest rainfall was southwest of the center of circulation. There, rain was falling at a rate of 1.2 inches per hour. Credit: NASA/JAXA/NRL

At 11 a.m. EDT (1500 UTC), the center of Tropical Cyclone Funani was located near latitude 17.5 degrees south and longitude 64.4 degrees east. That’s about 432 nautical miles east-northeast of Port Louis, Mauritius. Maximum sustained winds were near 65 knots (75 mph/120 kph), making it a Category 1 hurricane on the Saffir-Simpson Hurricane Wind Scale.

The Joint Typhoon Warning Center noted Funani is rapidly strengthening as it moves southeast. The storm will intensify to 105 knots (121 mph/192 kph) within two days, before starting to weaken.

Rob Gutro
NASA’s Goddard Space Flight Center, Greenbelt, Md.