Dec. 09, 2019 – NASA Examines Tropical Cyclone Belna’s Water Vapor Concentration
When NASA’s Aqua satellite passed over the Southern Indian Ocean, water vapor data provided information about the intensity of Tropical Cyclone Belna.
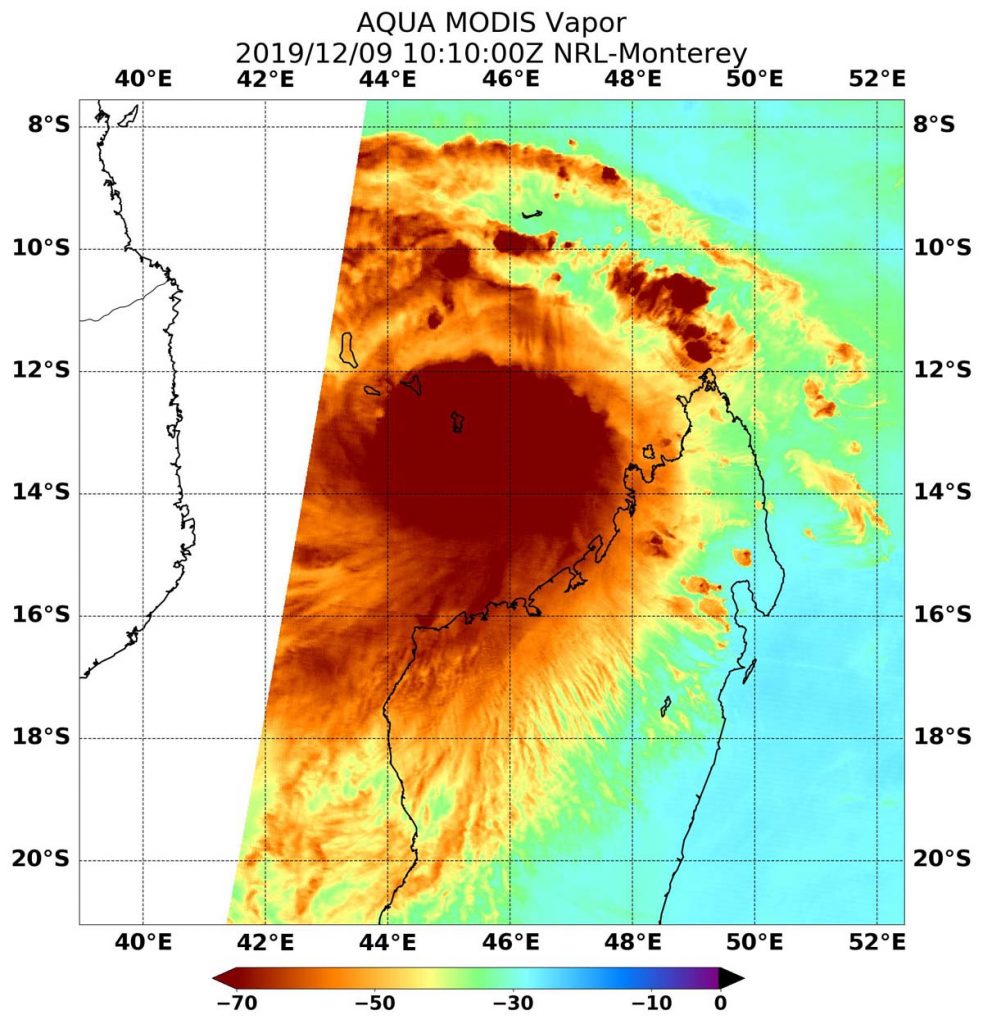
NASA’s Aqua satellite passed over Tropical Cyclone Belna in the Southern Indian Ocean on Dec. 9 at 5:10 a.m. EST (1010 UTC). Aqua found the highest concentrations of water vapor (brown) and coldest cloud top temperatures were around the center. Credits: NASA/NRL
NASA’s Aqua satellite passed over Belna on Dec. 9 at 5:10 a.m. EST (1010 UTC) and the Moderate Resolution Imaging Spectroradiometer or MODIS instrument gathered water vapor content and temperature information. The MODIS image showed highest concentrations of water vapor and coldest cloud top temperatures were encircling the center. MODIS data also showed coldest cloud top temperatures were as cold as or colder than minus 70 degrees Fahrenheit (minus 56.6 degrees Celsius) in those storms. Storms with cloud top temperatures that cold have the capability to produce heavy rainfall.
Water vapor analysis of tropical cyclones tells forecasters how much potential a storm has to develop. Water vapor releases latent heat as it condenses into liquid. That liquid becomes clouds and thunderstorms that make up a tropical cyclone. Temperature is important when trying to understand how strong storms can be. The higher the cloud tops, the colder and stronger they are.
At 5 a.m. EDT (0900 UTC), Belna was located near latitude 14.6 degrees south and longitude 45.6 degrees east, about 550 nautical miles northeast of Europa Island. Belna is moving south-southwest toward northwestern Madagascar. Maximum sustained winds are near 80 knots (92 mph/148 kph).
Forecasters at the Joint Typhoon Warning Center expect Belna will move south-southwest and continue weakening before making landfall in northwestern Madagascar near Soalala by Dec. 9 at 1800 UTC (1 p.m. EST) with maximum sustained winds expected near 75 knots (86 mph/139 kph).
NASA’s Aqua satellite is one in a fleet of NASA satellites that provide data for hurricane research.
Tropical cyclones and hurricanes are the most powerful weather events on Earth. NASA’s expertise in space and scientific exploration contributes to essential services provided to the American people by other federal agencies, such as hurricane weather forecasting.
Dec. 06, 2019 – NASA Finds Tropical Cyclone Ambali Now Past its Peak
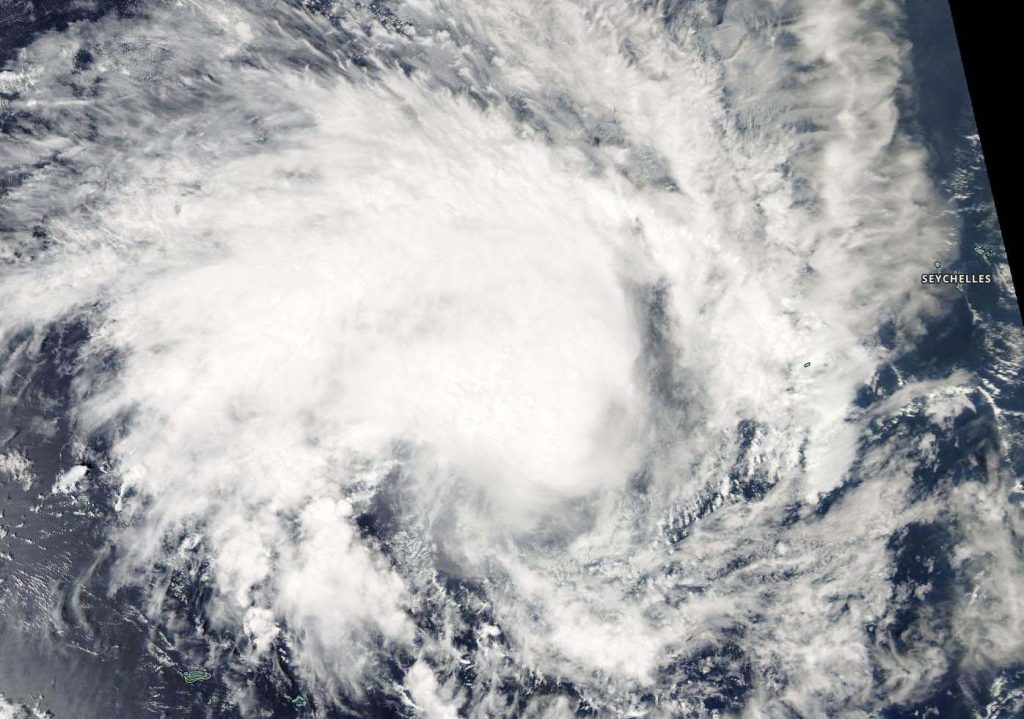
Tropical Cyclone Ambali reached its peak early on Dec. 6 and has been quickly weakening. NASA’s Aqua satellite captured a visible image of the Southern Indian Ocean storm after it weakened from its powerful peak intensity.
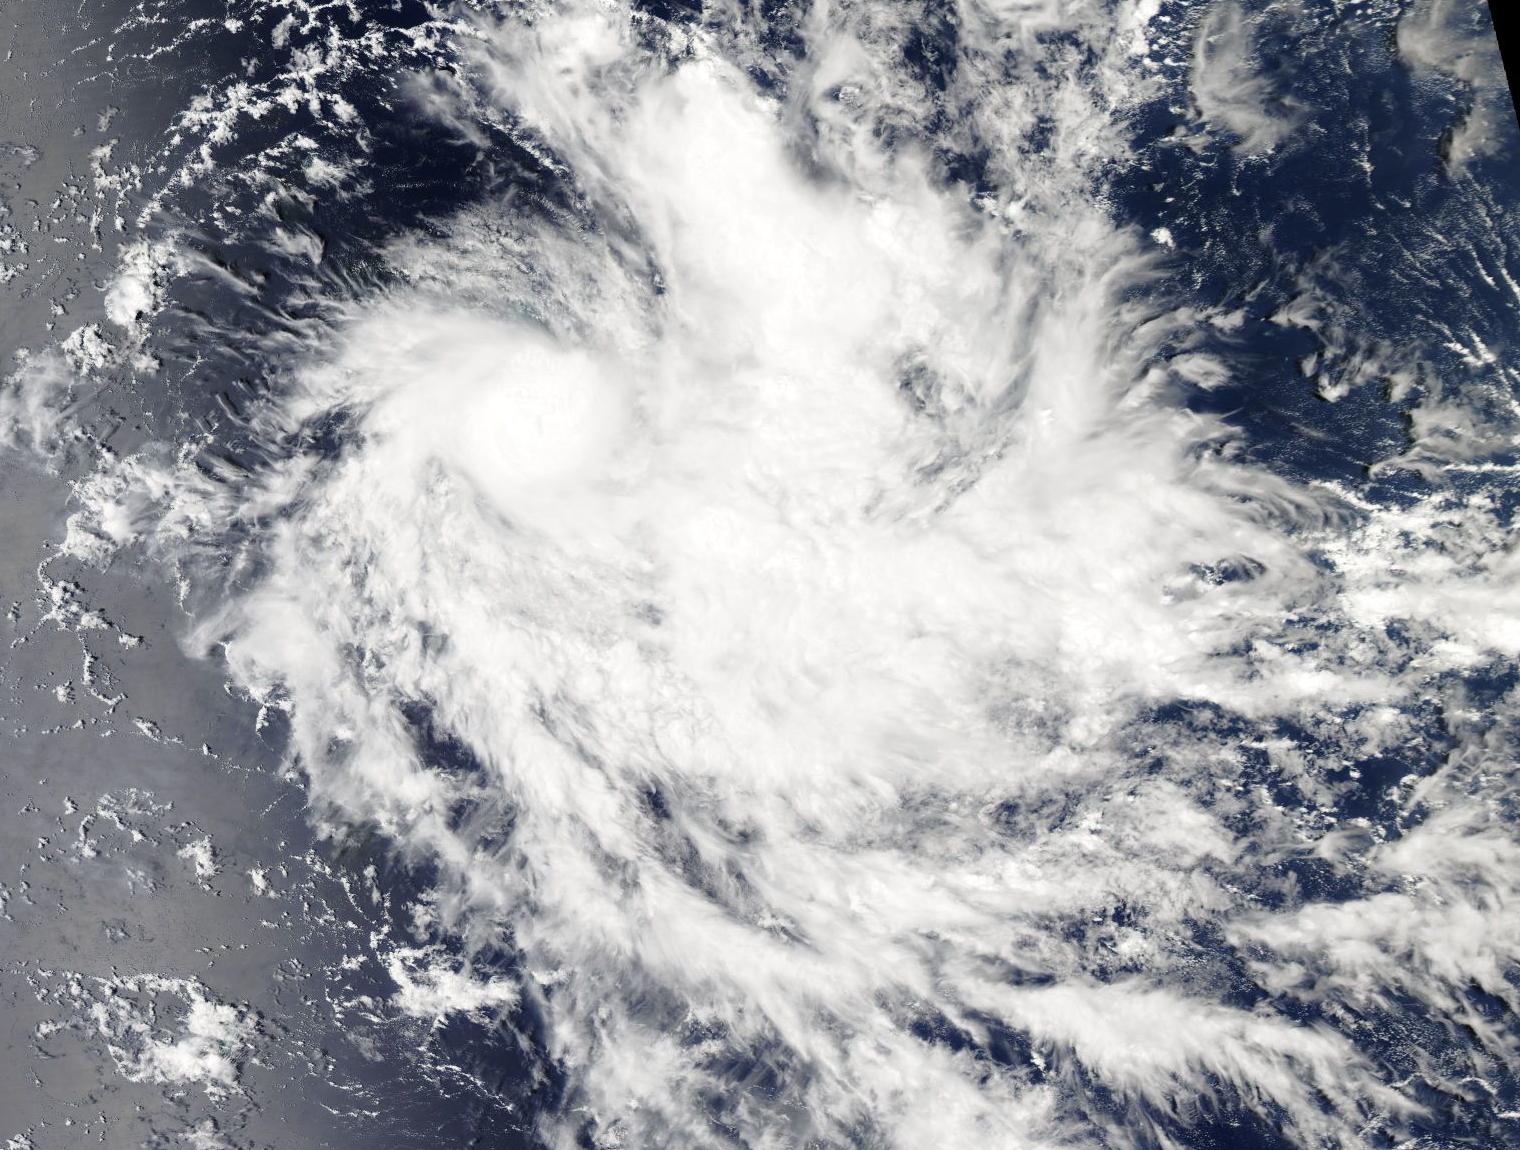
On Dec. 6, 2019, the MODIS instrument that flies aboard NASA’s Aqua satellite provided a visible image of Tropical Cyclone Ambali as it started weakening in the Southern Indian Ocean. Credit: NASA Worldview
At 4 a.m. EST (0900 UTC) on Dec. 6 Ambali was a Category 4 hurricane equivalent on the Saffir-Simpson wind scale with maximum sustained winds near 135 knots (155 mph/250 kph). By 10 a.m. EST (1500 UTC) on Dec. 6, those winds had dropped by 45 knots (52 mph/83 kph).
It was after that drop in sustained wind speed on Dec. 6, 2019, the Moderate Imaging Spectroradiometer or MODIS instrument that flies aboard NASA’s Aqua satellite provided a visible image of Ambali. The eye of the storm was difficult to pinpoint in the MODIS image, which indicated a rapid weakening from its previous status. Animated enhanced infrared satellite imagery shows a rapidly decaying system with cycling convection wrapping into an embedded low-level circulation center.
At 10 a.m. EST (1500 UTC) on Dec. 6, the Joint Typhoon Warning Center or JTWC noted that Tropical Cyclone Ambali was located near 11.7 degrees south latitude and 62.1 degrees east longitude. That is about 583 nautical miles north-northeast of Port Louis, Mauritius. Maximum sustained winds 90 knots (104 mph/167 kph). The storm is on weakening trend now that will lead to its demise by Dec. 10.
Forecasters at the JTWC Ambali will move south-southwest and appears to have reached peak intensity. The storm is expected to dissipate after three days.
NASA’s Aqua satellite is one in a fleet of NASA satellites that provide data for hurricane research.
Tropical cyclones are the most powerful weather event on Earth. NASA’s expertise in space and scientific exploration contributes to essential services provided to the American people by other federal agencies, such as hurricane weather forecasting.
Dec. 06, 2019 – NASA Finds Tropical Cyclone Pawan at the Horn of Africa
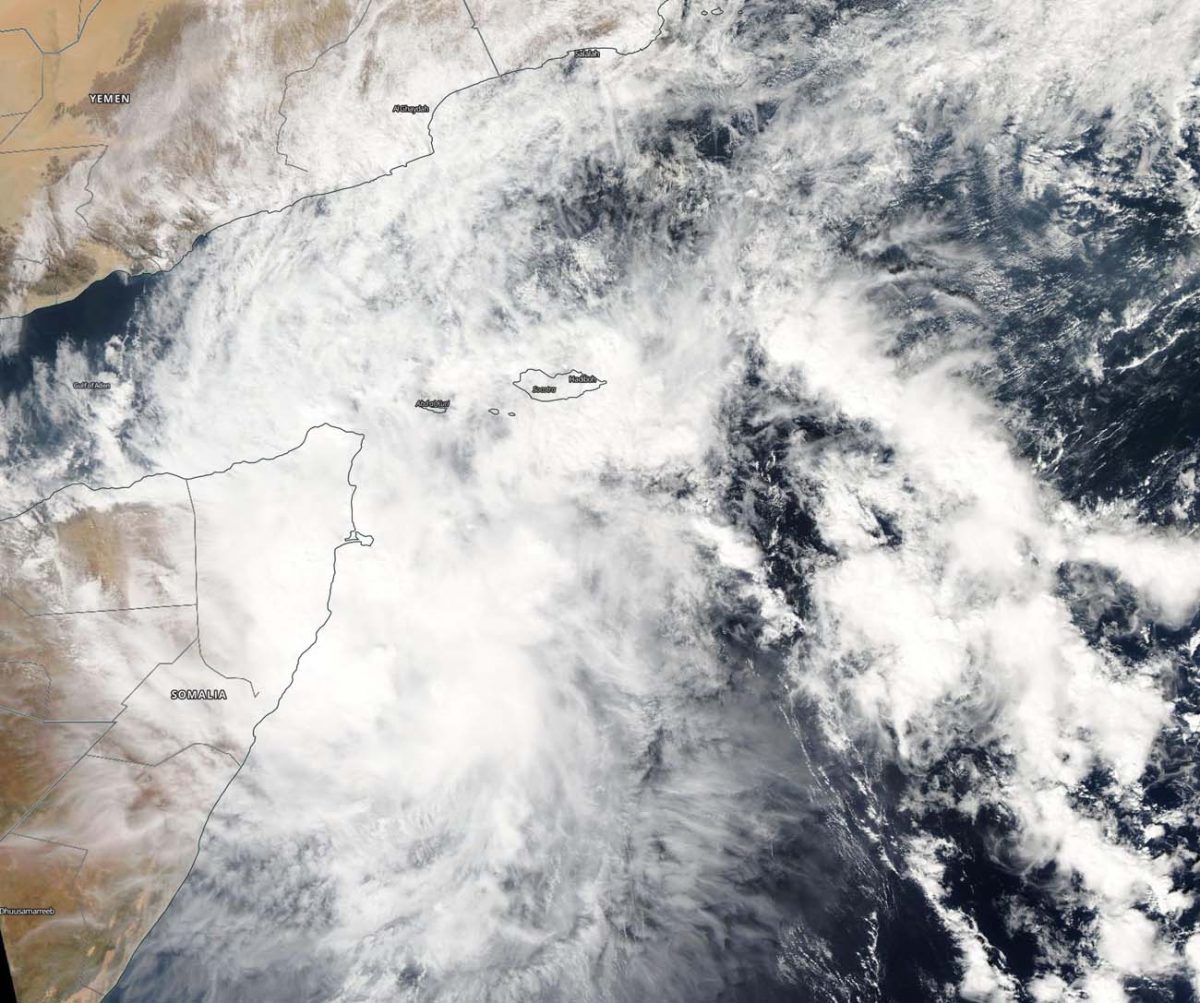
NASA’s Aqua satellite captured an image of Tropical Cyclone 06A, known as Pawan near the Horn of Africa. Pawan is forecast to make landfall in Somalia in the next day.
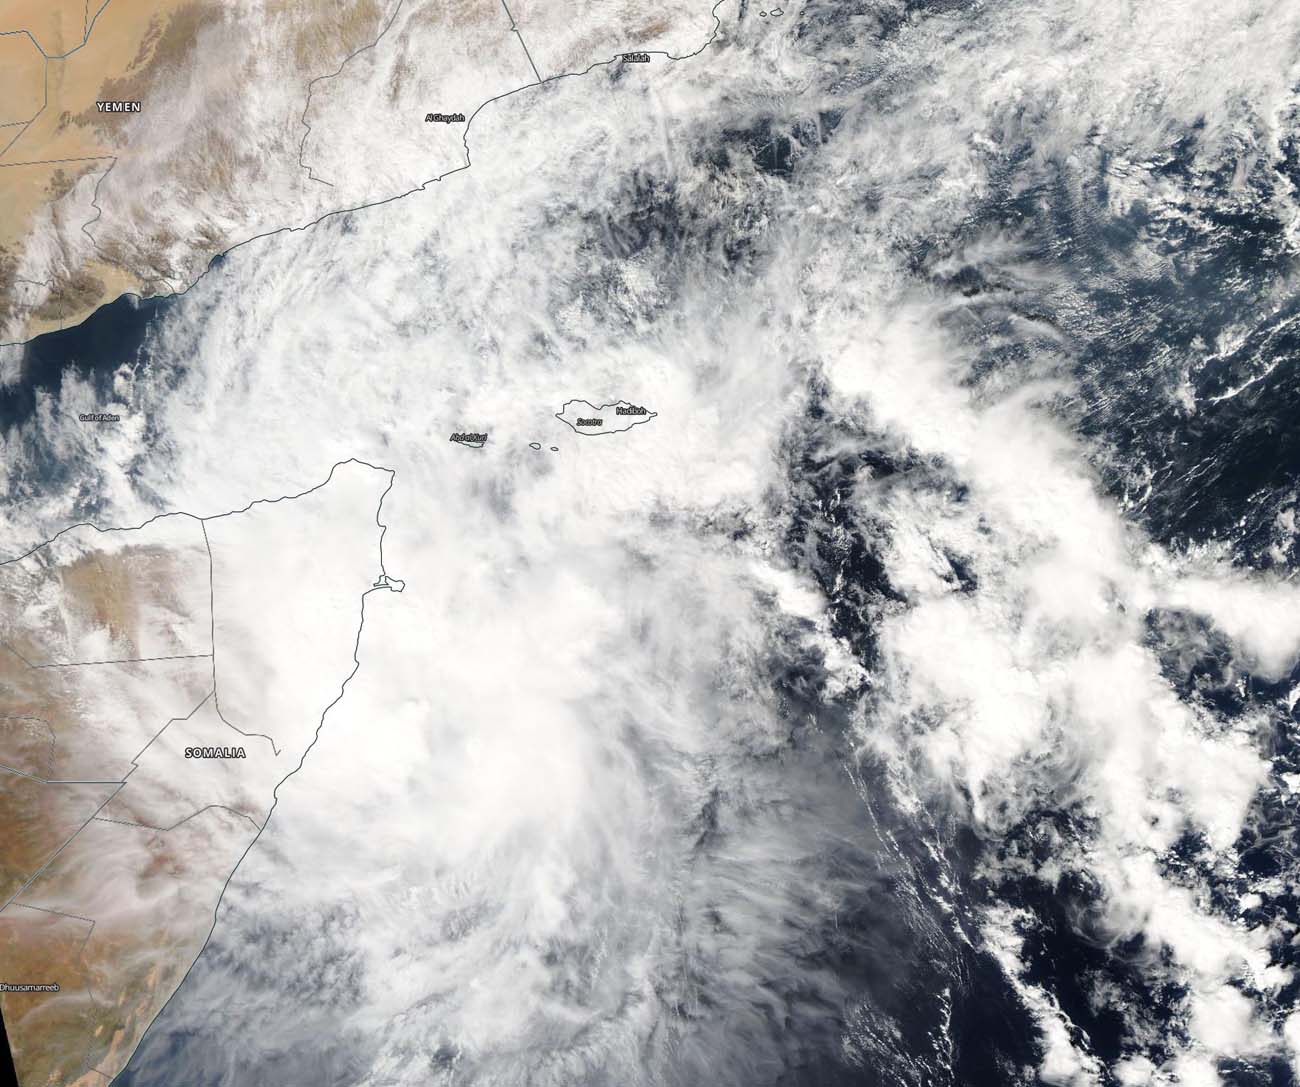
On Dec. 6, 2019, the MODIS instrument that flies aboard NASA’s Aqua satellite provided a visible image of Tropical Cyclone Pawan near the Horn of Africa. Credit: NASA Worldview
The Horn of Africa is located in eastern Africa and resembles a horn that extends into the western Arabian Sea, Northern Indian Ocean. The region includes the countries of Djibouti, Eritrea, Ethiopia, and Somalia.
On Dec. 6, 2019, the Moderate Imaging Spectroradiometer or MODIS instrument that flies aboard NASA’s Aqua satellite provided a visible image of Pawan that showed the western quadrant of the storm over northern Somalia at the tip of the Horn of Africa. Pawan no longer appears circular in nature, and that is an indication that the storm has weakened. A rounded shape of a tropical cyclone indicates a more organized storm.
At 4 a.m. EST (0900 UTC) on Dec. 6, the Joint Typhoon Warning Center noted that Tropical Cyclone Pawan was located near 7.9 degrees north latitude and 53.0 degrees east longitude. That is about 550 nautical miles south of Salalah, Oman. Maximum sustained winds 35 knots (40 mph/65 kph) and weakening. Pawan is moving to the west-southwest and expected to make landfall into Somalia within 24 hours.
NASA’s Aqua satellite is one in a fleet of NASA satellites that provide data for hurricane research.
Tropical cyclones are the most powerful weather event on Earth. NASA’s expertise in space and scientific exploration contributes to essential services provided to the American people by other federal agencies, such as hurricane weather forecasting.
Dec. 06, 2019 – NASA Finds Strengthening Tropical Cyclone Belna North of Madagascar
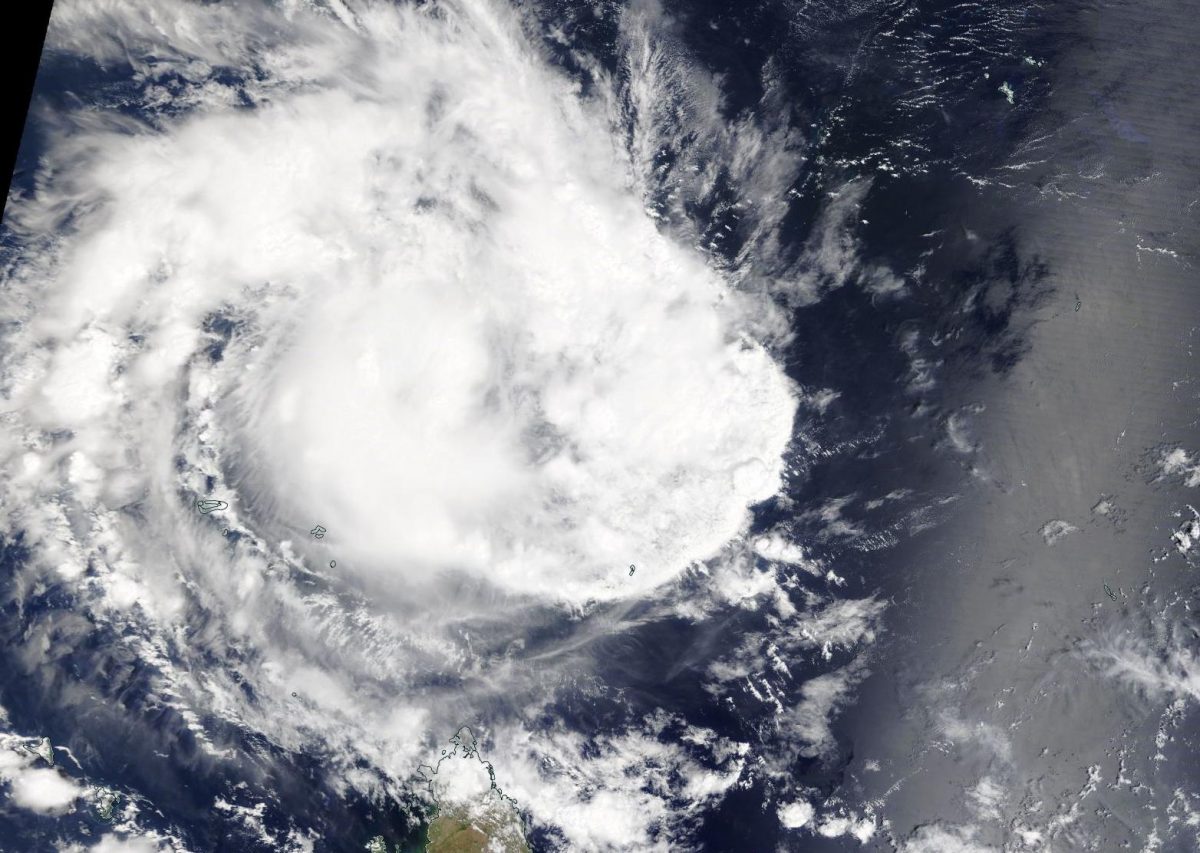
NASA’s Aqua satellite captured a visible image of Tropical Cyclone Belna, located north of Madagascar in the Southern Indian Ocean. Imagery shows that the storm to be strengthening.
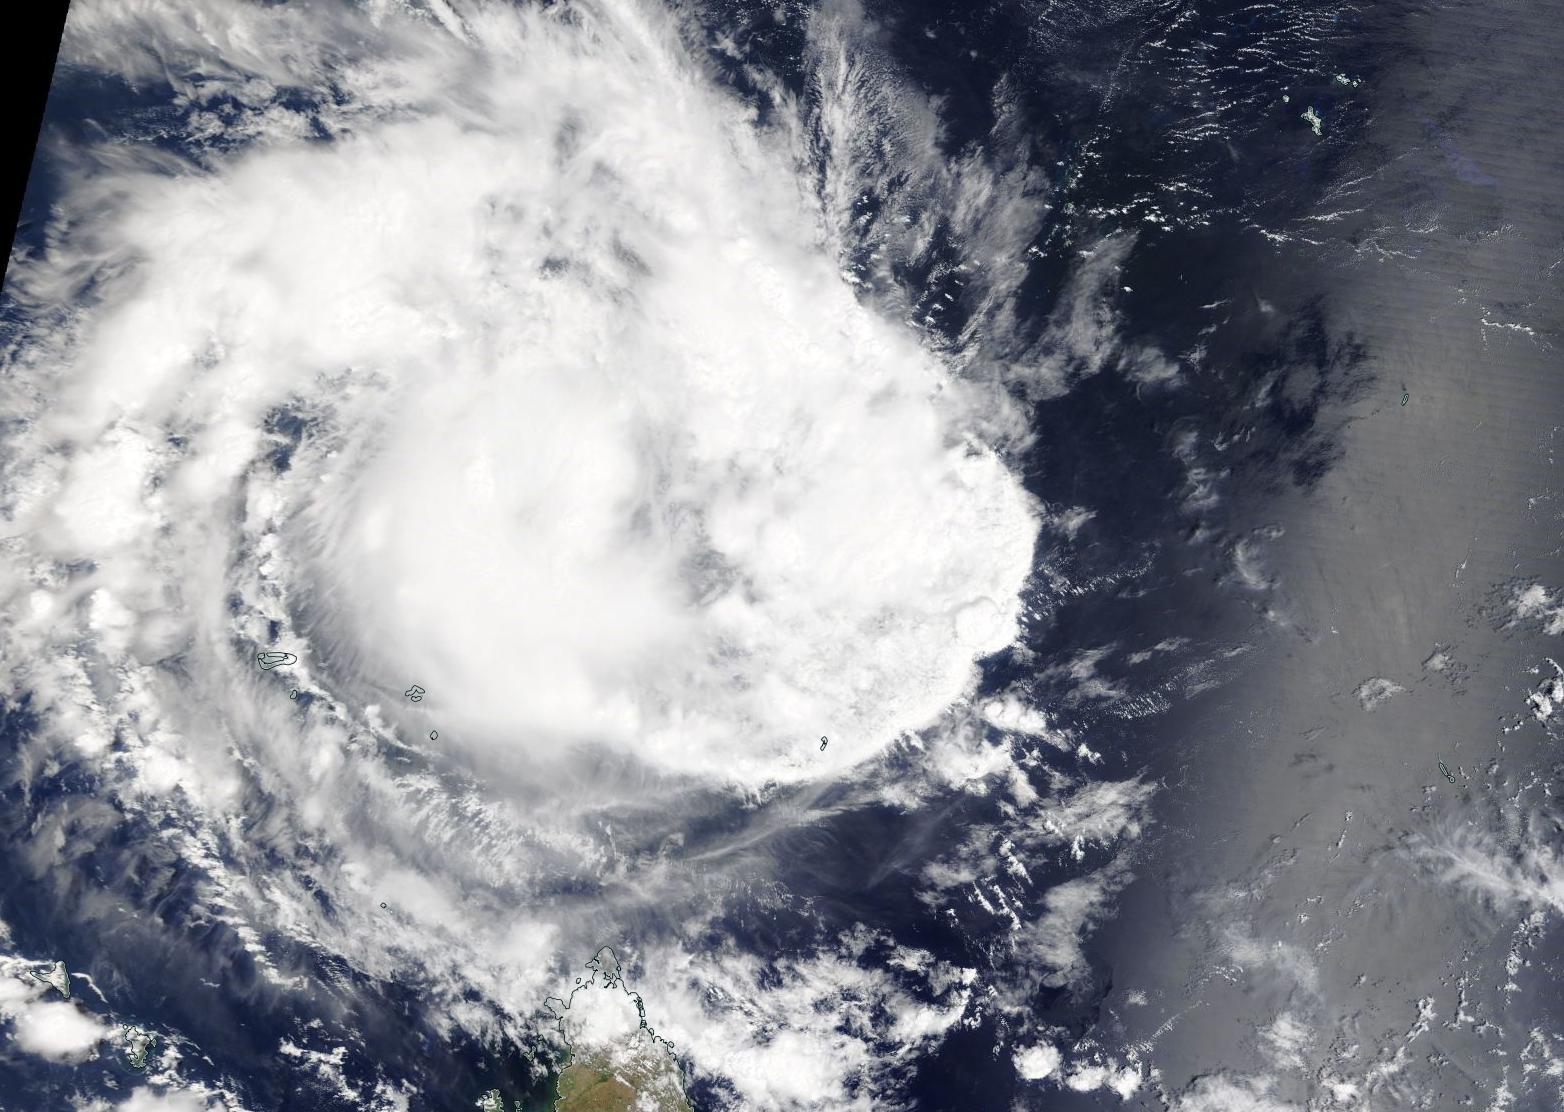
On Dec. 6, 2019, the MODIS instrument that flies aboard NASA’s Aqua satellite provided a visible image of Tropical Cyclone Belna, north of Madagascar in the Southern Indian Ocean. Credit: NASA Worldview
On Dec. 6, 2019, the Moderate Imaging Spectroradiometer or MODIS instrument that flies aboard NASA’s Aqua satellite provided a visible image of Belna, formerly known as 02S. The image showed bands of thunderstorms wrapping into the low-level center from the west. Animated multispectral satellite imagery shows deep, rapidly cycling convection wrapping into a well-defined low-level circulation center.
At 10 a.m. EST (1500 UTC) on Dec. 6, the Joint Typhoon Warning Center or JTWC noted that Tropical Cyclone Belna was located near 7.9 degrees south latitude and 48.7 degrees east longitude. That is about 863 nautical miles west-southwest of St. Denis, La Reunion Island. Belna is moving to the southwest. Maximum sustained winds 55 knots (63 mph/102 kph).
Forecasters at the JTWC said that Belna is expected to turn to the south-southwest. The storm is forecast to intensify to 90 knots (104 mph/167 kph) before making landfall in northwestern Madagascar after four days.
NASA’s Aqua satellite is one in a fleet of NASA satellites that provide data for hurricane research.
Tropical cyclones are the most powerful weather event on Earth. NASA’s expertise in space and scientific exploration contributes to essential services provided to the American people by other federal agencies, such as hurricane weather forecasting.
NASA’s Terra satellite captured an image of Tropical Cyclone Ambali and the visible image showed that the storm was rapidly intensifying.
On Dec. 5 2019, the MODIS instrument that flies aboard NASA’s Terra satellite provided a visible image of Tropical cyclone Ambali in the Southern Indian Ocean and showed powerful storms around the center of circulation and a large band of thunderstorms feeding into the center from the west. Credit: NASA Worldview, Earth Observing System Data and Information System (EOSDIS)
Ambali formed as a tropical depression in the Southern Indian Ocean on Dec. 4 and quickly strengthened into a tropical storm. Today, Dec. 5, it has reached what is considered hurricane status in the Atlantic and Northeast Pacific.
On Dec. 5, the Moderate Resolution Imaging Spectroradiometer or MODIS instrument that flies aboard NASA’s Terra satellite provided a visible image of Ambali. The MODIS image showed powerful thunderstorms circling the center of circulation. Meanwhile microwave satellite imagery shows tight banding of thunderstorms around the center of circulation and the development of an eye.
The shape of the storm is a clue to forecasters that a storm is either strengthening or weakening. If a storm takes on a more rounded shape it is getting more organized and strengthening. Conversely, if it becomes less rounded or elongated, it is a sign the storm is weakening. Ambali appeared more circular than it did 24 hours before, indicating it was strengthening and consolidating.
On Dec. 5 at 10 a.m. EST (1500 UTC), Tropical Cyclone Ambali was located near latitude 9.2 degrees south and longitude 62.7 degrees east, about 595 miles west-southwest of Diego Garcia. Ambali is moving west-southwest and has maximum sustained winds 70 knots (81 mph/130 kph).
Ambali will move south-southwest as it rapidly intensifes. Ambali is expected to peak at 100 knots (115 mph/185 kph) later today before running into hostile atmospheric conditions leading to dissipation in four days.
NASA’s Terra satellite is one in a fleet of NASA satellites that provide data for hurricane research.
Tropical cyclones and hurricanes are the most powerful weather events on Earth. NASA’s expertise in space and scientific exploration contributes to essential services provided to the American people by other federal agencies, such as hurricane weather forecasting.
Dec. 05, 2019 – NASA Finds Tropical Cyclone 02S Consolidating
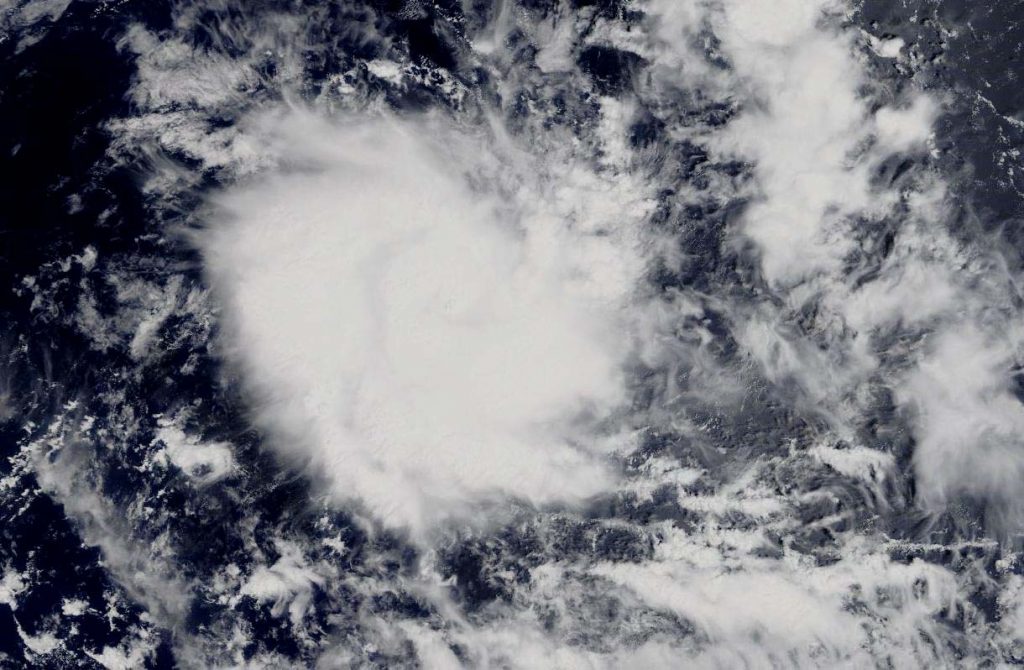
NASA’s Aqua satellite captured an image of Tropical cyclone 02S and the visible image showed that the storm was becoming better organized.
On Dec. 5 2019, the MODIS instrument that flies aboard NASA’s Aqua satellite provided a visible image of Tropical Cyclone 02S in the Southern Indian Ocean and showed powerful storms around the center of circulation and a large band of thunderstorms feeding into the center from the west. Credit: NASA Worldview, Earth Observing System Data and Information System (EOSDIS)
Tropical Cyclone 02A formed as a tropical depression in the Southern Indian Ocean on Dec. 4 and strengthened into a tropical storm.
On Dec. 5, the Moderate Resolution Imaging Spectroradiometer or MODIS instrument that flies aboard NASA’s Aqua satellite provided a visible image of 02S. The MODIS image showed powerful thunderstorms circling the center of circulation and a large, thick band of thunderstorms feeding into the center from the west.
The shape of the storm is a clue to forecasters that a storm is either strengthening or weakening. If a storm takes on a more rounded shape it is getting more organized and strengthening. Conversely, if it becomes less rounded or elongated, it is a sign the storm is weakening. 02S appeared more circular than it did 24 hours before, indicating it was strengthening and consolidating.
On Dec. 5 at 4 a.m. EST (0900 UTC), Tropical Cyclone 02S was located near latitude 6.7 degrees south and longitude 50.9 degrees east, about 867 miles north-northwest of St Denis, La Reunion Island. 02S is moving west-southwest and has maximum sustained winds 40 knots (46 mph/74 kph).
Tropical Cyclone 02S is forecast to turn to the south-southwest. The storm is forecast to make landfall in northwestern Madagascar after five days.
NASA’s Aqua satellite is one in a fleet of NASA satellites that provide data for hurricane research.
Tropical cyclones and hurricanes are the most powerful weather events on Earth. NASA’s expertise in space and scientific exploration contributes to essential services provided to the American people by other federal agencies, such as hurricane weather forecasting.
Dec. 05, 2019 – NASA Tracking Tropical Storm 06A Through Arabian Sea
NASA-NOAA’s Suomi NPP satellite passed over the Arabian Sea and captured a visible image of Tropical Storm 06A, now renamed Tropical Storm Pawan.
NASA-NOAA’s Suomi NPP satellite passed over Tropical Storm Pawan or 06A on Dec. 5, 2019 as it was moving through the western Arabian Sea, spreading clouds as far northwest as Oman and Yemen on its way toward Somalia. Credit: NASA Worldview, Earth Observing System Data and Information System (EOSDIS)
Visible imagery from NASA satellites help forecasters understand if a storm is organizing or weakening. The Visible Infrared Imaging Radiometer Suite (VIIRS) instrument aboard Suomi NPP provided a visible image of 06A on Dec. 5. VIIRS showed Tropical Storm Pawan or 06A was moving through the western Arabian Sea, spreading clouds as far northwest as Oman and Yemen on its way toward Somalia. Satellite imagery has shown limited deep convection and development of strong thunderstorms over the partially exposed low-level circulation center.
On Dec. 5, at 4 a.m. EST (0900 UTC), Tropical Cyclone Pawan (06A) was located near latitude 9.5 degrees north and longitude 55.9 degrees east, about 462 miles south-southeast of Salalah, Oman. The storm was moving to the west and had maximum sustained winds 40 knots (45 mph/74 kph). The storm is expected to weaken over the next day as it approaches Somalia.
Tropical Cyclone Pawan (06A) is in the process of turning west-southwest and is expected to make landfall in Somalia by Dec. 7.
Tropical cyclones and hurricanes are the most powerful weather events on Earth. NASA’s expertise in space and scientific exploration contributes to essential services provided to the American people by other federal agencies, such as hurricane weather forecasting.
Dec. 05, 2019 – NASA Analyzes Kammuri’s Heavy Rainfall
NASA provided analyses of Typhoon Kammuri’s heavy rainfall on its track through the Northwestern Pacific Ocean using the Global Precipitation Measurement mission or GPM core satellite.
Instantaneous surface rain rates (mm/hr) associated with Typhoon Kammuri derived from the Dual-polarization Radar onboard the GPM core satellite at 18:27 UTC 29 November 2019 (3:27 am Palau Time, PWT, 30 November) when the storm was moving westward through the central Philippine Sea. GPM showed areas of moderate to heavy rain (shown in yellow, orange and red, respectively) organized into loose bands rotating around the northern and western side of the storm. Image from NASA GSFC using GPM data archived at https://pps.gsfc.nasa.gov/.
While the Atlantic hurricane season officially ended on November 30, Typhoon Kammuri (known as Tisoy in the Philippines), which recently struck the central Philippines as a powerful Category 4 typhoon, is a reminder that the Pacific typhoon season is not yet over. In fact, while typhoon season does peak from around June through November, similar to the Atlantic, typhoons can occur throughout the year in the Pacific.
History of Kammuri
Kammuri first formed into a tropical depression from an area of low pressure on the 25th of November north of Micronesia in the west central Pacific about 500 miles southeast of Guam. Kammuri intensified slowly and was still a tropical storm when the center passed about 130 miles south of Guam on the evening of Dec. 26. As the storm made its way through the eastern and central Philippine Sea over the next few days it was kept in check at times by moderate wind shear and hovered around typhoon intensity.
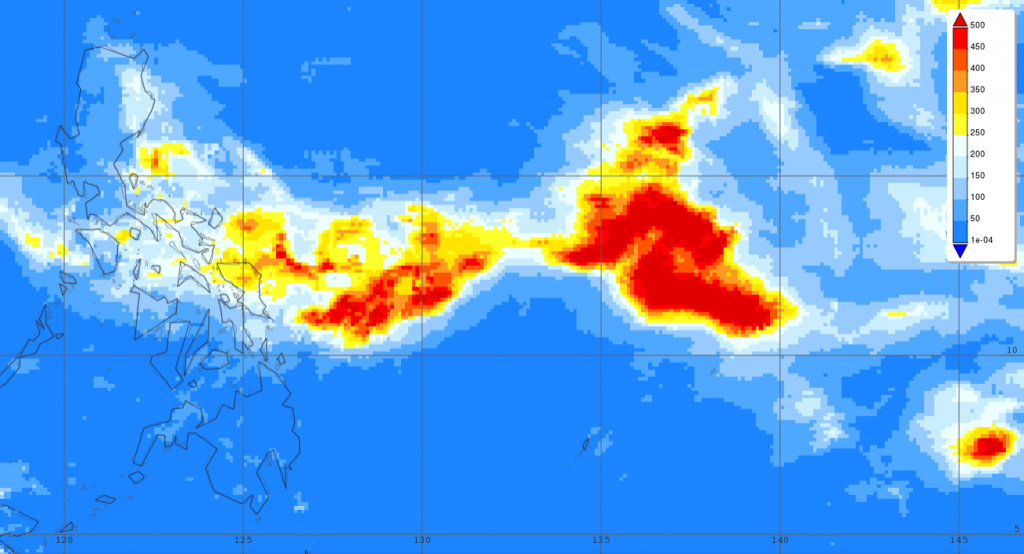
Typhoon Kammuri’s surface rainfall accumulations estimated from the NASA IMERG from Nov. 24 at 7 p.m. EST to Dec 3 at 10 p.m. EST. Heaviest rains were over the central Philippine Sea where the cyclone stalled. Those were well over 500 mm (~20 inches, in red). Most of the central Philippines, including southern Luzon, received up to 150 mm or more (over 6 inches, light blue areas) with the highest amounts over the northern half of the island of Samar where rainfall totals ranged from 250 to 350 mm (~10 to 14 inches, shown in yellow and light orange). Credit: NASA GSFC using IMERG data/with the Giovanni online data system, developed and maintained by the NASA GES DISC.
Analyzing Kammuri’s Rainfall from Space
During this period, the GPM core satellite overflew the storm. The first image was taken at on Nov. 29, 2019 at 1:27 p.m. EST (18:27 UTC/Nov. 30, 2019 at 3:27 a.m. local Palau Time, PWT) and shows surface rain rates within Kammuri from the GPM Dual-polarization Radar (DPR) when the storm was about 800 miles east of the Philippines. At the time, Kammuri was a Category 1 typhoon with sustained winds estimated at 85 mph by the Joint Typhoon Warning Center (JTWC).
GPM, a satellite managed by both NASA and the Japan Aerospace Exploration Agency, showed areas of moderate to heavy rain organized into loose bands rotating around the northern and western side of the storm. The eye, which is located along the right side of the image, was identifiable by the curvature in the inner rain bands, but the eyewall itself appeared rather weak. These features are consistent with Kammuri having a well-developed though not yet powerful circulation. That would change over the next few days as Kammuri began to approach the Philippines.
Initially, Kammuri weakened slightly after the time of the GPM overpass, but then on the evening of December 1 (local time), the storm began a rapid deepening cycle and intensified from a Category 1 typhoon with sustained winds estimated at 80 mph by JTWC at 12:00 UTC (7 a.m. EST/9:00 pm PWT) on the Dec. 1 to a Category 4 storm with sustained winds of 130 mph just 24 hours later. It was at this time that Kammuri made its first landfall in the Philippines around 11:00 p.m. local time near Gubat in the Bicol region in the Province of Sorsogon along the southeastern tip of Luzon.
As it continued on westward through the central Philippines, Kammuri weakened, crossing the island of Mindoro as a Category 2 storm before exiting the Philippines into the eastern South China Sea.
IMERG Finds Heavy Rains in the Philippines
In addition to its powerful winds, Kammuri brought heavy rains to the Philippines. IMERG, the Integrated Multi-satellitE Retrievals for GPM, is a unified satellite precipitation product produced by NASA to estimate surface precipitation over most of the globe. IMERG is managed at NASA’s Goddard Space Flight Center in Greenbelt, Md.
With IMERG, precipitation estimates from the GPM core satellite are used to calibrate precipitation estimates from microwave and infrared sensors on other satellites to produce half-hourly precipitation maps at 0.1o horizontal resolution.
IMERG surface rainfall accumulations for the period from Nov. 25 through Dec. 3 for the Philippines and the surrounding region from the time when Kammuri first became a tropical depression southeast of Guam until it had passed over Mindoro and into the South China Sea. The heaviest rains associated with Kammuri by far are off shore, especially over the central Philippine Sea where the cyclone stalled for a period producing rainfall totals well over 500 mm (~20 inches).
Over land, most of the central Philippines, including southern Luzon, received on the order of 150 mm or more (over 6 inches) with the highest amounts over the northern half of the island of Samar where rainfall totals are on the order of 250 to 350 mm (~10 to 14 inches).
So far, Kammuri is being blamed for up to 17 fatalities in the Philippines. After leaving the Philippines, Kammuri weakened significantly and is expected to weaken even further and dissipate as the cyclone is sheared apart and driven southward by the northeast monsoon.
Kammuri’s Status on Dec. 5
On Dec. 5 at 4 a.m. EST (0900 UTC), Tropical Storm Kammuri was in the South China Sea and was dealing with adverse atmospheric conditions, which were weakening the storm. It was centered near latitude 13.8 degrees north and longitude 113.7 degrees east, about 340 nautical miles east-southeast of Da Nang, Vietnam. Kammuri was moving to the southwest and had maximum sustained winds near 35 knots (40 mph/65 kph), making it a Category 1 tropical storm.
Kammuri continues to weaken and is expected to dissipate soon.
Dec. 04, 2019 – Suomi NPP Satellite Finds Kammuri Weakening in South China Sea
NASA-NOAA’s Suomi NPP satellite passed over the South China Sea and provided forecasters with a visible image of Tropical Storm Kammuri on Dec. 4.
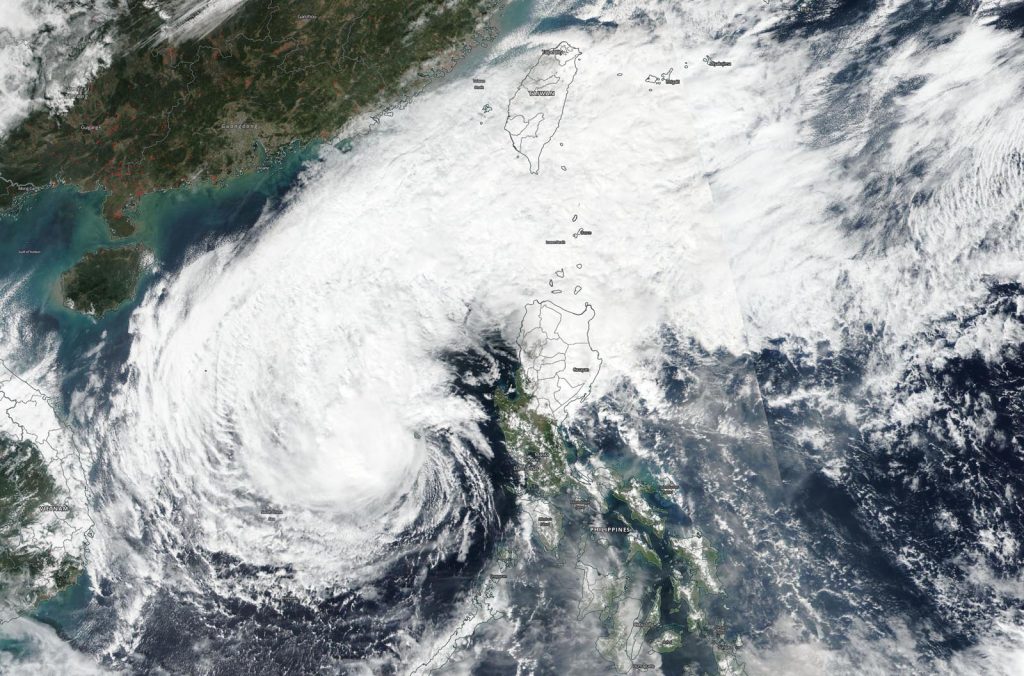
NASA-NOAA’s Suomi NPP satellite provided two visible images of Kammuri on Dec. 4 that were combined at NASA’s Goddard Space Flight Center in Greenbelt, Md. to show the entire storm. The combined VIIRS image showed that Kammuri’s center of circulation was almost in the center of the South China Sea, while a tail of clouds streamed over Luzon, the northern Philippines and north to Taiwan. Credit: NASA Worldview, Earth Observing System Data and Information System (EOSDIS)
The Visible Infrared Imaging Radiometer Suite (VIIRS) instrument aboard Suomi NPP provided two visible images of Kammuri on Dec. 4 that were combined at NASA’s Goddard Space Flight Center in Greenbelt, Md. to show the entire storm. NASA Worldview, Earth Observing System Data and Information System (EOSDIS) provided the image. The combined VIIRS image showed that Kammuri’s center of circulation was almost in the center of the South China Sea, while a tail of clouds streamed over Luzon, the northern Philippines and north to Taiwan.
Visible imagery from NASA satellites helps forecasters understand if a storm is organizing or weakening by the storm’s shape. NASA-NOAA’s Suomi NPP satellite showed that the storm appears to be elongating, indicating it is weakening.
On Dec. 4 at 10 a.m. EST (1500 UTC), Kammuri’s maximum sustained winds were near 40 knots (46 mph/74 kph) and weakening. Tropical Storm Kammuri (Philippines designation Tisoy) was centered near latitude 14.4 degrees north and longitude 115.7 degrees east. That is about 285 nautical miles west of Manila, Philippines. Kammuri has moved far enough away from the Philippines that all warnings have been dropped.
Kammuri is weakening as it moves west through the South China Sea. The Joint Typhoon Warning Center forecasts Kammuri to turn south-southwest and dissipate by December 6.
Tropical cyclones and hurricanes are the most powerful weather events on Earth. NASA’s expertise in space and scientific exploration contributes to essential services provided to the American people by other federal agencies, such as hurricane weather forecasting.
Dec. 04, 2019 – NASA Sees Tropical Storm 06A Maintaining Strength
NASA’s Aqua satellite found some powerful storms in Tropical Storm 06A as it moved through the Arabian Sea toward Somalia.
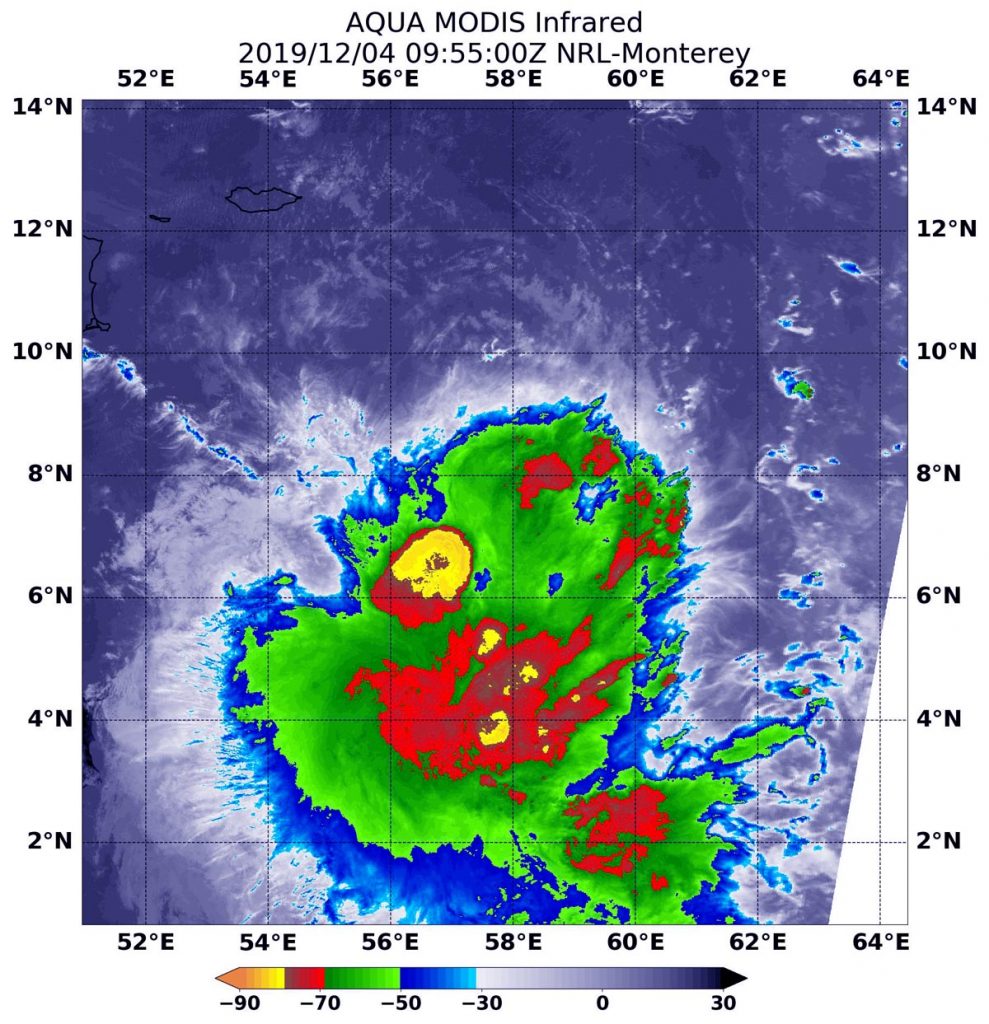
On Dec. 4 at 4:55 a.m. EST (0955 UTC), the MODIS instrument aboard NASA’s Aqua satellite gathered temperature information about Tropical Storm 06A’s cloud tops. MODIS found several small areas of powerful thunderstorms (yellow) where temperatures were as cold as or colder than minus 80 degrees Fahrenheit (minus 62.2 degrees Celsius), embedded in a much larger area of slightly warmer cloud tops (red) of minus 70 degrees Fahrenheit (minus 56.6 Celsius). Credit: NASA/NRL
NASA’s Aqua satellite used infrared light to analyze the strength of storms in 06A and found it was maintaining strength. Infrared data provides temperature information, and the strongest thunderstorms that reach high into the atmosphere have the coldest cloud top temperatures.
On Dec. 4 at 4:55 a.m. EST (0955 UTC), the Moderate Resolution Imaging Spectroradiometer or MODIS instrument aboard NASA’s Aqua satellite gathered temperature information about Tropical Storm 06A’s cloud tops. MODIS found several small areas of powerful thunderstorms where temperatures were as cold as or colder than minus 80 degrees Fahrenheit (minus 62.2 degrees Celsius), embedded in a much larger area of slightly warmer cloud tops of minus 70 degrees Fahrenheit (minus 56.6 Celsius). Cloud top temperatures that cold indicate strong storms with the potential to generate heavy rainfall.
On Dec. 4 at 10 a.m., EST (1500 UTC), Tropical Storm 06A was located near latitude 8.4 degrees north and longitude 57.0 degrees east in the Arabian Sea, Northern Indian Ocean. That is about 864 nautical miles east-southeast of Djibouti. Djibouti is a sovereign state in the Horn of Africa with a coastline on the Gulf of Aden. It is bordered by Somalia to the south, Ethiopia to the west, and Etriea to the north. 06A was moving to the northwest and had maximum sustained winds near 35 knots (40 mph/65 kph).
The Joint Typhoon Warning Center or JTWC noted, “The storm’s good outflow (air that flows outwards from a storm system) and warm sea surface temperatures are being offset by strong (20-25 knots/23-29 mph/37-46 kph) vertical wind shear to make the environment marginally supportive. Tropical Storm 06A appeared to accelerate west-northwestward over the past six hours, suggesting a subtropical ridge (an elongated area of high pressure) to the north has become the primary steering mechanism.” Over the next 24 hours, the subtropical ridge will cause 06A to turn onto a west southwestward track and remain there until making landfall and dissipating.
Tropical Storm 06A is expected to make landfall in east central Somalia late on Dec. 6.
Tropical cyclones and hurricanes are the most powerful weather events on Earth. NASA’s expertise in space and scientific exploration contributes to essential services provided to the American people by other federal agencies, such as hurricane weather forecasting.