Erick – Central Pacific Ocean

Aug. 02, 2019 – NOAA Finds Tropical Storm Erick’s Center With Help of Two NASA Satellites

Infrared imagery from NASA’s Aqua satellite revealed Tropical Storm Erick is being battered by wind shear, and that its strongest storms were south of the Big Island of Hawaii. NOAA forecasters used other NASA satellites to find Erick’s center.

Aqua image of Erick
On August 2 at 7:50 a.m. EDT (1150 UTC) the MODIS instrument that flies aboard NASA’s Aqua satellite showed strongest storms in Tropical Storm Erick were south of the Big Island of Hawaii, and west of the center, where cloud top temperatures were as cold as minus 80 degrees Fahrenheit (minus 62.2 Celsius). Credit: NASA/NRL

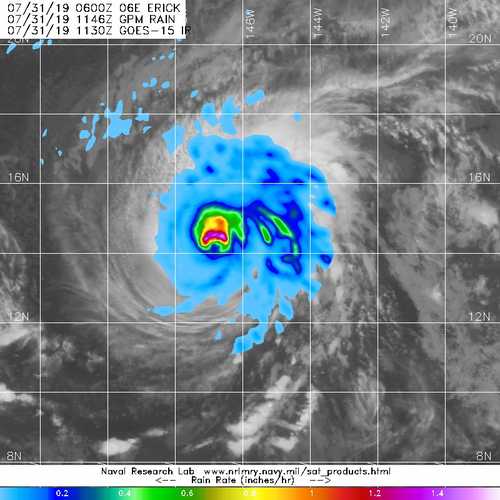
In the National Hurricane Center (NHC) Discussion of Erick on August 2 at 11 a.m. EDT (1500 UTC), Forecaster Jelsema noted that the NHC utilized data from two NASA satellites to find Erick’s center.  The Discussion noted “Although the center was difficult to locate overnight due to high level cloud cover moving over the low-level center of circulation, a timely GPM (Global Precipitation Measurement mission) pass at 7:36 a.m. EDT (1136Z) and a Visible Infrared Imaging Radiometer Suite (VIIRS) pass at 7:40 a.m. EDT (1140Z) assisted in locating the center.” VIIRS is an instrument aboard NASA-NOAA’s Suomi NPP satellite.  

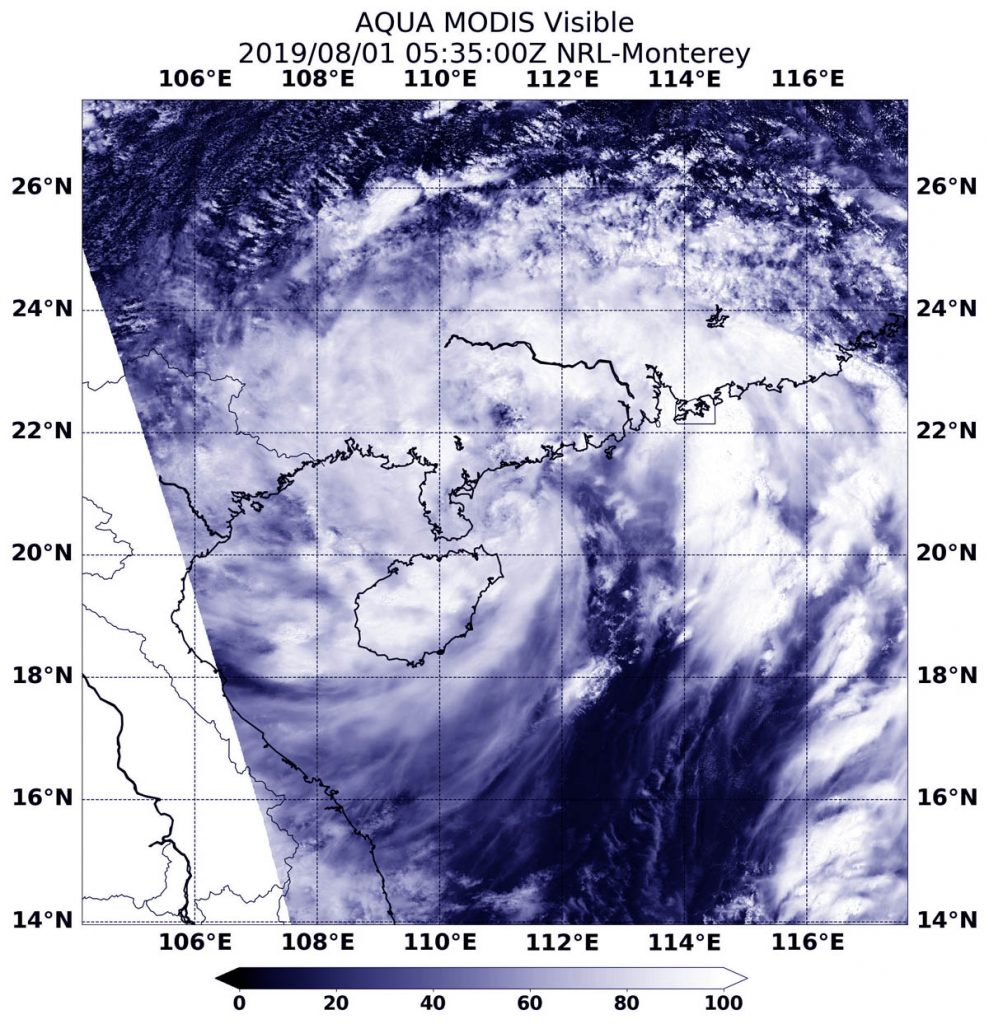
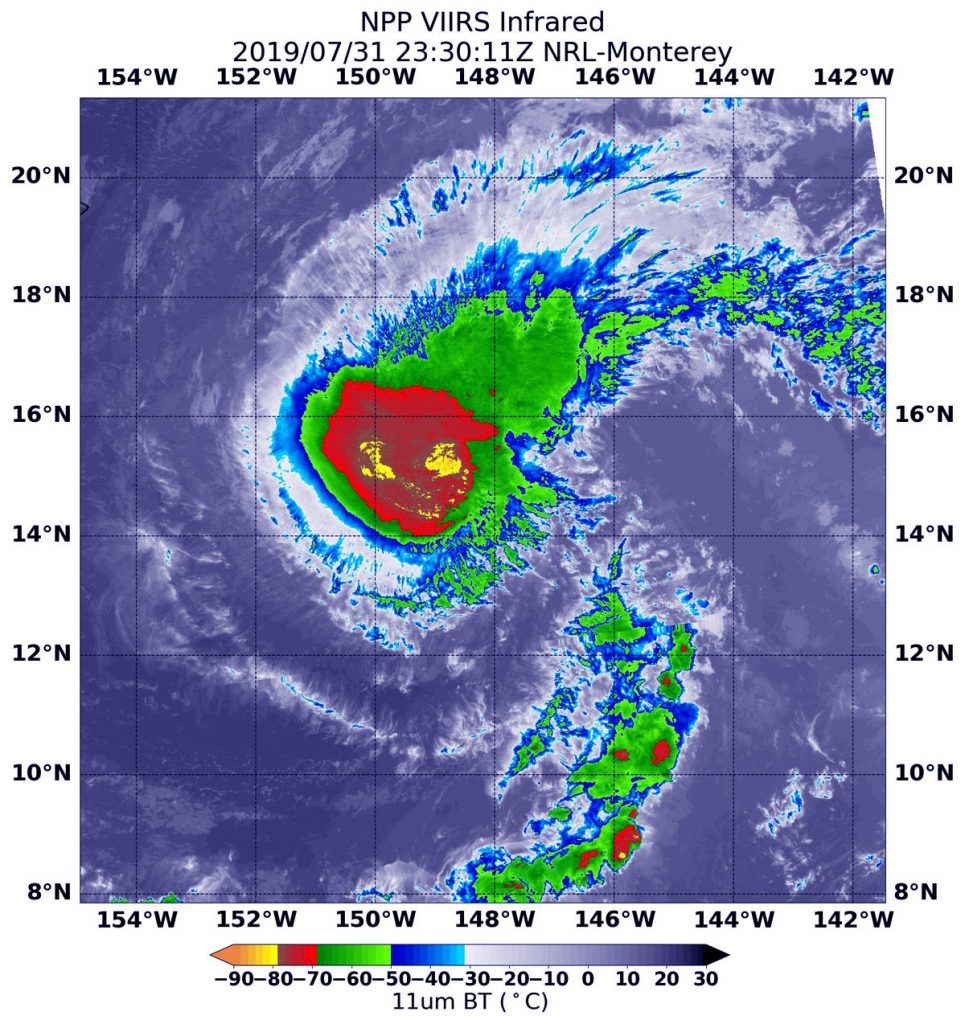
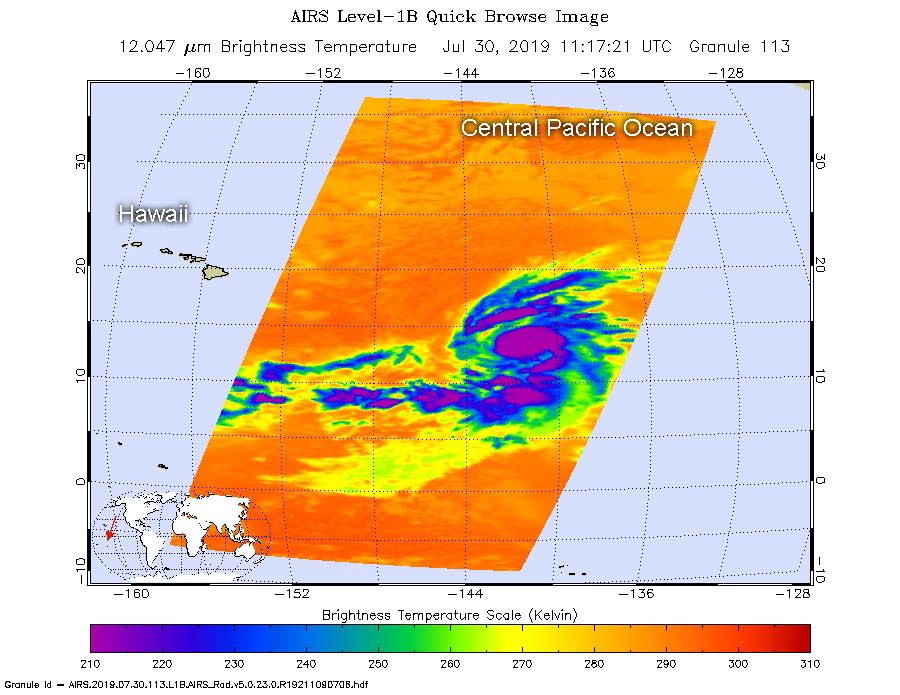
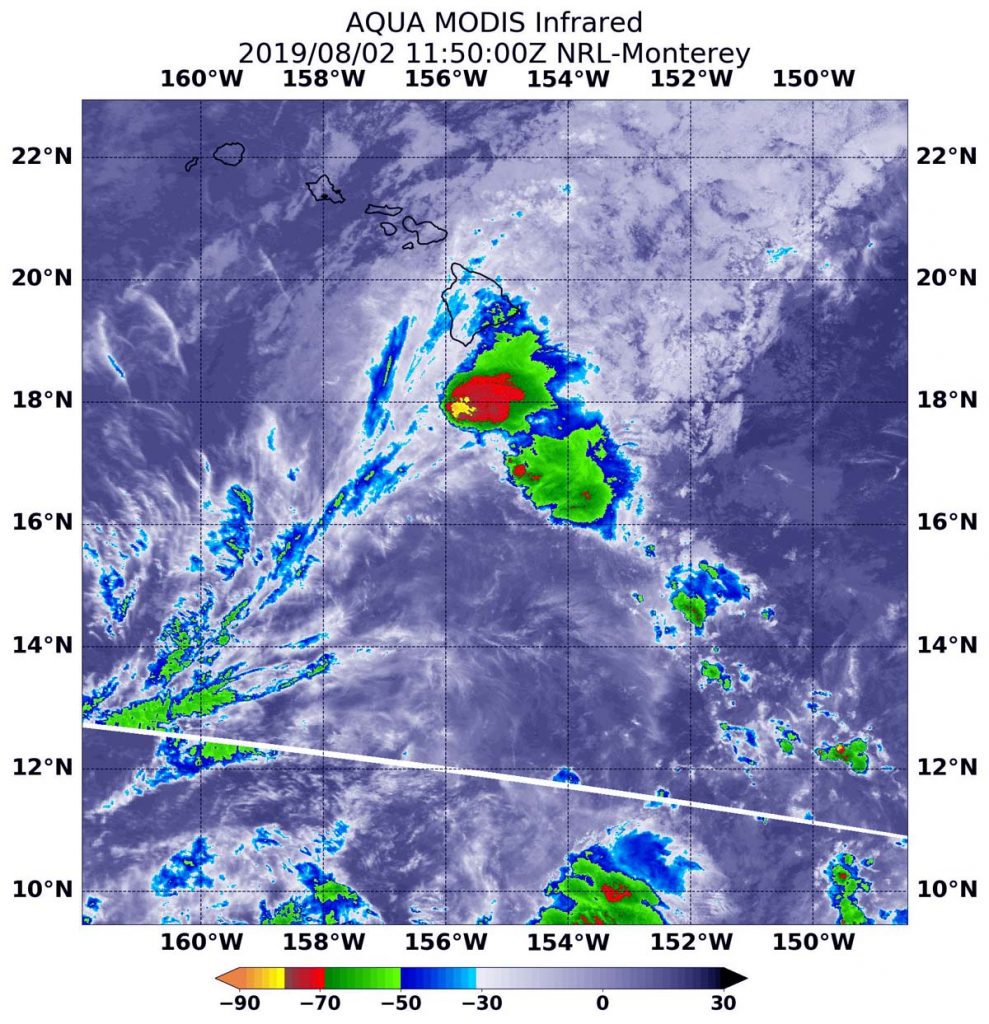
In addition, NASA’s Aqua satellite used infrared light to analyze the strength of storms and found the bulk of them in the southwestern quadrant of Erick, and south of the Big Island of Hawaii. Infrared data provides temperature information, and the strongest thunderstorms that reach high into the atmosphere have the coldest cloud top temperatures. Cloud top temperatures that cold indicate strong storms with the potential to generate heavy rainfall. Those strongest storms were south and southeast of the center of the elongated circulation.

On August 2 at 7:50 a.m. EDT (1150 UTC), the Moderate Imaging Spectroradiometer or MODIS instrument that flies aboard NASA’s Aqua satellite found those strongest storms had cloud top temperatures as cold as minus 80 degrees Fahrenheit (minus 62.2 Celsius).

NHC noted that “Deep convection has managed to develop over the low level circulation center (LLCC) of Erick this morning, after the center was exposed for much of the night. Strong west-southwesterly vertical wind shear continues to affect the tropical cyclone.”

At 11 a.m. EDT (5 a.m. HST/1500 UTC), the center of Tropical Storm Erick was located near latitude 16.8 degrees north latitude and 157.4 degrees west longitude. That’s about 250 miles (405 km) southwest of Hilo, Hawaii. Erick is moving toward the west-northwest near 14 mph (22 kph) and this general motion is expected to continue through tonight. A turn toward the northwest and a decrease in forward speed is expected over the weekend. On the forecast track, the center of Erick will pass by well to the south of the main Hawaiian Islands today and tonight. The estimated minimum central pressure is 1,000 millibars.

Maximum sustained winds are near 50 mph (85 kph) with higher gusts. Some gradual weakening is forecast during the next couple days.  Erick is expected to become a tropical depression by Sunday, and a post-tropical remnant low Sunday night.

Swells generated by Erick will continue to affect the Hawaiian Islands today, producing dangerous surf conditions, mainly along east and southeast facing shores. In addition, rain associated with Erick will continue to spread over portions of the Hawaiian Islands through early Saturday (Aug. 3), bringing the potential for localized heavy rainfall. Total rainfall amounts of 4 to 8 inches are possible, with localized higher amounts.

Erick is forecast to weaken into a tropical depression by Sunday, and become a post-tropical remnant low Sunday night. Dissipation into a trough (elongated area of low pressure) is now forecast to occur by Monday night.

For updated forecasts, visit: https://www.nhc.noaa.gov

By Rob Gutro
NASA’s Goddard Space Flight Center

Wipha – South China Sea

Aug. 01, 2019 – NASA’s Aqua Satellite Sees Tropical Storm Wipha Hugging China Coast

NASA’s Aqua satellite passed over the South China Sea and saw Tropical Storm Wipha hugging the southern coast of China.

Aqua image of Wipha
On Aug. 1, 2019, the MODIS instrument aboard NASA’s Aqua satellite provided a visible image of Tropical Storm Wipha in the South China Sea. The center of circulation was just off the coast of southern China. Credit: NASA/NRL

On August 1, 2019 at 1:35 a.m. EDT (0535 UTC), the Moderate Resolution Imaging Spectroradiometer or MODIS instrument aboard NASA’s Aqua satellite provided a visible image of Wipha that showed the center of circulation just off the coast of southern China. The center was just east of the southern tip of the Leizhou Peninsula of southern Guangdong province, and northeast of Hainan Island, China. MODIS imagery shows that despite the center in that area, the bands of thunderstorms that circle the center extend over Hainan Island and into the southern Guangdong Province as well as over the South China Sea.

At 11 a.m. EDT (1500 UTC), the center of Wipha was located near latitude 21.3 degrees north and longitude 110.2 degrees west. Wipha was about 241 nautical miles east of Hanoi, Vietnam. Wipha was moving to the northwest and had maximum sustained winds near 35 knots (40 mph/64 kph).

The Joint Typhoon Warning Center expects Wipha to skirt the southern coast of China and move through the Gulf of Tonkin, with landfall along the northeast coast of Vietnam early on August 3. It is expected to dissipate soon after landfall.

By Rob Gutro
NASA’s Goddard Space Flight Center

Erick – Central Pacific Ocean

Aug. 01, 2019 – NASA-NOAA Satellite Sees Erick Still Hanging as a Hurricane

Hurricane Erick continued hold onto its status as it moved west through the Central Pacific. NASA-NOAA’s Suomi NPP satellite passed overhead and found two small areas of very strong thunderstorms, showing Erick still had some punch left in it.

Suomi NPP image of Erick
NASA-NOAA’s Suomi NPP satellite passed over Hurricane Erick in the Central Pacific Ocean and the VIIRS instrument aboard captured this image of the storm on July 31 at 7:30 p.m. EDT (1:30 p.m. HST/2330 UTC). There were two small areas (yellow) within where cloud top temperatures were as cold as minus 80 degrees Fahrenheit (minus 62.2 Celsius). Credit: NASA/NRL

Fortunately, Erick is a small hurricane and the National Hurricane Center expects those winds to be 200 miles from Hawaii as it passes the islands.

The Visible Infrared Imaging Radiometer Suite (VIIRS) instrument aboard Suomi NPP provided an infrared image of the storm. Infrared imagery reveals cloud top temperatures, and the higher the cloud top, the colder it is, and the stronger the storm. On July 31 at 7:30 p.m. EDT (2330 UTC). There were two small areas within where cloud top temperatures were as cold as minus 80 degrees Fahrenheit (minus 62.2 Celsius). Storms with cloud tops that cold have been found to generate heavy rainfall.

At 11 a.m. EDT (5 a.m. HST/1500 UTC), the center of Hurricane Erick was located near latitude 15.9 degrees north and longitude 152.4 degrees west. That’s 315 miles (510 km) southeast of Hilo, Hawaii.

Erick is moving toward the west-northwest near 15 mph (24 kph), and this general motion is expected to continue over the next couple of days. Maximum sustained winds are near 85 mph (140 km/h) with higher gusts. Significant weakening is forecast during the next couple of days, and Erick is expected to weaken to a tropical storm later today. The estimated minimum central pressure is 981 millibars.

Erick’s hurricane-strength winds are in a small area. Hurricane-force winds extend outward up to 25 miles (35 km) from the center and tropical-storm-force winds extend outward up to 105 miles (165 km). The National Hurricane Center said that on the forecast track, the center of Erick will pass within about 200 miles south of the Big Island of Hawaii later today and tonight, August 1.

For updated forecasts, visit: www.nhc.noaa.gov

By Rob Gutro 
NASA’s Goddard Space Flight Center

Flossie – Eastern Pacific Ocean

Aug. 01, 2019 – Satellite Shows Tropical Storm Flossie Holding Up

Satellite imagery showed that Tropical Storm Flossie’s structure didn’t change much overnight from July 31 to August 1. NOAA’s GOES-West satellite provided a view of the storm early on Aug. 1.

GOES image of Flossie
NOAA’s GOES-West satellite captured a visible image of Tropical Storm Flossie on August 1 at 11:30 a.m. EDT (1530 UTC) in the Eastern Pacific Ocean. Credit: NOAA/NRL

At 11 a.m. EDT (5 a.m. HST/1500 UTC), on August 1, NOAA’s National Hurricane Center (NHC) said the center of Tropical Storm Flossie was located near latitude 15.1 degrees north and longitude 131.6 degrees west. That’s about 1,580 miles (2,540 km) east of Hilo, Hawaii. Flossie is moving toward the west-northwest near 16 mph (26 kph), and this general motion is expected to continue through early Sunday. Maximum sustained winds are near 65 mph (100 kph) with higher gusts. Little change in strength is anticipated for the next couple of days.  The estimated minimum central pressure is 996 millibars.

NOAA’s GOES-West satellite captured a visible image of Tropical Storm Flossie on August 1 at 11:30 a.m. EDT (1530 UTC) and the storm’s structure had not really changed overnight. However, recent SSMI microwave data indicate that the center of the tropical storm is displaced to the northwest of all of its strongest storms.

NOAA manages the GOES series of satellites and the NASA builds and launches the satellites for NOAA.  The NASA/NOAA GOES Project is located at NASA’s Goddard Space Flight Center in Greenbelt, Maryland.

NHC said, on the forecast track, Flossie should cross into the central Pacific basin late Friday or early Saturday. Flossie is forecast to begin slowly weakening on Saturday.

For updated forecasts, visit: www.nhc.noaa.gov

By Rob Gutro
NASA’s Goddard Space Flight Center

Flossie – Eastern Pacific Ocean

July 31, 2019 – NASA Casts a Double Eye on Hurricane Flossie

NASA’s Aqua and Terra satellites provided infrared views of Flossie before and after it became a hurricane while moving through the Eastern Pacific Ocean. Both satellites analyzed Flossie’s cloud top temperatures and structure as the storm strengthened.

AIRS image of Flossie
On July 30 at 7:17 a.m. EDT (1117 UTC) the AIRS instrument aboard NASA’s Aqua satellite analyzed Flossie’s cloud top temperatures in infrared light. AIRS found coldest cloud top temperatures (purple) of strongest thunderstorms in two areas were as cold as or colder than minus 63 degrees Fahrenheit (minus 53 degrees Celsius). Credit: NASA JPL/Heidar Thrastarson

On July 30 at 5:41 a.m. EDT (0941 UTC) infrared data and cloud top temperatures were obtained in then Tropical Storm Flossie, using the Atmospheric Infrared Sounder or AIRS instrument. AIRS found coldest cloud top temperatures as cold as or colder than minus 63 degrees Fahrenheit (minus 53 degrees Celsius) around the center of circulation and in a large area west of the center. The stronger the storms, the higher they extend into the troposphere, and they have the colder cloud temperatures.

Flossie continued to strengthen after Aqua passed overhead, and by 5 p.m. EDT (11 a.m. HST/2100 UTC) on July 30, it became a hurricane.

On July 31 at 6:35 a.m. EDT (1035 UTC),the Moderate Imaging Spectroradiometer or MODIS instrument that flies aboard NASA’s Terra satellite gathered infrared data on Flossie after it became a hurricane. Like the AIRS image the previous day, there were two areas of strongest storms. In the Terra imagery, the strongest storms were also colder and clouds tops higher in the troposphere than they were in the July 30 AIRS imagery.

Terra image of Flossie
On July 31 at 6:35 a.m. EDT (1035 UTC), the MODIS instrument that flies aboard NASA’s Terra satellite showed strongest storms in Hurricane Flossie were around the center and south of the center where cloud top temperatures were as cold as minus 80 degrees Fahrenheit (minus 62.2 Celsius). Credit: NASA/NRL

On July 31, the strongest storms were located around the center and in a band of thunderstorms southwest of the center where cloud top temperatures were as cold as minus 80 degrees Fahrenheit (minus 62.2 Celsius).  Cloud top temperatures that cold indicate strong storms with the potential to generate heavy rainfall.

At 11 a.m. EDT (5 a.m. HST/1500 UTC) the center of Hurricane Flossie was located near latitude 14.0 degrees north latitude and longitude 125.8 degrees west. Flossie is moving toward the west-northwest near 15 mph (24 kph).  A west-northwestward to westward motion at a similar forward speed is anticipated for the next several days.

Maximum sustained winds have decreased to near 75 mph (120 kph) with higher gusts.  Flossie is expected to weaken to tropical-storm strength later today.  Hurricane-force winds extend outward up to 30 miles (45 km) from the center and tropical-storm-force winds extend outward up to 105 miles (165 km).

The National Hurricane Center said that re-strengthening is possible later this week, and Flossie is forecast to become a hurricane again in a few days.

For forecast updates, visit: www.nhc.noaa.gov.

By Rob Gutro
NASA’s Goddard Space Flight Center

Erick – Eastern Pacific Ocean

July 31, 2019 – NASA Finds Heavy Rain in Hurricane Erick

NASA provided forecasters with a look at Hurricane Erick’s rainfall rates and cloud temperatures with data from the GPM and Aqua satellites, as the storm headed to Hawaii.

GPM image of Erick
The GPM core satellite passed over Hurricane Erick at 7:46 a.m. EDT (1146 UTC) on July 31. GPM found the heaviest rainfall (pink) was around the northern eyewall of the center of circulation. There, rain was falling at a rate of over 40 mm (about 1.6 inches) per hour. Credit: NASA/JAXA/NRL

Erick is a major hurricane in the Eastern Pacific Ocean and is a category 3 hurricane on the Saffir-Simpson Hurricane Wind Scale.

NASA’s Aqua satellite analyzed Erick on July 30 at 7:17 a.m. EDT (1117 UTC) using the Atmospheric Infrared Sounder or AIRS instrument. The stronger the storms, the higher they extend into the troposphere, and they have the colder cloud temperatures. AIRS found coldest cloud top temperatures as cold as or colder than minus 63 degrees Fahrenheit (minus 53 degrees Celsius) in a large area around the center.

The Global Precipitation Measurement mission or GPM core satellite passed over Hurricane Erick at 7:46 a.m. EDT (1146 UTC) on July 31. GPM found the heaviest rainfall was around the northern eyewall of the center of circulation. There, rain was falling at a rate of over 40 mm (about 1.6 inches) per hour. GPM is a joint mission between NASA and the Japan Aerospace Exploration Agency, JAXA.

AIRS image of Erick
On July 30 at 7:17 a.m. EDT (1117 UTC) the AIRS instrument aboard NASA’s Aqua satellite analyzed Erick’s cloud top temperatures in infrared light. AIRS found coldest cloud top temperatures (purple) of strongest thunderstorms were as cold as or colder than minus 63 degrees Fahrenheit (minus 53 degrees Celsius). Credit: NASA JPL/Heidar Thrastarson

The National Hurricane Center (NHC) said at 11 a.m. EDT (5 a.m. HST/1500 UTC), the center of Hurricane Erick was located near latitude 14.5 North, longitude 147.5 West. Erick is moving toward the west near 13 mph (20 kph) and this motion is expected to continue for the next 48 hours. Maximum sustained winds are near 120 mph (195 kph) with higher gusts. Some weakening is forecast during the next 48 hours. The estimated minimum central pressure is 958 millibars.

NHC noted “Swells generated by Erick will arrive in the Hawaiian Islands over the next couple of days, potentially producing dangerous surf conditions, mainly along east facing shores. Moisture associated with Erick will spread over the Hawaiian Islands by Thursday afternoon [Aug. 1] and produce heavy rainfall. Rainfall is expected to be heaviest over the east and southeast slopes of the Big Island of Hawaii.”

For forecast updates, visit: www.nhc.noaa.gov.

By Rob Gutro
NASA’s Goddard Space Flight Center

Wipha – Northwestern Pacific Ocean

July 31, 2019 – NASA Finds Tropical Storm Wipha Whipped Up

Tropical Storm Wipha formed quickly in the South China Sea. It was affecting Hainan Island, China when NASA’s Aqua satellite passed overhead on July 31.

Aqua image of Wipha
On July 31 at 2:30 a.m. EDT (0630 UTC) the MODIS instrument that flies aboard NASA’s Aqua satellite showed strongest storms in Tropical Storm Wipha were southeast of Hainan Island, China, in the South China Sea. Cloud top temperatures were as cold as minus 80 degrees Fahrenheit (minus 62.2 Celsius). Credit: NASA/NRL

NASA’s Aqua satellite used infrared light to analyze the strength of storms and found the bulk of them in the southern quadrant. Infrared data provides temperature information, and the strongest thunderstorms that reach high into the atmosphere have the coldest cloud top temperatures.

ON July 31 at 2:30 a.m. EDT (0630 UTC), the Moderate Imaging Spectroradiometer or MODIS instrument that flies aboard NASA’s Aqua satellite gathered infrared data on Tropical Storm Wipha. Strong thunderstorms circled the center where cloud top temperatures were as cold as minus 80 degrees Fahrenheit (minus 62.2 Celsius). Those storms were over the South China Sea, just southeast of Hainan Island, China. Another area of storms that strong were in a fragmented band to the northeast of the center.

Cloud top temperatures that cold indicate strong storms with the potential to generate heavy rainfall. Those strongest storms were south and southeast of the center of the elongated circulation.

At 11 a.m. EDT (1500 UTC) on July 31, Tropical Storm Wipha had maximum sustained winds near 35 knots (40 mph/64 kph). It was located near 19.4 degrees north latitude and 112.2 degrees west longitude, about 207 miles south-southwest of Hong Kong, China. Wipha was moving to the northwest.

The Joint Typhoon Warning Center expects that Wipha will move northwest towards southern China. After passing the Leizhou Peninsula, the system will turn west and after crossing the Gulf of Tonkin will make landfall near Hanoi, Vietnam.

By Rob Gutro
NASA’s Goddard Space Flight Center

Erick – Eastern Pacific Ocean

July 30, 2019 – NASA Analyzes First Central Pacific Ocean Hurricane’s Water Vapor

Hurricane Erick has become the first tropical cyclone to enter the Central Pacific Ocean during the 2019 Hurricane Season and Hawaii is keeping an eye on the storm. NASA’s Aqua satellite is also keeping eyes on Erick, too, and analyzed the water vapor content within the storm.

Aqua image of Erick
NASA’s Aqua satellite passed over Hurricane Erick on July 30 at 7:20 a.m. EDT (1120 UTC) after it entered the Central Pacific Ocean. Aqua found highest concentrations of water vapor (dark brown) and coldest cloud top temperatures were around the eye. Credits: NASA/NRL

NASA’s Aqua satellite passed Hurricane Erick on July 30 at 7:20 a.m. EDT (1120 UTC) and the Moderate Resolution Imaging Spectroradiometer or MODIS instrument gathered water vapor content and temperature information. The MODIS image showed highest concentrations of water vapor and coldest cloud top temperatures were in a thick ring of storms around the newly developed eye and in a fragmented band of thunderstorms north-northwest of Erick’s center.

MODIS data also showed coldest cloud top temperatures were as cold as or colder than minus 70 degrees Fahrenheit (minus 56.6 degrees Celsius) in those storms. Storms with cloud top temperatures that cold have the capability to produce heavy rainfall. The circular eye was indicated by warmer temperatures near minus 30 degrees Fahrenheit (minus 34.4 degrees Celsius). Those warmer temperatures, although still very cold, mean that there are high clouds covering the eye. High cirrus clouds covering the eye mean that it would not yet be seen on visible satellite imagery.

Water vapor analysis of tropical cyclones tells forecasters how much potential a storm has to develop. Water vapor releases latent heat as it condenses into liquid. That liquid becomes clouds and thunderstorms that make up a tropical cyclone. Temperature is important when trying to understand how strong storms can be. The higher the cloud tops, the colder and the stronger they are.

On Tuesday, July 30, 2019 at 5 a.m. EDT (0900 UTC or 11 p.m. HST on July 29), NOAA’s National Hurricane Center (NHC) said the center of Hurricane Erick was located near latitude 13.1 degrees north and longitude 141.4 degrees west. About 1,015 miles (1,635 km) east-southeast of Hilo Hawaii. Erick is moving toward the west near 17 mph (28 kph). A west-northwest course at a slower forward speed is expected to begin on Tuesday and continue through Thursday.

Maximum sustained winds are near 80 mph (130 kph) with higher gusts. Hurricane-force winds extend outward up to 15 miles (30 km) from the center and tropical-storm-force winds extend outward up to 80 miles (130 km). The estimated minimum central pressure is 988 millibars.

NHC said additional strengthening is forecast through Wednesday. Weakening is expected starting by late Wednesday night or early Thursday morning.

For updated forecasts, visit: www.nhc.noaa.gov

By Rob Gutro
NASA’s Goddard Space Flight Center

Flossie – Eastern Pacific Ocean

July 30, 2019 – NASA Finds Flossie’s Center Just North of Coldest Cloud Tops

Cloud top temperatures provide information to forecasters about where the strongest storms are located within a tropical cyclone. NASA’s Aqua satellite took Tropical Storm Flossie’s cloud top temperatures to get that information.

AIRS image of Flossie
On July 29, at 6:35 a.m. EDT (1035 UTC) the AIRS instrument aboard NASA’s Aqua satellite analyzed cloud top temperatures of Tropical Storm Flossie in infrared light. AIRS found coldest cloud top temperatures (purple) of strongest thunderstorms were as cold as or colder than minus 63 degrees Fahrenheit (minus 53 degrees Celsius). Credit: NASA JPL/Heidar Thrastarson

NASA’s Aqua satellite analyzed the storm on July 29, at 6:35 a.m. EDT (1035 UTC) using the Atmospheric Infrared Sounder or AIRS instrument. The stronger the storms, the higher they extend into the troposphere, and they have the colder cloud temperatures.

AIRS found coldest cloud top temperatures as cold as or colder than minus 63 degrees Fahrenheit (minus 53 degrees Celsius) south of the center. At 11 a.m. EDT, the National Hurricane Center analyzed infrared data and said, “Flossie’s low-level center has migrated southward toward the strongest convection and is positioned just north of the coldest cloud tops.”

Cloud top temperatures that cold indicate strong storms that have the capability to create heavy rain.

At 5 a.m. EDT (0900 UTC) on Tuesday, July 30, 2019, the center of Tropical Storm Flossie was located near latitude 12.2 degrees north and longitude 119.3 degrees west. That puts the center of Flossie about 965 miles (1,550 km) southwest of the southern tip of Baja California, Mexico. Flossie is moving toward the west near 16 mph (26 kph) and a turn to the west-northwest is expected later today. Maximum sustained winds are near 65 mph (100 kph) with higher gusts. The estimated minimum central pressure is 1001 millibars (29.56 inches).

Flossie is expected to strengthen to a hurricane later today, and then is forecast to become a major hurricane Wednesday night.

For updated forecasts, visit: www.nhc.noaa.gov

By Rob Gutro
NASA’s Goddard Space Flight Center

Flossie – Eastern Pacific Ocean

July 29, 2019 – NASA Takes Tropical Storm Flossie’s Temperature

NASA’s Aqua satellite took the temperature of Tropical Storm Flossie as it continued to strengthen and organize in the Eastern Pacific.

AIRS image of Flossie
On June 29, at 0459 UTC (0859 UTC) the AIRS instrument aboard NASA’s Aqua satellite analyzed cloud top temperatures of Tropical Storm Flossie in infrared light. AIRS found coldest cloud top temperatures (purple) of strongest thunderstorms were as cold as or colder than minus 63 degrees Fahrenheit (minus 53 degrees Celsius). Credit: NASA JPL/Heidar Thrastarson

Tropical Depression 7E formed in the Eastern Pacific Ocean on Sunday, July 28 about 580 miles (930 km) south-southwest of Manzanillo, Mexico. On July 29 at 5 a.m. EDT (0900 UTC), the depression strengthened into a tropical storm and was renamed Flossie.

Infrared light enables NASA to take the temperatures of clouds and thunderstorms that make up tropical cyclones. The stronger the storms are indicate that they extend high into the troposphere and have cold cloud top temperatures.

An infrared look at Flossie by NASA’s Aqua satellite on June 29, at 0459 UTC (0859 UTC) revealed where the strongest storms were located within the system. The Atmospheric Infrared Sounder or AIRS instrument aboard NASA’s Aqua satellite analyzed Flossie and found cloud top temperatures of strongest thunderstorms as cold as or colder than minus 63 degrees Fahrenheit (minus 53 degrees Celsius) circling the center. Cloud top temperatures that cold indicate strong storms that have the capability to create heavy rain.

NOAA’s National Hurricane Center or NHC noted, “A series of fortuitous microwave images was helpful in locating the center of circulation and revealed significant banding improvements in the south semicircle portion of the cyclone.”

At 11 a.m. EDT (5 a.m. HST/1500 UTC), the center of Tropical Storm Flossie was located near latitude 12.5 degrees north and 114.6 degrees west longitude. Flossie is far from land areas, so there are no coastal watches in effect. Flossie’s center is about 780 miles (1,260 km) south-southwest of the southern tip of Baja California, Mexico.

NHC said Flossie is moving toward the west near 18 mph (30 kph) and this general motion is forecast to continue through Tuesday night, July 30. Maximum sustained winds have increased to near 50 mph (85 kph) with higher gusts.

Further strengthening is expected, and Flossie is expected to become a hurricane on Tuesday.

For updated forecasts, visit: www.nhc.noaa.gov

By Rob Gutro
NASA’s Goddard Space Flight Center