May 26, 2020 – NASA Catches the Extra-Tropical Ending of Mangga
By Sunday, May 24, Tropical Cyclone Mangga had already transitioned to an extra-tropical storm and was affecting the southwestern coast of Australia.
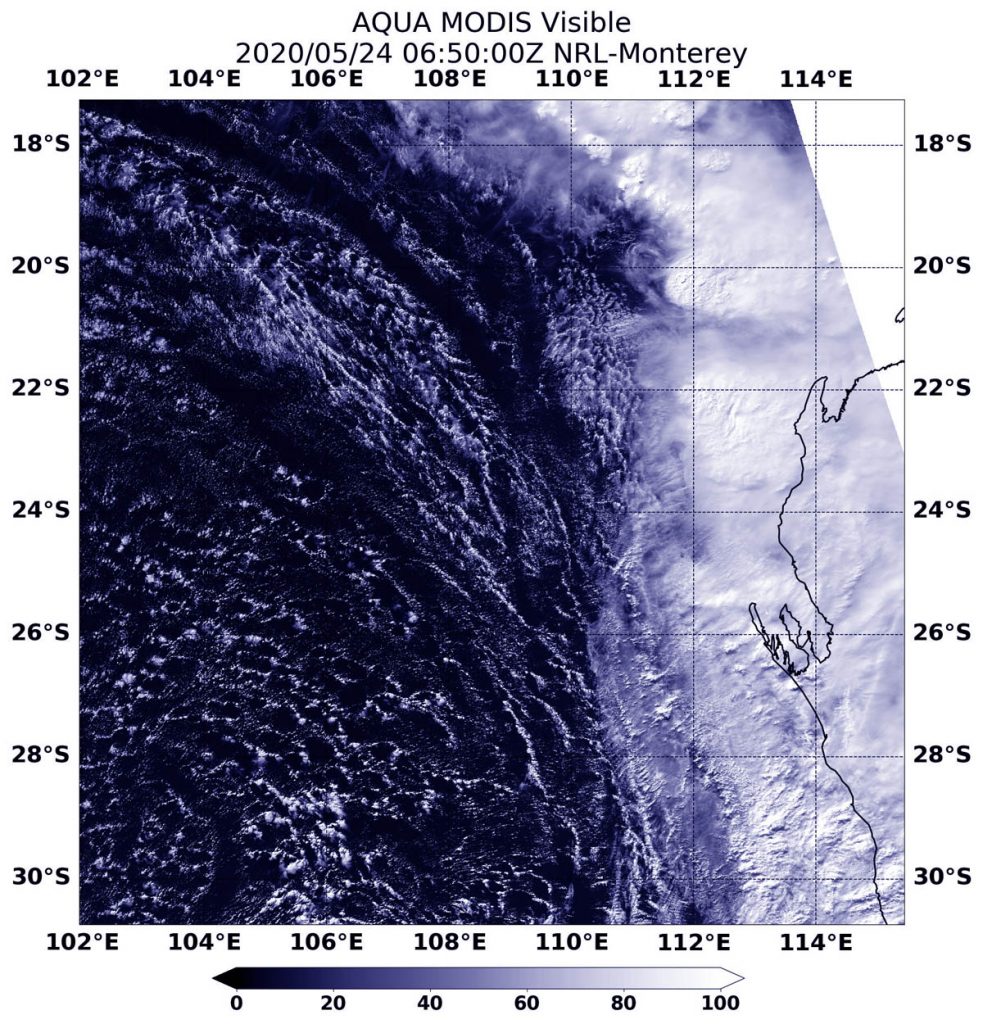
NASA’s Aqua satellite provided a visible look at extra-tropical storm Mangga the southwestern coast of Western Australia on May 24. The center of circulation was difficult to pinpoint in the visible image. Credit: NASA/NRL
When a storm becomes extra-tropical, it means that a tropical cyclone has lost its “tropical” characteristics. The National Hurricane Center defines “extra-tropical” as a transition that implies both poleward displacement (meaning it moves toward the north or south pole) of the cyclone and the conversion of the cyclone’s primary energy source from the release of latent heat of condensation to baroclinic (the temperature contrast between warm and cold air masses) processes. It is important to note that cyclones can become extra-tropical and retain winds of hurricane or tropical storm force.
The Australian Bureau of Meteorology issued Severe Weather Warnings in Western Australia on Sunday as the extra-tropical system tracked in a southeasterly direction.
The final warning for Mangga came on May 23 at 5 pm EDT (2100 UTC), when it was located near latitude 21.6 south and longitude 104.7 east, about 525 nautical miles west of Learmonth, Australia. Mangga was moving southeast at a speedy 44 knots (51 mph/81 kph) and had maximum sustained winds of 35 knots (40 mph/65 kph).
NASA’s Aqua satellite provided a visible look at the extra-tropical low-pressure area along the southwestern coast of Western Australia on May 24. The center of circulation was difficult to pinpoint in the visible image, captured by the Moderate Resolution Imaging Spectroradiometer, an instrument that flies aboard Aqua.
On May 24, the Australian Bureau of Meteorology’s Severe Weather Warning called for “Damaging, locally destructive winds and abnormally high tides for people in Central West, Lower West, South West, South Coastal, South East Coastal, Great Southern, Central Wheat Belt and parts of Gascoyne and Goldfields districts.”
The extra-tropical low-pressure area passed over the southwestern part of the state on Monday, May 25 as it continued to weaken and move back over open waters of the Indian Ocean.
May 22, 2020 – NASA Examines Tropical Storm Mangga in Infrared Light
NASA’s Aqua satellite used infrared light to provide forecasters with a look at the temperatures of the cloud tops in Tropical Storm Mangga.
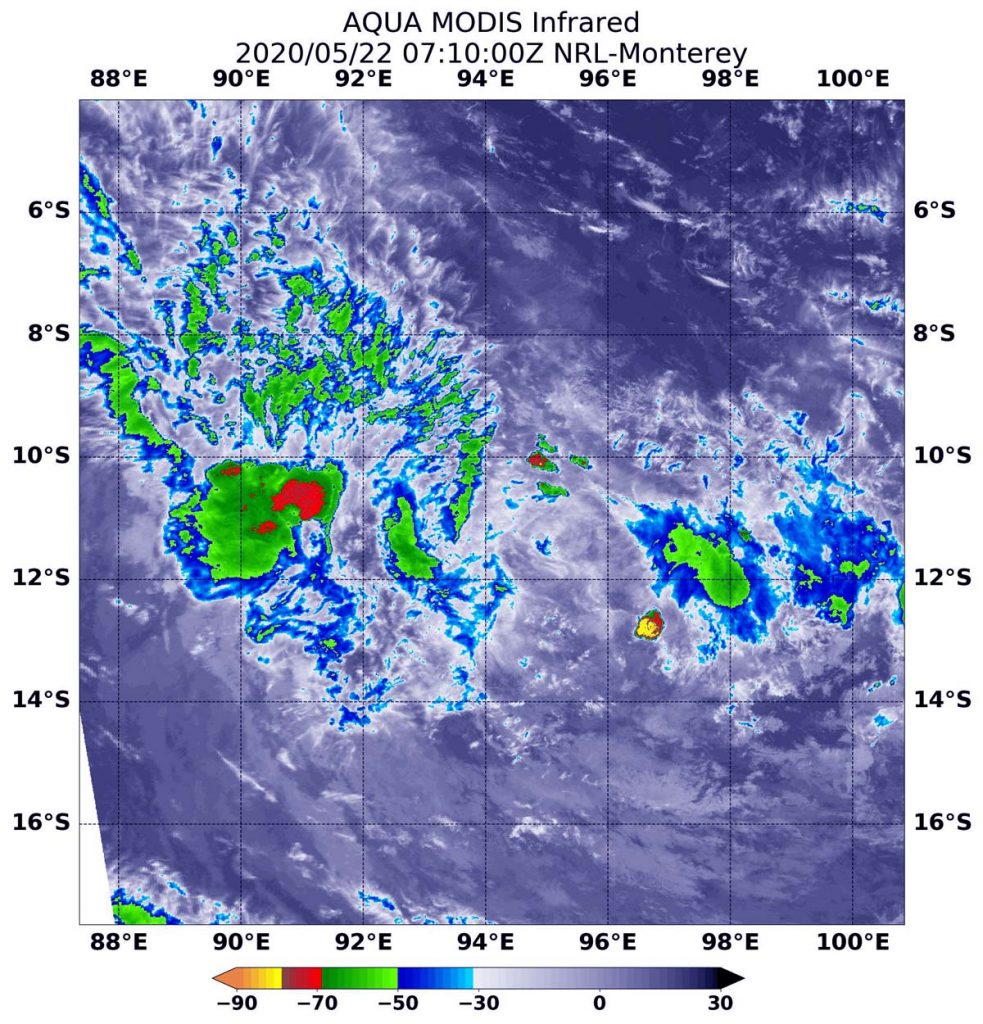
On May 22 at 3:10 a.m. EST (0710 UTC), the MODIS instrument aboard NASA’s Aqua satellite gathered temperature information about Tropical Storm Mangga’s cloud tops. MODIS found one small area of powerful thunderstorms (red) where temperatures were as cold as or colder than minus 70 degrees Fahrenheit (minus 56.6 Celsius). Credit: NASA/NRL
Mangga, formerly known as 27S, is moving through the Southern Indian Ocean. Mangga was approaching the Cocos (Keeling) Islands, where a tropical cyclone warning was in effect on May 22.
NASA’s Aqua satellite used infrared light to analyze the strength of storms in Mangga. Infrared data provides temperature information, and the strongest thunderstorms that reach high into the atmosphere have the coldest cloud top temperatures. On May 22 at 3:10 a.m. EST (0710 UTC), the Moderate Resolution Imaging Spectroradiometer or MODIS instrument aboard NASA’s Aqua satellite gathered temperature information about Tropical Storm Mangga’s cloud tops. MODIS found one area of powerful thunderstorms where temperatures were as cold as or colder than minus 70 degrees Fahrenheit (minus 56.6 Celsius). Cloud top temperatures that cold indicate strong storms with the potential to generate heavy rainfall.
Cloud tops of storms surrounding that area were warmer, indicating those storms were weaker and fragmented.
At 5 a.m. EDT (0900 UTC) on May 22, Tropical Storm Mangga was located near latitude 11.1 degrees south and longitude 94.2 degrees east, about 1,324 nautical miles west-northwest of Learmonth, Western Australia. Mangga was moving to southeast and had maximum sustained winds near 35 knots (40 mph/65 kph).
Mangga is forecast to strengthen to 45 knots (52 mph/83 kph), but become extra-tropical before making landfall in southwestern Australia on Sunday, May 24, between Perth and Learmonth.
Typhoons and hurricanes are the most powerful weather events on Earth. NASA’s expertise in space and scientific exploration contributes to essential services provided to the American people by other federal agencies, such as hurricane weather forecasting.
May 21, 2020 – NASA-NOAA Satellite Catches Development of Tropical Storm 27S
NASA-NOAA’s Suomi NPP satellite passed over the Southern Indian Ocean and provided forecasters with a visible image of newly formed Tropical Storm 27S.
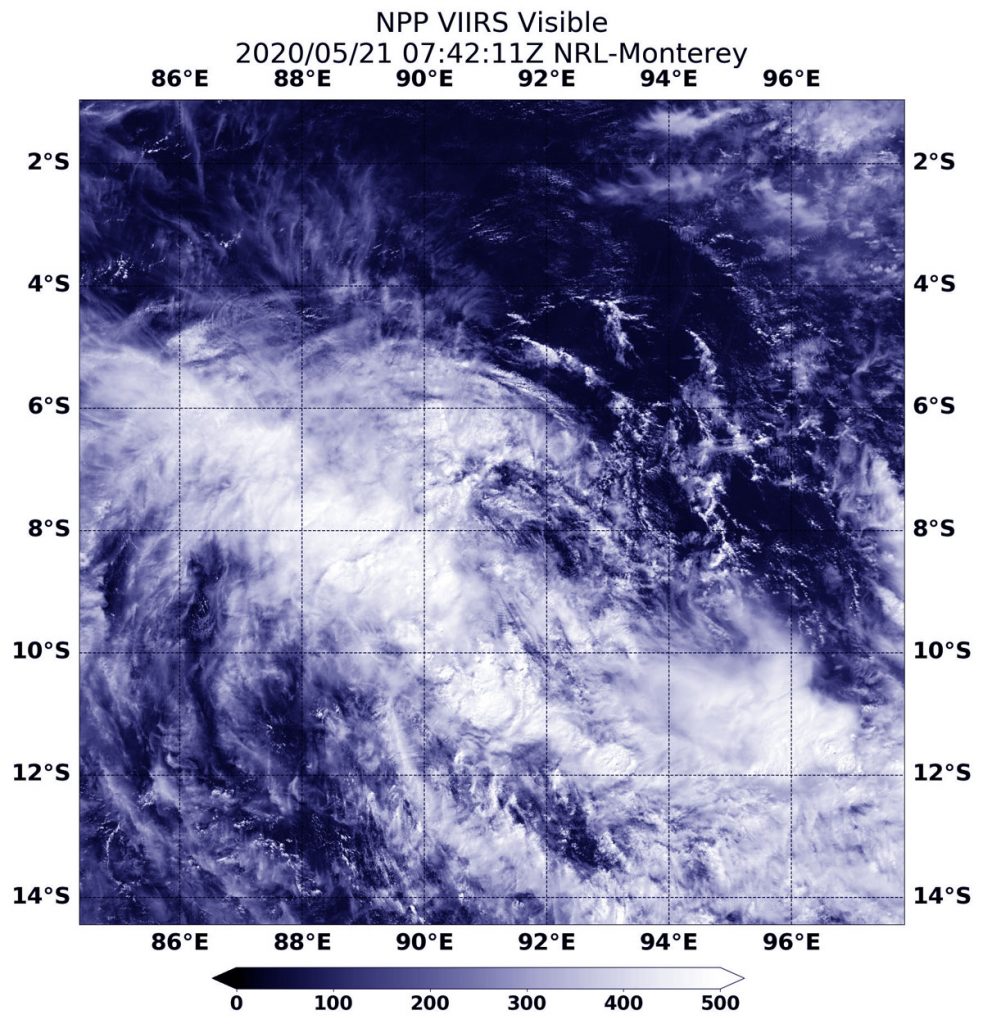
NASA-NOAA’s Suomi NPP satellite passed over the Southern Indian Ocean and found that newly formed Tropical Storm 27S had developed. The storm still appeared somewhat disorganized. Credit: NASA/NRL
The Visible Infrared Imaging Radiometer Suite (VIIRS) instrument aboard Suomi NPP provided a visible image of Tropical Cyclone 27S that revealed a large, weakly-defined low-level circulation center with flaring thunderstorms building over the western side of the storm.
The Australian Bureau of Meteorology issued a tropical cyclone watch for the Cocos (Keeling) Islands.
At 0900 UTC (5 a.m. EDT) TropicalCyclone 27S was located near latitude 9.1 degrees south and longitude 92.2 degrees east, about 1,489 nautical miles west-northwest of Learmonth, Australia. 27S was moving to the south-southeast and had maximum sustained winds near 35 knots (40 mph/65 kph).
The Joint Typhoon Warning Center (JTWC) expects 27S will move southeast, past the Cocos Islands. The system is forecast to strengthen to 55 knots, and then become extra-tropical before making landfall in southwestern Australia. 27S is forecast to make landfall in Western Australia between Perth and Learmonth, on Sunday, May 24.
Tropical cyclones/hurricanes are the most powerful weather events on Earth. NASA’s expertise in space and scientific exploration contributes to essential services provided to the American people by other federal agencies, such as hurricane weather forecasting.
May 21, 2020 – NASA Calculates Former Cyclone Amphan’s Massive Rainfall
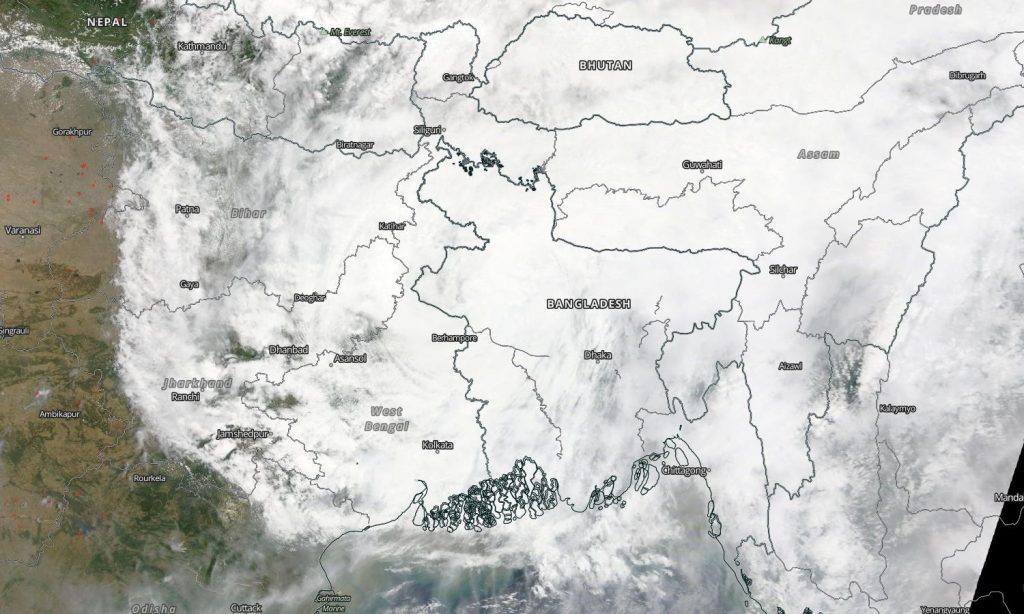
When Cyclone Amphan was a Category 5 hurricane while tracking through the Bay of Bengal, NASA calculated the massive rainfall it generated. By May 21, NASA’s Terra satellite showed the once powerful storm’s remnants now over Bangladesh.
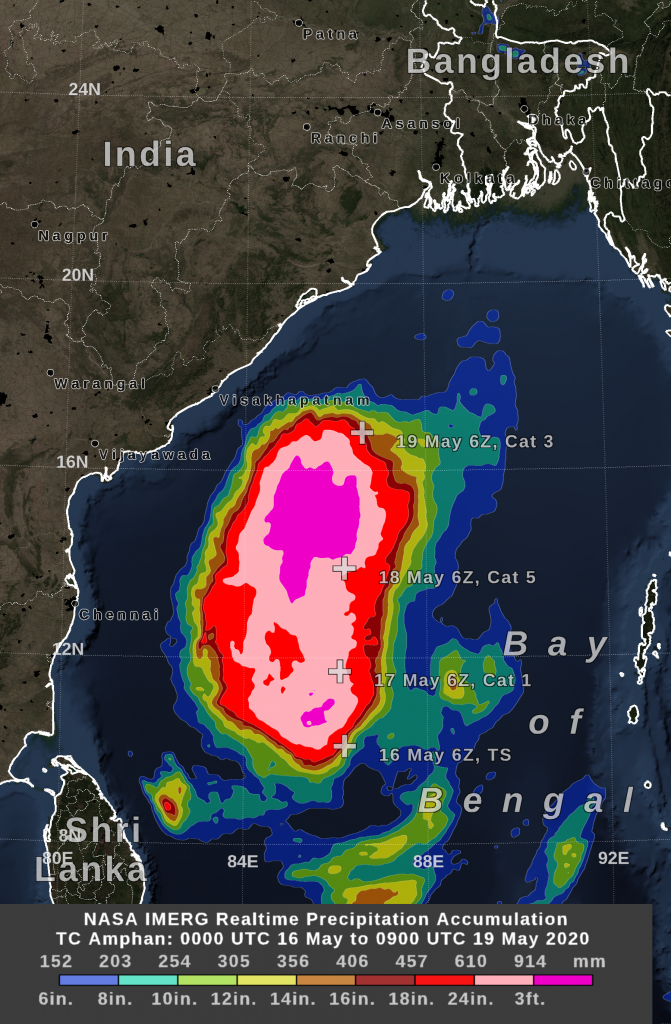
GPM IMERG estimated rainfall totals from Cyclone Amphan from May 16 – 19, 2020. GPM data revealed Amphan generated over 914 mm or 36 inches of rainfall over the Bay. Credit: NASA Goddard, Owen Kelley
The Global Precipitation Measurement mission or GPM Core Observatory satellite observed Tropical Cyclone Amphan as it tracked north over the Bay of Bengal during the week of May 18. NASA monitored the heavy rain associated with Tropical Cyclone Amphan.
NASA uses the GPM and other satellite data to generate a near-realtime rain estimate. That estimate comes from the NASA’s Integrated Multi-satellitE Retrievals for GPM (IMERG) algorithm, which combines observations from a fleet of satellites, in near-realtime, to provide near-global estimates of precipitation every 30 minutes.
“The largest rainfall accumulation had fallen over the Bay of Bengal on May 18 while Amphan was at category 5 on the Saffir-Simpson scale,” said Owen Kelley, a researcher at NASA’s Goddard Space Flight Center in Greenbelt, Md., who created a rainfall image. GPM data revealed Amphan generated over 914 mm or 36 inches of rainfall over an area in the Bay from May 16 to 19, 2020.
Amphan made landfall at [5 a.m. EDT] 0900 UTC (2:30 PM local time) on May 20, 2020. Landfall occurred near the India-Bangladesh border along the northern edge of the Bay of Bengal.
On May 21, NASA’s Terra satellite provided a visible image of the remnants of former tropical cyclone Amphan, now over Bangladesh. Credit: NASA Worldview
On May 21, the Moderate Resolution Imaging Spectroradiometer instrument that flies aboard NASA’s Terra satellite provided a visible image of the remnants of former tropical cyclone Amphan, located over Bangladesh. Amphan’s remnants are expected to dissipate over the week.
May 20, 2020 – NASA Satellites Covering Typhoon Amphan Headed for Landfall
NASA satellites have been providing forecasters with various types of imagery on Typhoon Amphan as it heads toward a landfall near the border of eastern India and Bangladesh on May 20.
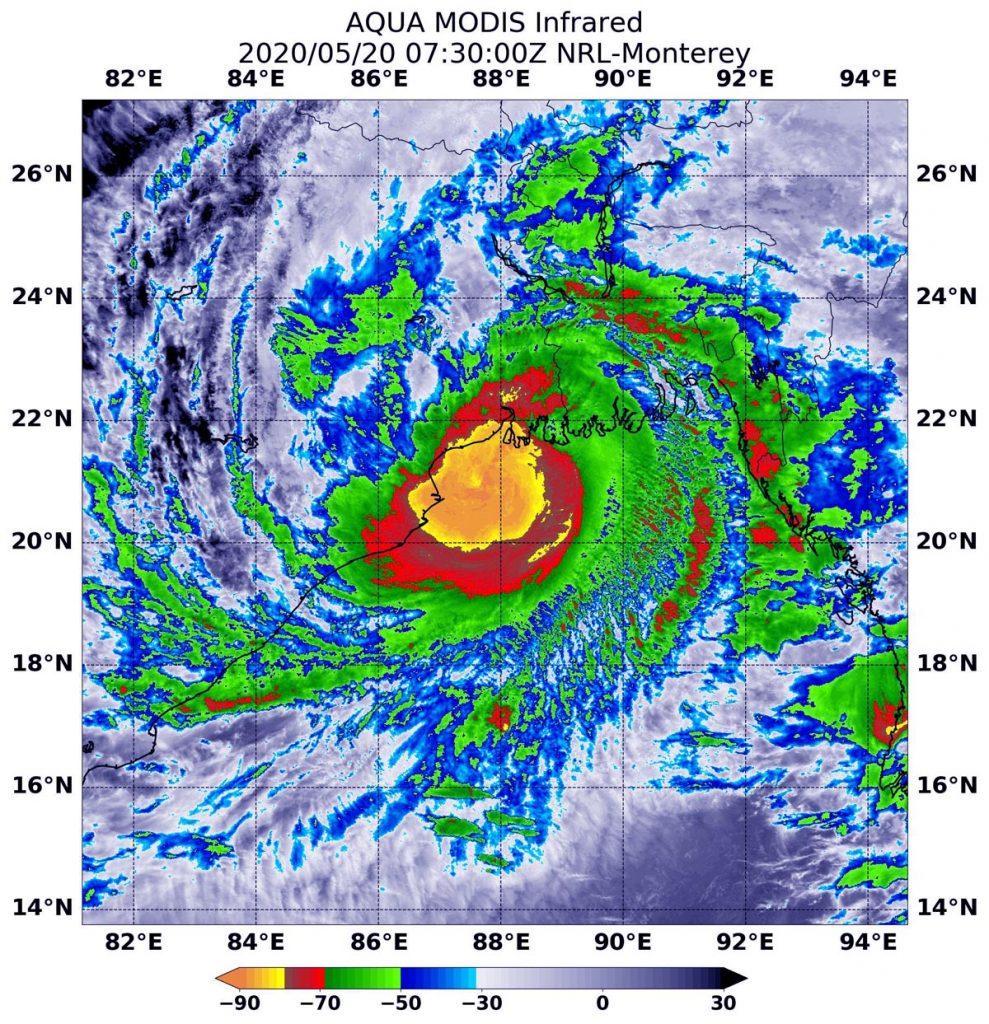
On May 20, 2020 at 3:30 a.m. EDT (0730 UTC), the MODIS instrument that flies aboard NASA’s Aqua satellite found coldest cloud top temperatures (yellow) in a large area around Amphan’s center of circulation and along the coast on northeastern India. It was as cold as or colder than minus 80 degrees Fahrenheit (minus 62.2 Celsius). Credit: NASA/NRL
NASA-NOAA’s Suomi NPP satellite provided visible imagery of Amphan and NASA’s Aqua satellite provided an infrared view of the storm’s cloud top temperatures. Amphan was moving north through the Bay of Bengal and forecast to make landfall in northeastern India near Kolkata, which is just west of the border with Bangladesh.
The Bay of Bengal is located in the northeastern part of the Indian Ocean. The Bay is framed by India to the west, Bangladesh to the north, and Myanmar to the east.
On May 19, the Visible Infrared Imaging Radiometer Suite (VIIRS) instrument aboard Suomi NPP provided a visible image Amphan. The image showed that Amphan covered the northern part of the Bay of Bengal.
NASA-NOAA’s Suomi NPP satellite provided this visible image of Typhoon Amphan headed toward landfall near the border of eastern India and Bangladesh on May 20, 2020. The image showed that Amphan covered the northern part of the Bay of Bengal. Credit: NASA Worldview, Earth Observing System Data and Information System (EOSDIS)
Tropical cyclones are made up hundreds of thunderstorms, and infrared data can show where the strongest storms are located. They can do that because infrared data provides temperature information, and the strongest thunderstorms that reach highest into the atmosphere have the coldest cloud top temperatures. Convection is rising air that condenses and forms the thunderstorms that make up a tropical cyclone. When it is strong, it pushes clouds higher into the troposphere (the layer of atmosphere closest to Earth’s surface). The higher you go in the troposphere, the colder the air temperature gets and colder cloud tops indicate stronger storms.
On May 20, 2020, at 3:30 a.m. EDT (0730 UTC) the Moderate Resolution Imaging Spectroradiometer or MODIS instrument and the Atmospheric Infrared Sounder or AIRS instrument that both fly aboard NASA’s Aqua satellite found coldest cloud top temperatures in a large area around Amphan’s center of circulation and along the coast on northeastern India. It was as cold as or colder than minus 80 degrees Fahrenheit (minus 62.2 Celsius). NASA research has found that cloud top temperatures that cold indicate strong storms with the potential to generate heavy rainfall.
On May 20, 2020 at 3:29 a.m. EDT (0729 UTC), the AIRS instrument that flies aboard NASA’s Aqua satellite found coldest cloud top temperatures (purple) in a large area around Amphan’s center of circulation and along the coast on northeastern India. It was as cold as or colder than minus 80 degrees Fahrenheit (minus 62.2 Celsius). Credit: NASA/JPL, Heidar Thrastarson
On May 20 at 5 a.m. EDT (0900 UTC), Tropical Cyclone Amphan was located near latitude 20.5 degrees north and longitude 87.9 degrees east, approximately, 129 miles south-southwest of Kolkata, India. Amphan was moving to the north-northeast and had maximum sustained winds 85 knots (98 mph/157 kph). Amphan continued to hold on to Category 2 hurricane status on the Saffir-Simpson Hurricane Wind Scale.
Forecasters at the Joint Typhoon Warning Center said that Amphan was weakening as it moves north-northeast toward landfall. That landfall occurred in the morning hours of May 20 Eastern Daylight Time.
The Regional Specialized Meteorological Center (RSMC) in New Dehli, India reported, “Amphan crossed West Bengal-Bangladesh coast between Digha (West Bengal) and Hatiya Islands (Bangladesh) across Sunderbans near latitude 21.65 degrees north and longitude 88.3 degrees east between 1530 and 1730 [India Standard Time or] IST (6 and 8 a.m. EDT) on May 20 with wind speed of 155-165 kph [96 to 103 mph].” Amphan is forecast to move inland in a north-northeasterly direction.
Tropical cyclones/hurricanes are the most powerful weather events on Earth. NASA researches these storms to determine how they rapidly intensify, develop and behave. NASA’s expertise in space and scientific exploration contributes to essential services provided to the American people by other federal agencies, such as hurricane weather forecasting.
May 20, 2020 – NASA-NOAA Satellite Catches Post-Tropical Storm Arthur’s End
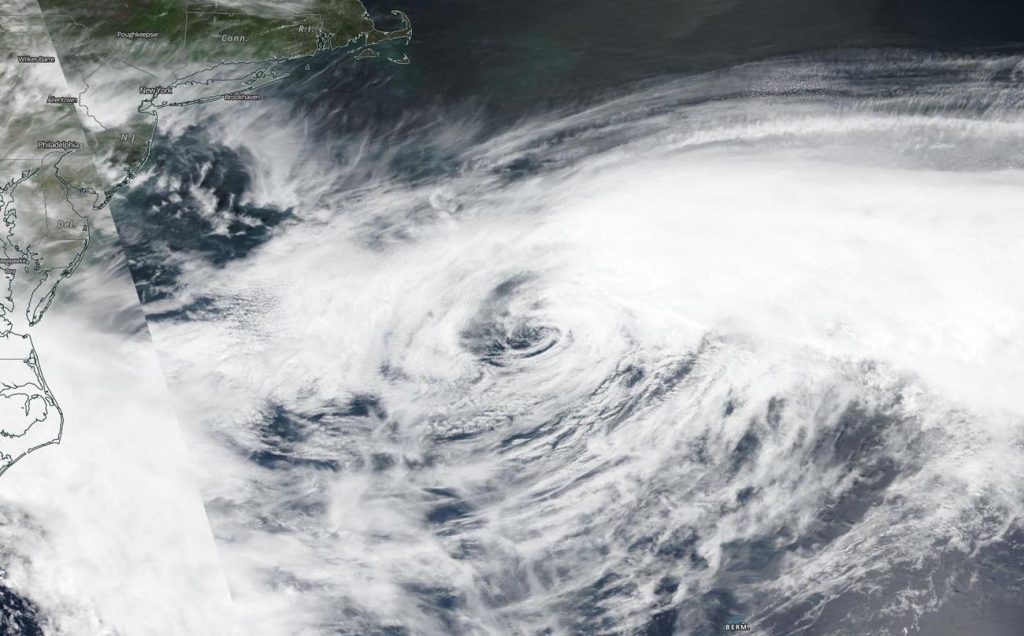
NASA-NOAA’s Suomi NPP satellite passed over the western North Atlantic Ocean and provided forecasters with a visible image of Post Tropical Storm Arthur.
NASA-NOAA’s Suomi NPP satellite found post tropical storm Arthur out in the Western Atlantic Ocean far from the U.S. and parallel to the Virginia/North Carolina border. Credit: NASA Worldview, Earth Observing System Data and Information System (EOSDIS)
During the afternoon (Eastern Daylight Time/U.S.) of May 19, the Visible Infrared Imaging Radiometer Suite (VIIRS) instrument aboard Suomi NPP provided a visible image of Arthur and showed a weak circulation with the bulk of clouds northeast and east of the center. Arthur is located out in the Western Atlantic Ocean far from the U.S. coast and parallel to the Virginia/North Carolina border.
The NOAA National Hurricane Center’s Tropical Weather Discussion on May 20 at 8:05 a.m. EDT noted, “Post-Tropical Cyclone Arthur is north of the area near latitude 35 degrees north and longitude 65 degrees west. Arthur will move southeast to south through Thursday [May 21], and weaken. Large northeastern [ocean] swell from Arthur will affect the waters that are to the NE of the Bahamas, through Friday [May 22], and then subside on Friday night and Saturday.“
Tropical cyclones/hurricanes are the most powerful weather events on Earth. NASA’s expertise in space and scientific exploration contributes to essential services provided to the American people by other federal agencies, such as hurricane weather forecasting.
May 19, 2020 – NASA-NOAA Satellite Sees Amphan’s Eye Obscured
Early on May 18, 2020, Tropical Cyclone Amphan was a Category 5 storm in the Northern Indian Ocean. On May 19, satellite data from NASA-NOAA’s Suomi NPP satellite revealed that the storm has weakened and the eye was covered by high clouds.
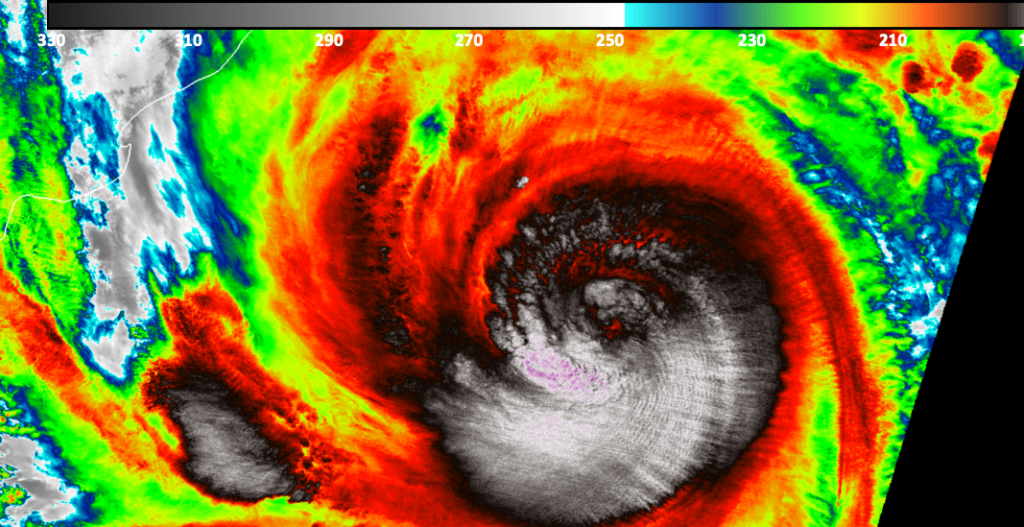
NASA-NOAA’s Suomi NPP satellite passed over Tropical Cyclone Amphan on May 18 at 4:28 p.m. EDT (2028 UTC) and the VIIRS instrument aboard captured cloud top temperatures using infrared light. Cloud top temperatures were as cold as minus 80 degrees Fahrenheit (minus 62.2 Celsius), indicating powerful storms. Credit: NASA/NOAA/UWM-CIMISS, William Straka III
When NASA-NOAA’s Suomi NPP satellite passed over Tropical Cyclone Amphan on May 18 at 4:28 p.m. EDT (2028 UTC), infrared imagery revealed very cold cloud top temperatures and an obscured eye. The higher the cloud top, the colder it is, and the stronger the storm. The VIIRS instrument found several areas within where cloud top temperatures were as cold as minus 80 degrees Fahrenheit (minus 62.2 Celsius), indicating powerful storms. Storms with cloud tops that cold have been found to generate heavy rainfall.
The Joint Typhoon Warning Center noted, “Satellite imagery also revealed that the eyewall is open on the eastern side of the eye, indicative of the easterly vertical shear and mid-level dry air moving into the tropical cyclone.”
On May 19 at 5 a.m. EDT (0900 UTC), Tropical Cyclone Amphan was located near latitude 16.5 degrees north and longitude 86.8 degrees east, that is about 377 nautical miles south-southwest of Kolkata, India. Amphan was moving to the north-northeast and had maximum sustained winds near 110 knots.
Amphan is weakening as it moves north-northeast. The storm is forecast to make landfall near Kolkata on May 20 soon after 2 a.m. EDT (0600 UTC), according to the Joint Typhoon Warning Center.
Typhoons/hurricanes are the most powerful weather events on Earth. NASA’s expertise in space and scientific exploration contributes to essential services provided to the American people by other federal agencies, such as hurricane weather forecasting.
May 19, 2020 – NASA Examines Tropical Storm Arthur’s Rainfall as it Transitions
When the Global Precipitation Measurement mission or GPM core satellite passed over the western North Atlantic Ocean, it captured rainfall data on Tropical Storm Arthur as the storm was transitioning into an extra-tropical storm.
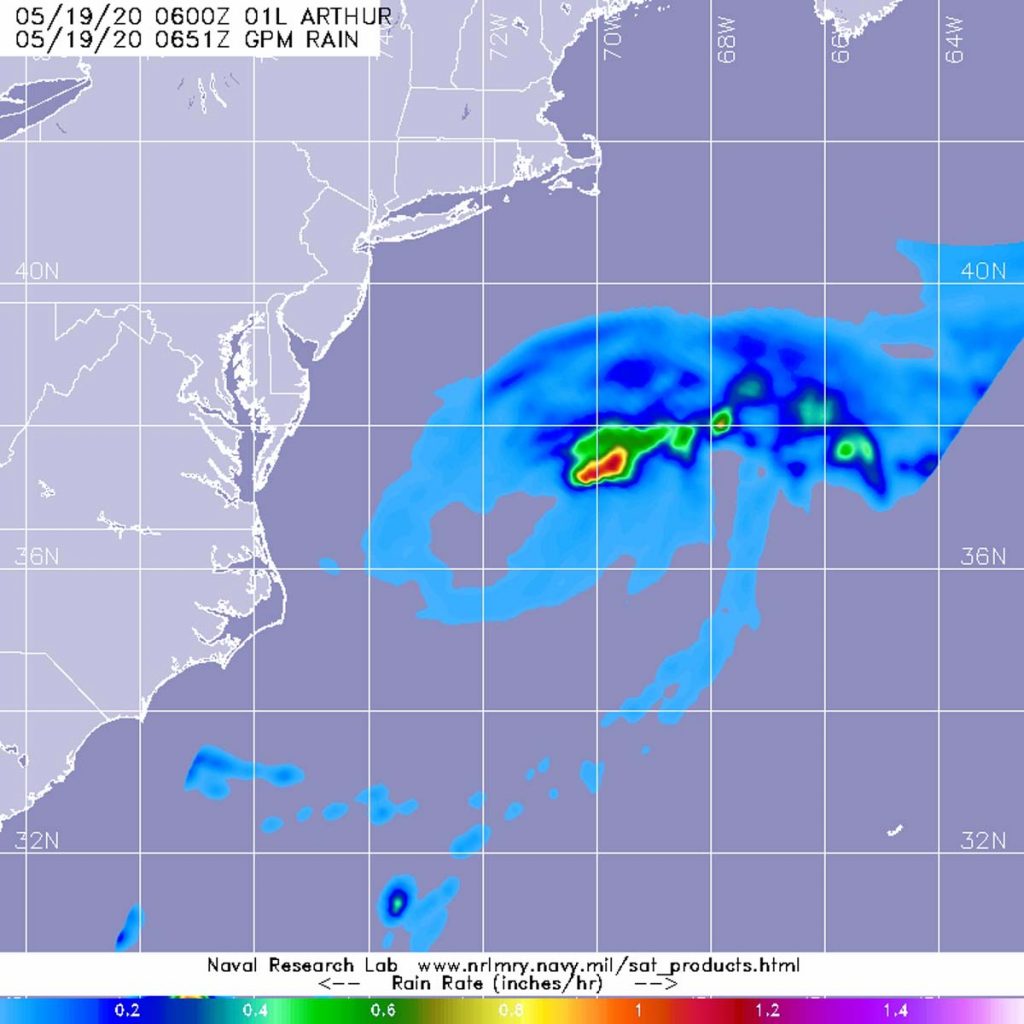
The GPM core satellite passed over Tropical Storm Arthur in the western North Atlantic Ocean on May 19 at 2:51 a.m. EDT (0651 UTC) and found the heaviest rainfall (red) on the northeastern side of the storm falling at a rate of over 25mm (over 1 inch) per hour. Credit: NASA/JAXA/NRL
The GPM’s core satellite passed over Arthur on May 19 at 2:51 a.m. EDT (0651 UTC) and found the heaviest rainfall on the northeastern side of the storm falling at a rate of over 25mm (over 1 inch) per hour. Lighter rainfall rates were measured throughout the rest of the storm. Forecasters at NOAA’s National Hurricane Center or NHC incorporate the rainfall data into their forecasts.
NHC forecasters noted at 5 a.m. EDT (0900 UTC) on May 19, “Arthur’s cloud pattern has continued to take on a generally post-tropical appearance, though a recent convective burst near its center suggests that it isn’t quite post-tropical yet. Satellite imagery and earlier scatterometer data also indicate the presence of a developing warm front near the cyclone’s center, and this could be contributing the development of the aforementioned convective burst.”
NHC said the center of Tropical Storm Arthur was located near latitude 37.0 north, longitude 70.6 west, about 300 miles (485 km) east-northeast of Cape Hatteras, North Carolina. Arthur was moving toward the east-northeast near 15 mph (24 kph). Maximum sustained winds are near 60 mph (95 kph) with higher gusts. The estimated minimum central pressure is 991 millibars.
The NHC cautions that swells generated by Arthur are expected to affect portions of the mid-Atlantic and southeast U.S. coasts during the next day or two. These swells could cause life-threatening surf and rip current conditions.
Arthur is forecast to become post-tropical later today and is forecast to slow down and turn toward the south in another day or so. Arthur is expected to dissipate by the end of the week.
A Post-Tropical Storm is a generic term for a former tropical cyclone that no longer possesses sufficient tropical characteristics to be considered a tropical cyclone. Former tropical cyclones that have become extratropical, subtropical, or remnant lows are all three classes of post-tropical cyclones. In any case, they no longer possesses sufficient tropical characteristics to be considered a tropical cyclone. However, post-tropical cyclones can continue carrying heavy rains and produce high winds.
Hurricanes/tropical cyclones are the most powerful weather events on Earth. NASA’s expertise in space and scientific exploration contributes to essential services provided to the American people by other federal agencies, such as hurricane weather forecasting.
GPM is a joint mission between NASA and the Japan Aerospace Exploration Agency, JAXA.
May 18, 2020 – NASA Finds Heavy Water Vapor Concentration Rings Eye of Cyclone Amphan
When NASA’s Aqua satellite passed over the Northern Indian Ocean on May 18, it gathered water vapor data that showed the intensity of powerful Tropical Cyclone Amphan. Amphan is the equivalent of a Category 5 hurricane on the Saffir-Simpson Hurricane Wind Scale.
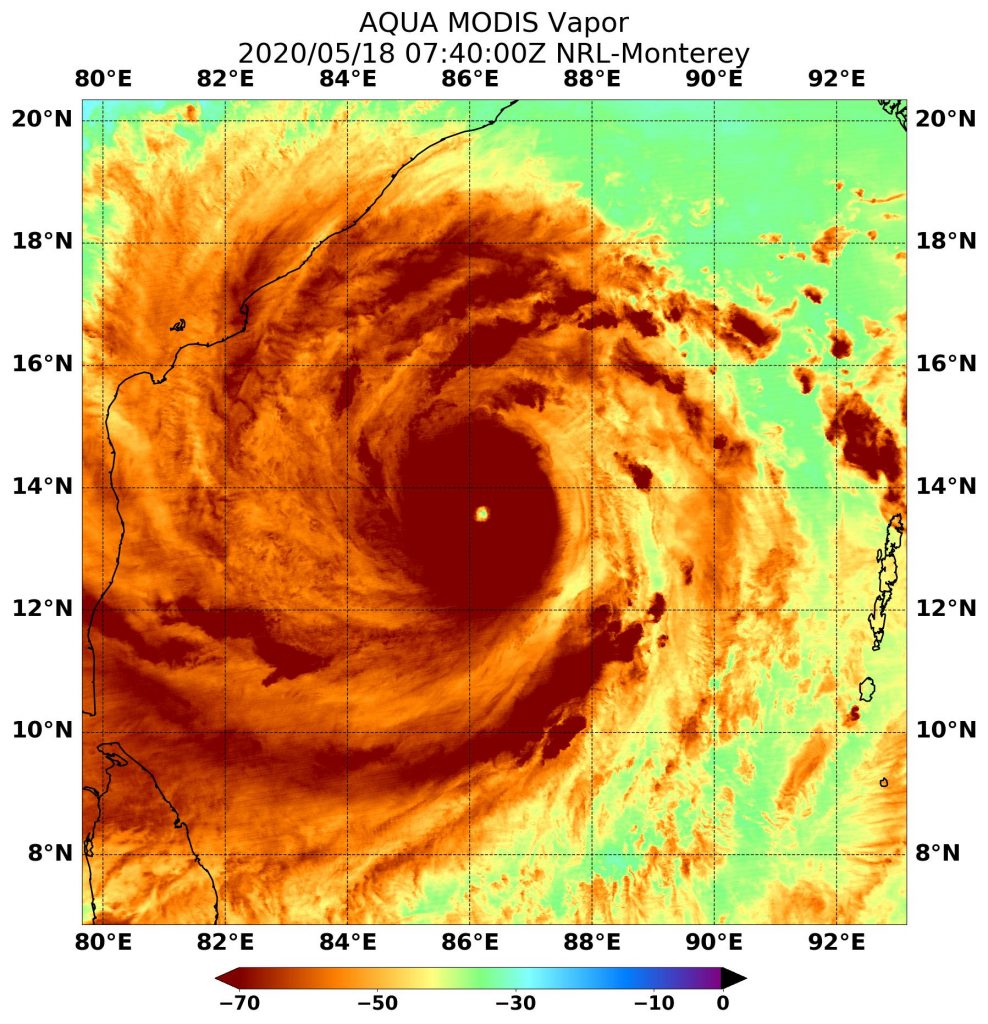
On May 18 at 3:40 a.m. EST (0740 UTC), NASA’s Aqua satellite passed over Tropical Cyclone Amphan, located in the Northern Indian Ocean. Aqua found highest concentrations of water vapor (brown) and coldest cloud top temperatures were around the clear eye. Credits: NASA/NRL
Water vapor analysis of tropical cyclones tells forecasters how much potential a storm has to develop. Water vapor releases latent heat as it condenses into liquid. That liquid becomes clouds and thunderstorms that make up a tropical cyclone. Temperature is important when trying to understand how strong storms can be. The higher the cloud tops, the colder and the stronger the storms.
NASA’s Aqua satellite passed over Tropical Cyclone Amphan on May 18 at 3:40 a.m. EST (0740 UTC), and the Moderate Resolution Imaging Spectroradiometer or MODIS instrument gathered water vapor content and temperature information. The MODIS image showed highest concentrations of water vapor and coldest cloud top temperatures circled the visible eye.
MODIS data showed coldest cloud top temperatures were as cold as or colder than minus 70 degrees Fahrenheit (minus 56.6 degrees Celsius) in those storms. Storms with cloud top temperatures that cold have the capability to produce heavy rainfall.
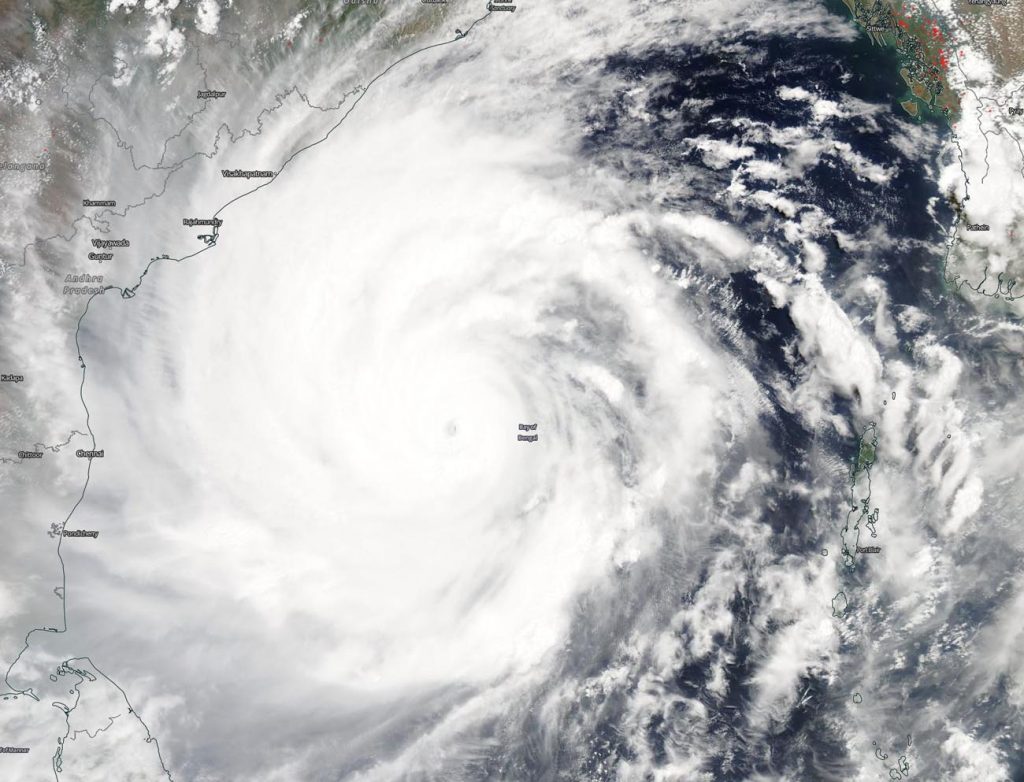
NASA-NOAA’s Suomi NPP satellite provided a visible image of the huge Tropical Cyclone Amphan on May 18, just off the eastern coast of India. The image showed the extent of the storm, which was over open ocean, stretching from just north of Sri Lanka, north, past the Indian states of Tamil Nadu to Andrha Pradesh.
At 5 a.m. EDT (0900 UTC) on May 18, the Joint Typhoon Warning Center (JTWC) noted that Amphan’s eye was centered near latitude 13.6 degrees north and longitude 86.4 degrees east, about 301 nautical miles southeast of Visakhapatnam, India. Amphan was moving to the north and had maximum sustained winds 140 knots (161 mph/259 kph).
NASA-NOAA’s Suomi NPP satellite provided a visible image of the huge Tropical Cyclone Amphan on May 18, just off the eastern coast of India. Credit: NASA Worldview
Amphan will move north and is expected to strengthen slightly. JTWC said the storm will then gradually weaken prior to landfall near Kolkata, India in two days.
NASA’s Aqua satellite is one in a fleet of NASA satellites that provide data for hurricane research.
Tropical cyclones/hurricanes are the most powerful weather events on Earth. NASA’s expertise in space and scientific exploration contributes to essential services provided to the American people by other federal agencies, such as hurricane weather forecasting.
May 18, 2020 – NASA Finds a Disorganized Tropical Storm Arthur Near North Carolina Coast
Infrared imagery from NASA’s Aqua satellite and radar imagery revealed that Tropical Storm Arthur remains poorly organized. Strongest storms, according to the Aqua data, appeared along and off the southeastern coast of North Carolina.
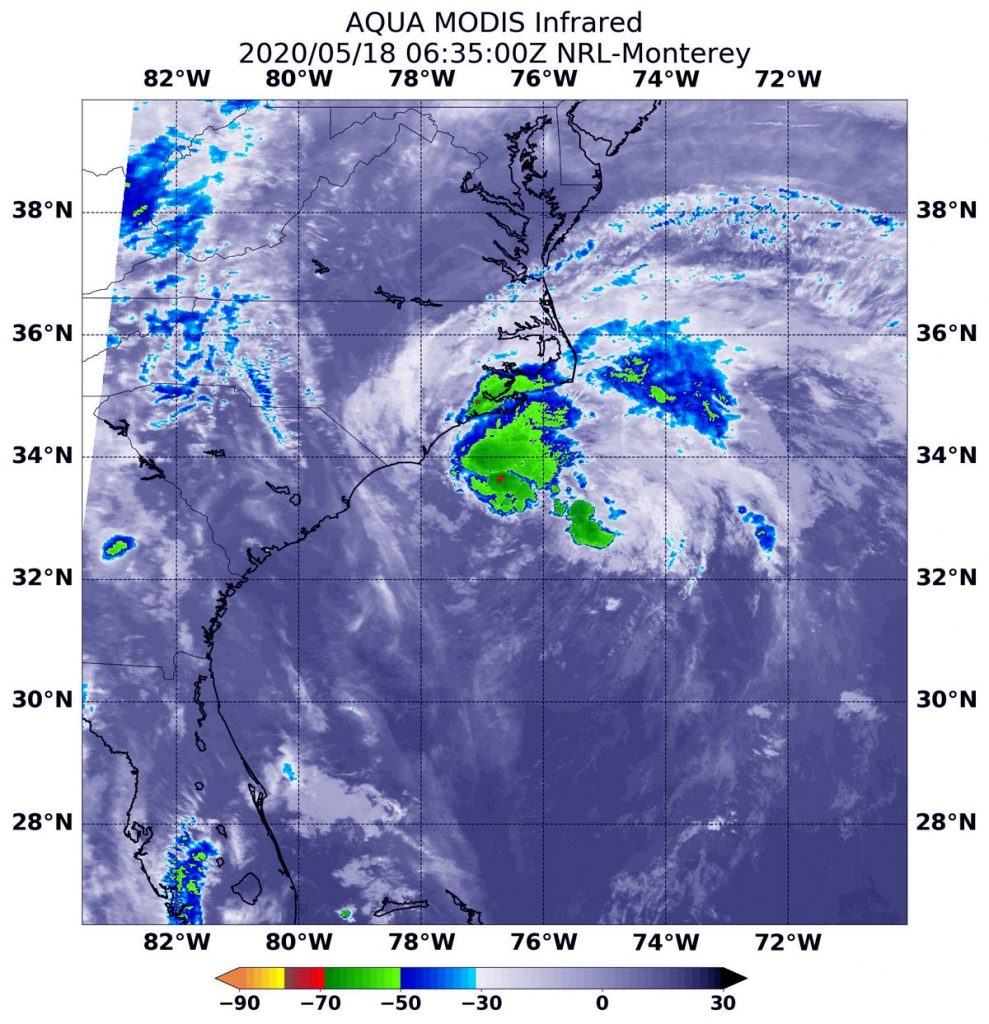
On May 18 at 2:35 a.m. EDT (0635 UTC), the MODIS instrument that flies aboard NASA’s Aqua satellite showed strongest storms in Tropical Storm Arthur were along the southeastern coast of North Carolina. Those strong storms contained cloud top temperatures were as cold as minus 63 degrees Fahrenheit (minus 52.7 Celsius). Credit: NASA/NRL
Warnings and Watches
On May 18, a Tropical Storm Warning is in effect from Surf City to Duck, North Carolina, and for the Pamlico and Albemarle Sounds.
Satellite Imagery
NASA’s Aqua satellite used infrared light to analyze the strength of storms and found the center of circulation was displaced from the bulk of them. Infrared data provides temperature information, and the strongest thunderstorms that reach high into the atmosphere have the coldest cloud top temperatures.
On May 18 at 2:35 a.m. EDT (0635 UTC), the MODIS instrument that flies aboard NASA’s Aqua satellite showed strongest storms in Tropical Storm Arthur were along the southeastern coast of North Carolina and just off-shore. Those strong storms contained cloud top temperatures were as cold as minus 63 degrees Fahrenheit (minus 52.7 Celsius). Cloud top temperatures that cold indicate strong storms with the potential to generate heavy rainfall.
MODIS imagery showed the low-level center located near the southwestern edge of a complex of ragged convective bands.
Status on May 18, 2020
At 8 a.m. EDT (1200 UTC), the National Hurricane Center (NHC) reported the center of Tropical Storm Arthur was located near latitude 34.5 north, longitude 75.9 west. Arthur was moving toward the north-northeast near 15 mph (24 kph). A turn toward the northeast with an increase in forward speed is expected later today, followed by a turn toward the east on Tuesday.
Maximum sustained winds are near 45 mph (75 kph) with higher gusts. While some strengthening is forecast during the next 48 hours, Arthur is likely to lose its tropical characteristics on Tuesday. Tropical-storm-force winds extend outward up to 90 miles (150 km) mainly to the east of the center.
The estimated minimum central pressure reported from an Air Force Reserve Hurricane Hunter aircraft is 1001 millibars.
Rip Currents and Life-Threatening Surf Along Coastal Areas
Swells generated by Arthur are affecting portions of the southeast U.S. coast and are expected to spread northward along the U.S. mid-Atlantic coast during the next day or two. NHC cautioned, “These swells could cause life-threatening surf and rip current conditions.”
Arthur’s Forecast Path
At 5 a.m. EDT on May 18, 2020, NOAA’s National Hurricane Center noted that Arthur’s movement is going to be affected by two factors: “A baroclinic trough (elongated area of low pressure) and associated surface front approaching from the west should cause Arthur to turn northeastward during the next several hours. The forecast track shows the center passing near or just offshore of the North Carolina Outer Banks. By Tuesday and Tuesday night, Arthur will be entering the strong mid-latitude Westerlies, which will steer cyclone eastward in a day or two.”