Sep. 26, 2019 – Lorenzo Now a More Organized and Powerful Hurricane on NASA Satellite Imagery
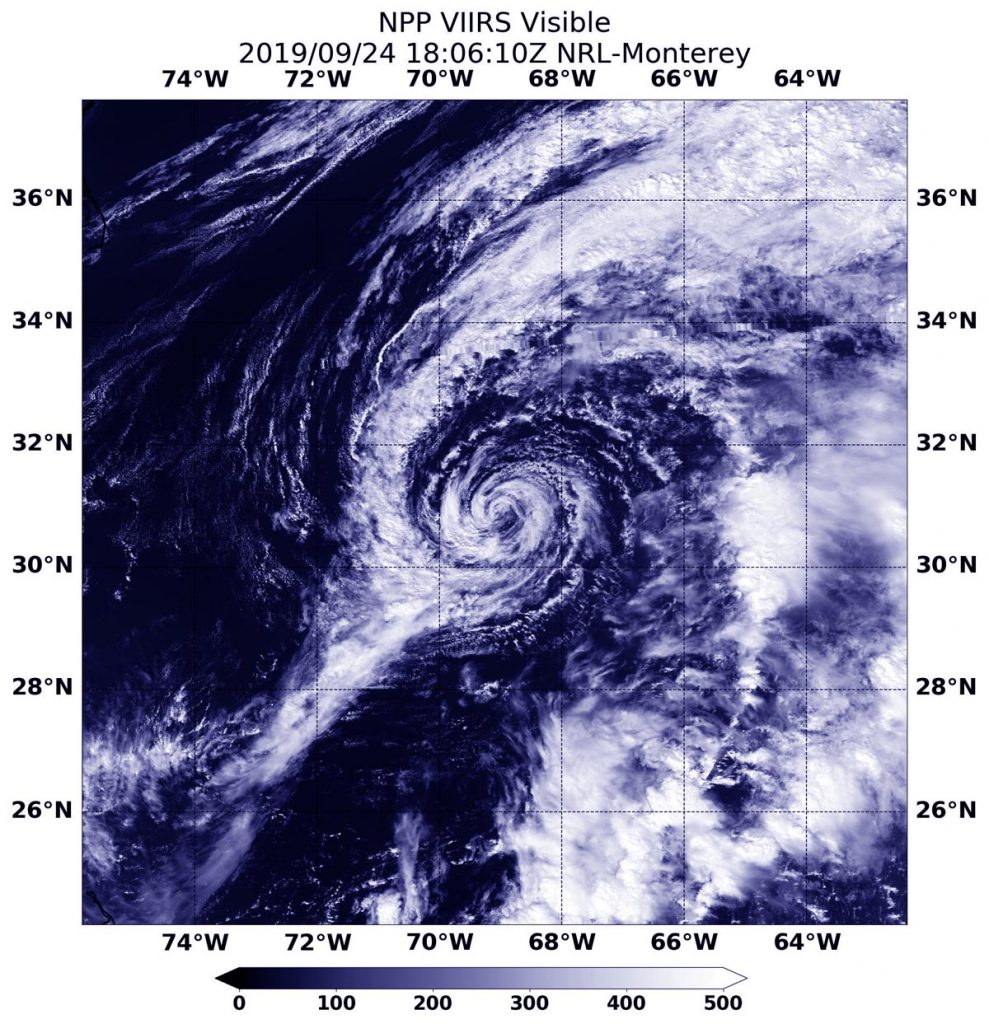
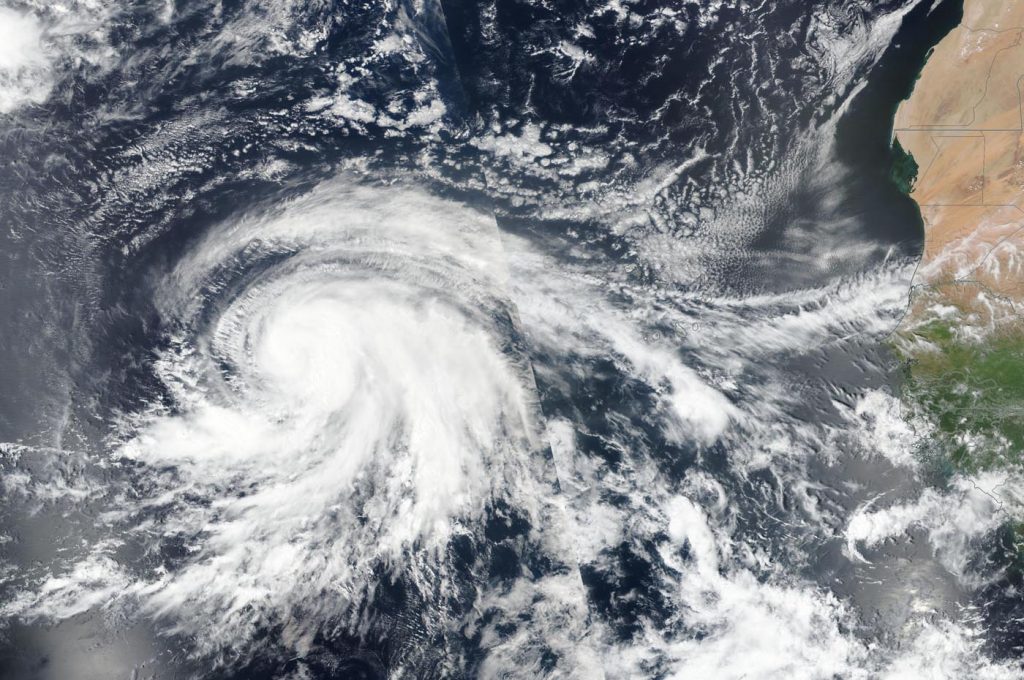
NASA-NOAA’s Suomi NPP satellite provided a full visible image of a strengthening Hurricane Lorenzo in the eastern North Atlantic Ocean. On Sept. 26, Lorenzo attained status as a major hurricane.
A major hurricane is one that is a Category 3 or higher on the Saffir-Simpson Hurricane Wind Scale.
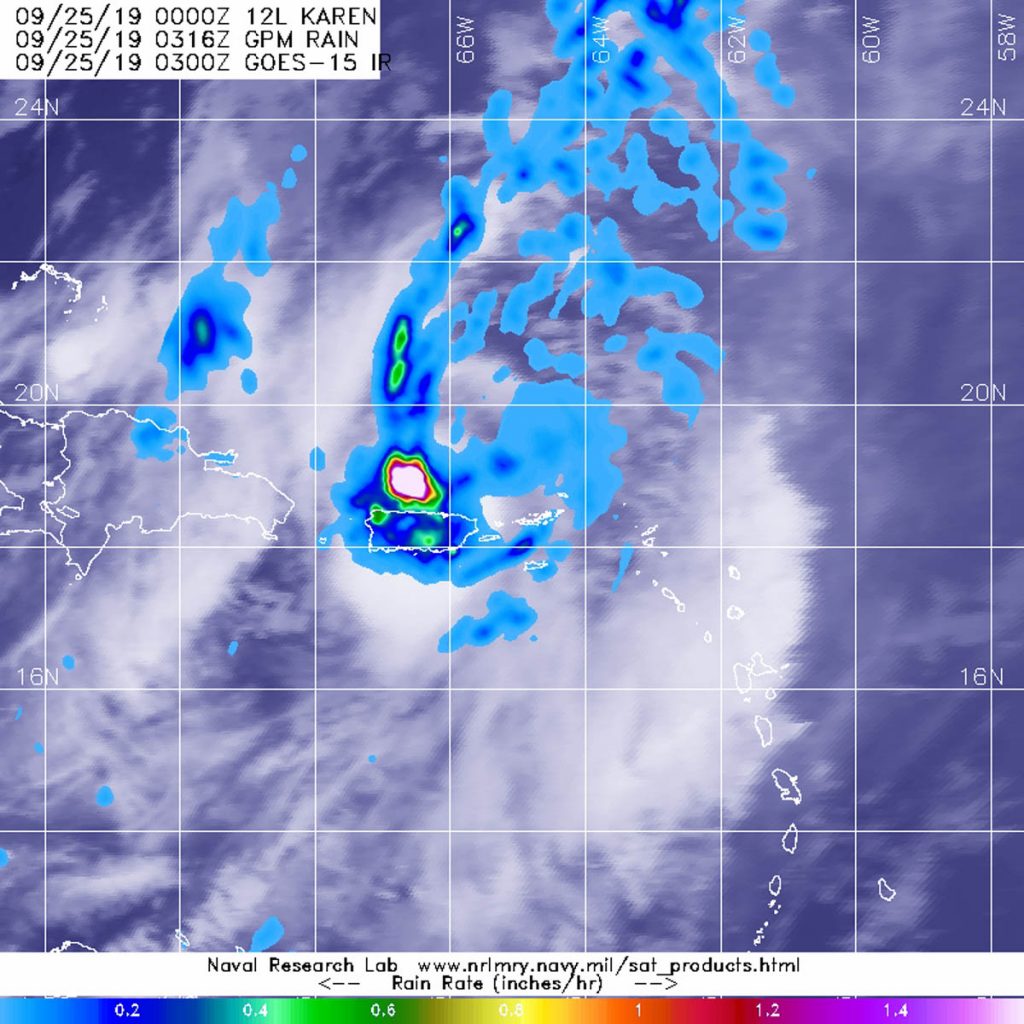
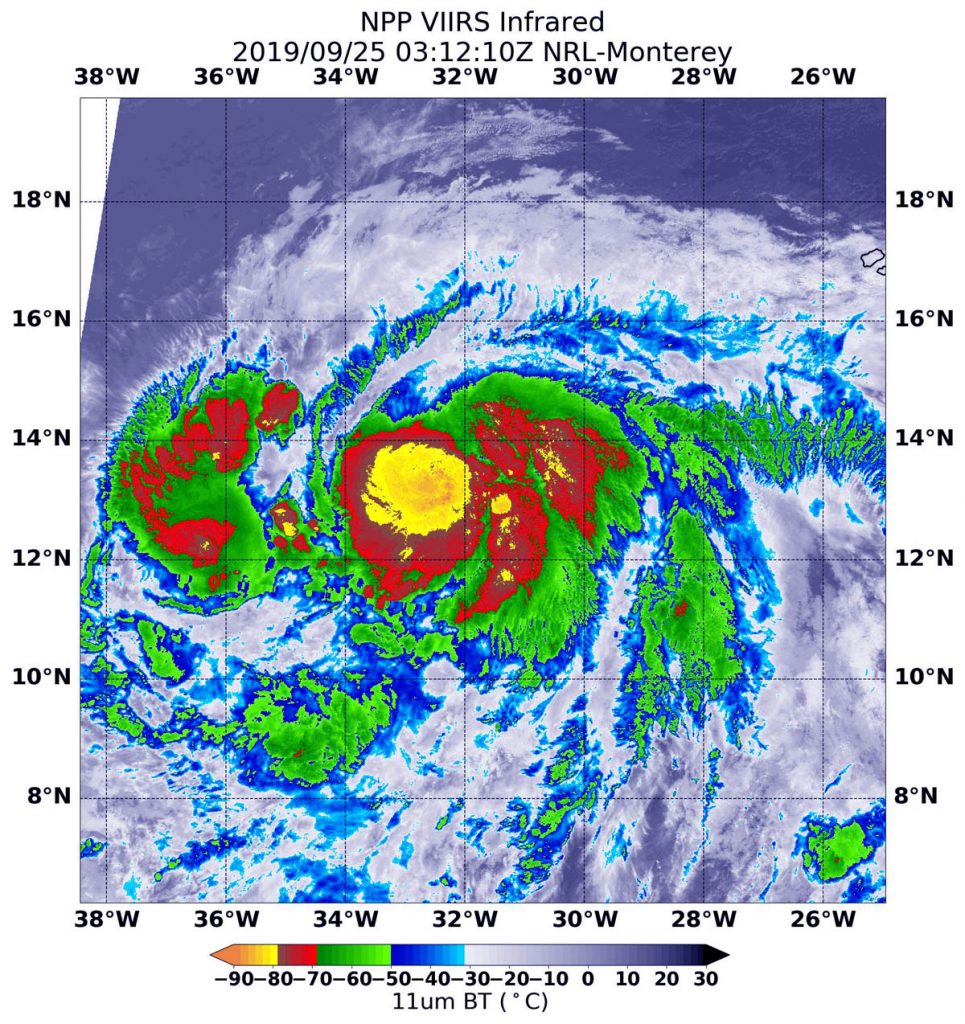
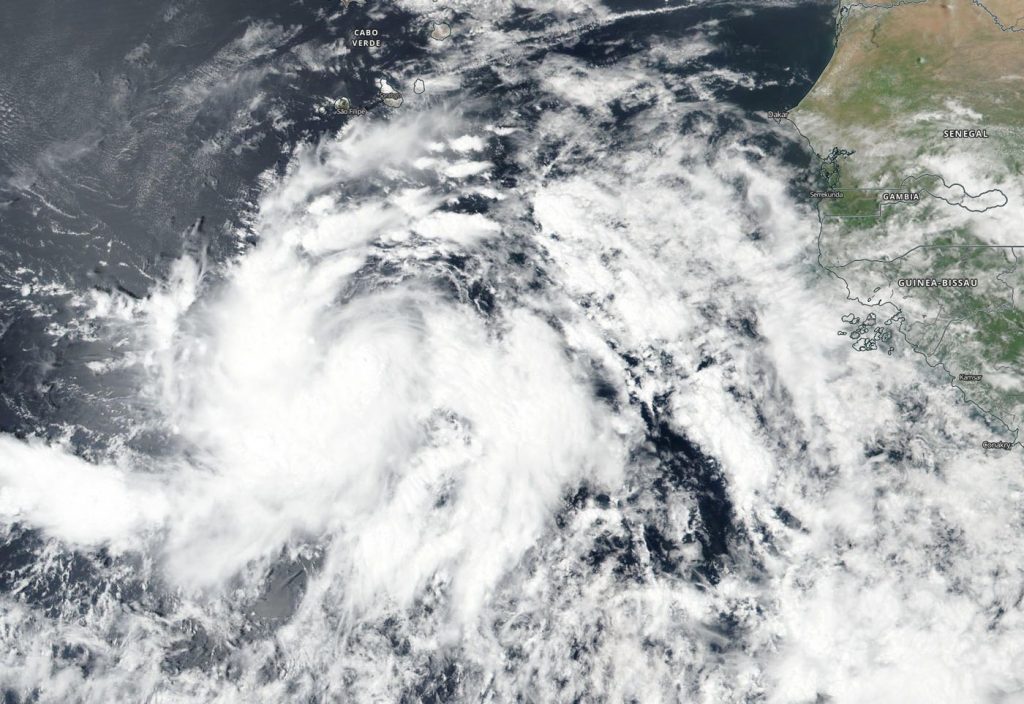
The Visible Infrared Imaging Radiometer Suite (VIIRS) instrument aboard Suomi NPP provided a visible image of the storm on Sept. 25. The VIIRS image showed powerful thunderstorms circling the center of Lorenzo with thick bands of thunderstorms wrapping into the low-level center from the south and east of center. The satellite imagery revealed that Lorenzo was getting better organized as it was strengthening. By 11 p.m. EDT, infrared imagery showed a small eye had been appearing intermittently.
The shape of the storm is a clue to forecasters that a storm is either strengthening or weakening. If a storm takes on a more rounded shape it is getting more organized and strengthening. Conversely, if it becomes less rounded or elongated, it is a sign the storm is weakening.
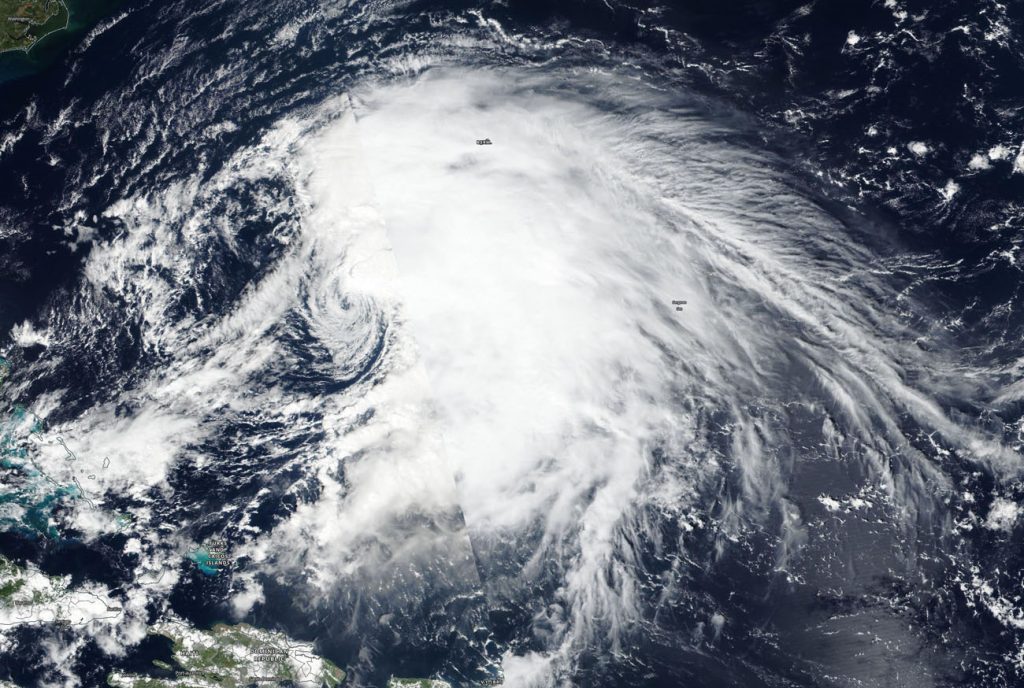
On Sept. 26, shortly after 5 a.m. EDT (0900 UTC), the National Hurricane Center (NHC) said Lorenzo’s eye quickly and drastically became more apparent in conventional satellite imagery. The slightly ragged but clearing eye of the hurricane is surrounded by very cold cloud tops, and it has become clear that Lorenzo is rapidly intensifying.
By 6 a.m. EDT (1000 UTC), the center of Hurricane Lorenzo had maximum sustained winds have rapidly increased to near 125 mph (205 kph) with higher gusts. Lorenzo is a category 3 hurricane on the Saffir-Simpson Hurricane Wind Scale.
Lorenzo was located near latitude 15.2 degrees north and longitude 39.3 degrees west. That puts Lorenzo’s eye about 995 miles (1,600 km) west of the southernmost Cabo Verde Islands.
The hurricane is moving toward the west-northwest near 15 mph (24 kph). Lorenzo is forecast to turn toward the northwest and begin moving at a slightly slower speed later today. A turn toward the north is then anticipated on Saturday, Sept. 28.
Additional strengthening is possible today. Hurricane-force winds extend outward up to 35 miles (55 km) from the center and tropical-storm-force winds extend outward up to 205 miles (335 km). The estimated minimum central pressure is 955 millibars.
Hurricanes are the most powerful weather event on Earth. NASA’s expertise in space and scientific exploration contributes to essential services provided to the American people by other federal agencies, such as hurricane weather forecasting.
For updated forecasts. visit: www.nhc.noaa.gov