Fernand (was TD7) – Atlantic Ocean/Gulf of Mexico

Sep. 04, 2019 – NASA Analyzed Tropical Storm Fernand’s Strength Before Landfall

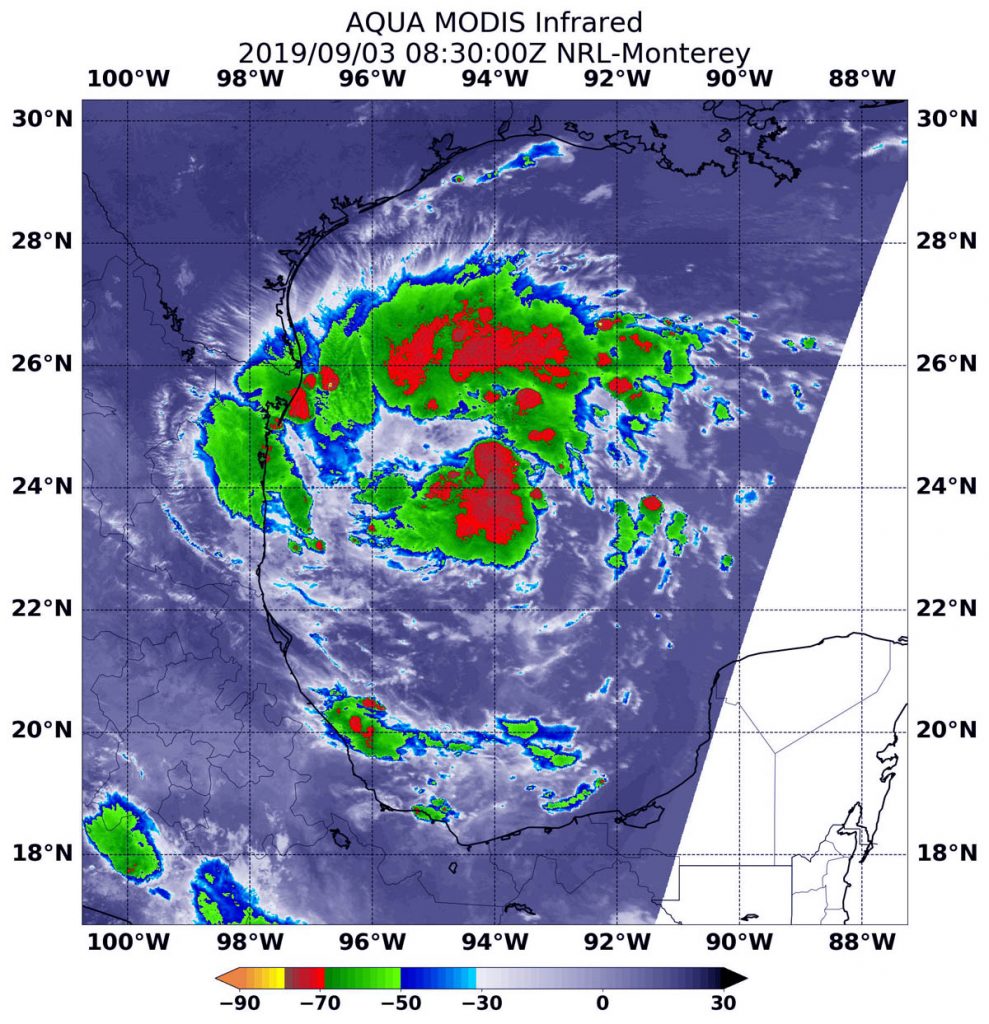
NASA’s Aqua satellite provided forecasters at the National Hurricane Center with infrared data and cloud top temperature information for Tropical Storm Fernand as it was making landfall in northeastern Mexico. Those temperatures indicated Fernand’s rainmaking capabilities. The infrared data also showed wind shear was affecting the storm.

AIRS image of Fernand
On Sept. 3, at 5:23 a.m. EDT (0923 UTC) the AIRS instrument aboard NASA’s Aqua satellite analyzed cloud top temperatures of Tropical Storm Fernand in infrared light. AIRS found coldest cloud top temperatures (purple) of strongest thunderstorms were as cold as or colder than minus 63 degrees Fahrenheit (minus 53 degrees Celsius) around the center and in a thick band of thunderstorms over northeastern Mexico. Credit: NASA JPL/Heidar Thrastarson

NASA researches tropical cyclones and infrared data is one of the ways NASA uses. Cloud top temperatures provide information to forecasters about where the strongest storms are located within a tropical cyclone. The stronger the storms, the higher they extend into the troposphere, and they have the colder cloud temperatures.

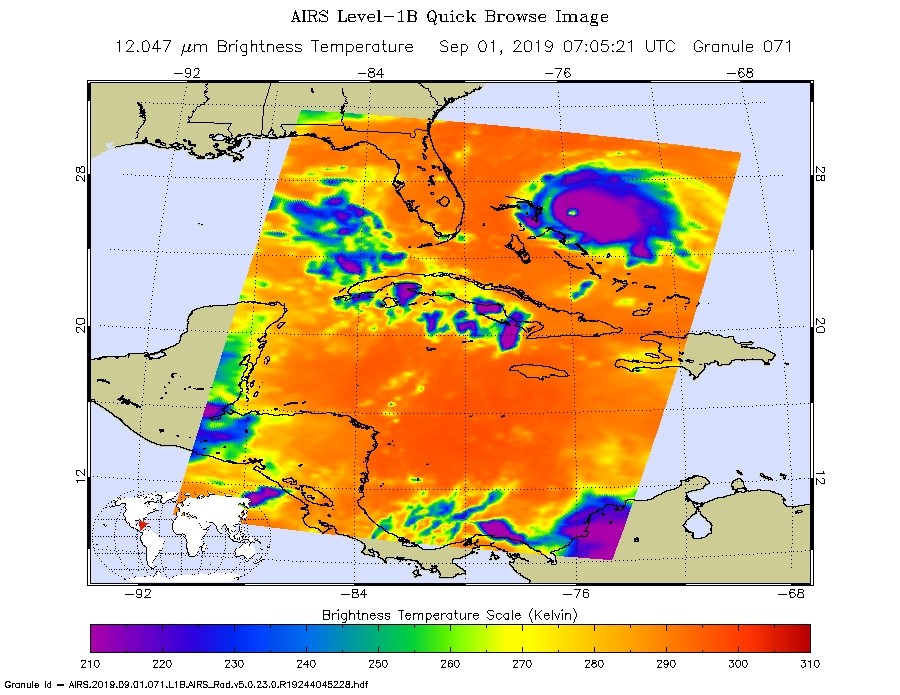
NASA’s Aqua satellite analyzed the storm on Sept. 3, at 5:23 a.m. EDT (0923 UTC) using the Atmospheric Infrared Sounder or AIRS instrument. AIRS found coldest cloud top temperatures as cold as or colder than minus 63 degrees Fahrenheit (minus 53 degrees Celsius) around the center and in a thick band of thunderstorms over northeastern Mexico. NASA research has shown that cloud top temperatures that cold indicate strong storms that have the capability to create heavy rain.

That heavy rainfall potential is apparent in the warnings posted today. In northeastern Mexico, from Tamaulipas and Central/Southern Nuevo Leon, 6 to 12 inches of rain are possible with isolated 18 inches, highest along the immediate Gulf Coast and in the Sierra Madre Oriental.  This rainfall may cause life-threatening flash floods and mudslides. Areas from Northern Nuevo Leon and Southern Coahuila can expect 3 to 6 inches. The south Texas and the lower Texas coast can also expect 2 to 4 inches, with isolated totals to 6 inches. In addition, a tornado or two are possible across far South Texas through this evening.

On Sept. 3, NOAA’s National Hurricane Center’s (NHC) discussion indicated that Fernand has been experiencing moderate easterly to southeasterly vertical wind shear and ingesting dry air in the southeastern semicircle. In general, wind shear is a measure of how the speed and direction of winds change with altitude.

That wind shear was indicated in the AIRS infrared imagery because the southeastern quadrant of Fernand appeared devoid of clouds. That’s an indication that outside winds from the east-southeast were pushing clouds and showers to the west-northwest of the center, where the AIRS imagery showed the bulk of clouds.

On Wednesday, September 4, 2019, a Tropical Storm Warning was in effect from Puerto Altamira to the Mouth of the Rio Grande River.

NHC noted at 8 a.m. EDT (1200 UTC), the center of Tropical Storm Fernand was located near latitude 23.5 North, longitude 97.2 West. Fernand is moving toward the west near 6 mph (9 kph). That puts the center of Fernand about 45 miles (70 km) southeast of La Pesca, Mexico. Maximum sustained winds are near 50 mph (85 kph) with higher gusts. Little change in strength is expected before the center moves onshore. The estimated minimum central pressure is 1000 millibars.

NHC said, “A motion toward the west or west-northwest is expected today, and the center of Fernand is forecast to cross the northeastern coast of Mexico later today or this evening. The cyclone is forecast to move inland over northeastern Mexico by this evening, and then dissipate quickly over the rugged terrain of the Sierra Madre Oriental mountains.”

For updated forecasts, visit: www.nhc.noaa.gov

For updated warnings from the Mexican Meteorological Service, visit: https://smn.conagua.gob.mx/es/

By Rob Gutro
NASA’s Goddard Space Flight Center  

14W – Northwestern Pacific Ocean

Sep. 03, 2019 – NASA Finds Tropical Storm 14W Strengthening

Tropical Storm 14W formed as a depression a couple of days ago in the Northwestern Pacific Ocean and strengthened into a tropical storm on Sept. 2. Infrared data from NASA’s Aqua satellite shows some powerful thunderstorms fueling further intensification.

Aqua image of 14W
On Sept. 3 at 1:05 p.m. EDT (1505 UTC), the MODIS instrument that flies aboard NASA’s Aqua satellite showed strong storms (yellow) around 14W’s center where cloud top temperatures were as cold as minus 80 degrees Fahrenheit (minus 62.2 Celsius). Credit: NASA/NRL

On Sept. 3 at 1:05 p.m. EDT (1505 UTC), the Moderate Imaging Spectroradiometer or MODIS instrument that flies aboard NASA’s Aqua satellite used infrared light to analyze the strength of storms within the 14W. NASA researches these storms to determine how they rapidly intensify, develop and behave. In the data obtained about 14W, the very strong storms found near the center indicate the storm is strengthening.

Tropical cyclones are made of up hundreds of thunderstorms, and infrared data can show where the strongest storms are located. They can do that because infrared data provides temperature information, and the strongest thunderstorms that reach highest into the atmosphere have the coldest cloud top temperatures.

MODIS found those strongest storms were around the center of circulation where cloud top temperatures were as cold as minus 80 degrees Fahrenheit (minus 62.2 Celsius). NASA research has found that cloud top temperatures that cold indicate strong storms with the potential to generate heavy rainfall.

The Joint Typhoon Warning Center (JTWC) noted that, animated enhanced infrared satellite imagery shows that the low-level circulation center of the storm is exposed to outside winds, and that the strongest thunderstorms are being pushed to the eastern side of the storm, because of westerly winds. A microwave image at 6:47 a.m. EDT (1047 UTC) indicates tightly curved shallow banding of thunderstorms wrapping into the center with an isolated area of strong storms over the southeastern quadrant.

On Sept. 3 at 11 a.m. EDT (1500 UTC), Tropical Storm 14W had maximum sustained winds near 35 knots (40 mph/65 mph). 14W is far from land areas and is about 1,566 nautical miles southeast of Yokosuka, Japan. 14W is moving to the west.

JTWC said 14W will move west-northwest across the Pacific Ocean. The JTWC expects the system will gradually intensify to 90 knots after five days and move toward Japan.

By Rob Gutro
NASA’s Goddard Space Flight Center

Kajiki – Northwestern Pacific Ocean

Sep. 03, 2019 – GPM Analyzes Tropical Depression Kajiki’s Rainfall Over Vietnam and Laos

The Global Precipitation Measurement mission or GPM core satellite provided a look at rainfall rates in Tropical Depression Kajiki after it made a quick landfall in Vietnam.

GPM image of Kajiki
The GPM core satellite passed over Tropical Depression Kajiki in the South China Sea on Sept. 4 at 4:51 a.m. EDT (0851 UTC). GPM found the heaviest rainfall (yellow) in areas over central Vietnam and Laos, where it was falling at a rate of 20 mm (about 0.8 inch) per hour. Lighter rainfall rates (blue) around those areas was between 0.2 and 0.4 inches (5 and 10 mm) per hour. Light rain was also falling over Hainan Island, China (blue). The GPM rain data was overlaid on Japan’s Himawari-8 satellite visible imagery of clouds. Credit: NASA/JAXA/NRL

On Sept. 2, Kajiki formed as Tropical Depression 16W in the South China Sea close to the Vietnam coast. It briefly strengthened to a tropical storm and was renamed Kajiki before weakening back to depression status.

The GPM satellite passed over the South China Sea and analyzed the rain rates throughout the storm on Sept. 3 at 4:51 a.m. EDT (0851 UTC). GPM found the heaviest rainfall in areas over central Vietnam and Laos, where it was falling at a rate of 20 mm (about 0.8 inch) per hour. Lighter rainfall rates around those areas was between 0.2 and 0.4 inches (5 and 10 mm) per hour. Light rain was also falling over Hainan Island, China. GPM is a joint mission between NASA and the Japan Aerospace Exploration Agency, JAXA. NASA researches tropical cyclones and provides data to international partners to use in their forecasting.

At 11 a.m. EDT (1500 UTC), Tropical Depression Kajiki had maximum sustained winds near 30 knots (34.5 mph/55.5 kph). It was centered near 16.3 degrees north latitude and 107.4 degrees east longitude, about 55 nautical miles west-northwest of Da Nang, Vietnam.

The Joint Typhoon Warning Center noted that Kajiki made landfall into Vietnam, but will move back out over water. The system is forecast to dissipate within a day or so.

By Rob Gutro
NASA’s Goddard Space Flight Center

Lingling – Northwestern Pacific Ocean

Sep. 03, 2019 – NASA Infrared Eye Analyzes Typhoon Lingling   

The storm that became Typhoon Lingling strengthened very quickly in the Northwestern Pacific Ocean and infrared imagery from NASA revealed the powerful thunderstorms fueling that intensification.

Terra image of Lingling
On Sept. 3 at 12:05 p.m. EDT (1405 UTC) the MODIS instrument that flies aboard NASA’s Terra satellite showed areas northeast and southeast of Typhoon Lingling’s center where cloud top temperatures were as cold as minus 80 degrees Fahrenheit (minus 62.2 Celsius). Credit: NASA/NRL

Lingling formed on Sept. 2 as Tropical Depression 15W and strengthened quickly into a tropical storm and then a typhoon.  Although Lingling is to the northeast of Luzon, northern Philippines, there are still some warning signals in effect on Sept. 3. Tropical cyclone wind signal #1 is in effect over the Luzon province of Batanes.

On Sept. 3 at 12:05 p.m. EDT (1405 UTC), the Moderate Imaging Spectroradiometer or MODIS instrument that flies aboard NASA’s Terra satellite used infrared light to analyze the strength of storms within the typhoon. NASA researches these storms to determine how they rapidly intensify, develop and behave.

Tropical cyclones are made of up hundreds of thunderstorms, and infrared data can show where the strongest storms are located. They can do that because infrared data provides temperature information, and the strongest thunderstorms that reach highest into the atmosphere have the coldest cloud top temperatures.

MODIS found those strongest storms were northeast and southeast of the center of circulation where cloud top temperatures were as cold as minus 80 degrees Fahrenheit (minus 62.2 Celsius). NASA research has found that cloud top temperatures that cold indicate strong storms with the potential to generate heavy rainfall.

At 11 a.m. EDT (1500 UTC), the Joint Typhoon Warning Center or JTWC said that Typhoon Lingling, known locally in the Philippines as Liwayway was located near 21.4 degrees north latitude and 124.2 degrees east longitude. That is 364 nautical miles southwest of Kadena Air Base, Okinawa, Japan. Lingling was moving to the north and had maximum sustained winds near 65 knots (75 mph/120.3 kph).

JTWC forecasters said that Lingling is moving north and is expected to intensify to 100 knots (115 mph/185 kph) upon passing east of Taiwan. The system will then weaken on approach to the Korean peninsula, but still be at typhoon strength.

By Rob Gutro
NASA’s Goddard Space Flight Center

Juliette – Eastern Pacific Ocean

Sep. 03, 2019 – Major Hurricane Juliette’s Emerging Eye Spotted in NASA Satellite Imagery

NASA’s Aqua satellite passed over the Eastern Pacific Ocean and provided an image of Hurricane Juliette as its eye began to emerge. Juliette has grown into a major hurricane, about 450 miles southwest of the southern tip of Baja California, Mexico.

Aqua image of Juliette
On Sept. 2, 2019 at 4:25 p.m. EDT (2025 UTC) the MODIS instrument aboard NASA’s Aqua satellite provided a visible image of Hurricane Juliette in the Eastern Pacific Ocean as its eye began to show. Credit: NASA/NRL

Juliette developed on Sunday, Sept 1 around 5 a.m. EDT (0900 UTC) as a tropical storm. By 5 p.m. EDT on Sept. 2, the storm had strengthened into a hurricane.

On Sept. 2, 2019 at 4:25 p.m. EDT (2025 UTC) the Moderate Resolution Imaging Spectroradiometer or MODIS instrument aboard NASA’s Aqua satellite provided a visible image of Hurricane Juliette that revealed its emerging eye around a thick tight circle of powerful thunderstorms. Hurricane-force winds extend outward up to 35 miles (55 km) from the center and tropical-storm-force winds extend outward up to 125 miles (205 km).

NASA researches hurricanes to better understand their behavior, and provides data to forecasters at NOAA’s NHC or National Hurricane Center to assist in their forecasting.

On Sept. 3 at 11 a.m. EDT (1500 UTC), NOAA’s National Hurricane Center said the eye of Hurricane Juliette was located near latitude 18.4 degrees north and longitude 115.0 degrees west. That’s about 455 miles (730 km) southwest of the southern tip of Baja California, Mexico. Juliette is moving toward the northwest near 8 mph (13 kph), and a northwest to west-northwest motion is expected through Friday. Maximum sustained winds have increased to near 125 mph (205 kph) with higher gusts.  Juliette is a category 3 hurricane on the Saffir-Simpson Hurricane Wind Scale. The estimated minimum central pressure is 953 millibars based on satellite estimates and data from the Mexican Navy station on Clarion Island.

NHC said. “Some strengthening is possible today, with weakening forecast to begin by late Wednesday and continuing through Friday.”

For updated forecasts, visit NOAA’s NHC: www.nhc.noaa.gov

By Rob Gutro
NASA’s Goddard Space Flight Center

TD7 – Atlantic Ocean

Sep. 03, 2019 – NASA Infrared Data Reveals Rainmaking Potential in Tropical Depression 7

 Another Atlantic Ocean basin depression formed while Hurricane Dorian is still wreaking havoc on the Bahamas and affecting the southeastern U.S. Infrared imagery from NASA’s Aqua satellite shows that Tropical Depression 7 in the western Gulf of Mexico has developed powerful thunderstorms with heavy rain capabilities. That potential for heavy rainfall includes southern Texas and northeastern Mexico.

MODIS image of TD7
On Sept. 3 at 4:30 a.m. EDT (0830 UTC) the MODIS instrument that flies aboard NASA’s Aqua satellite showed strongest storms (red) in fragmented thunderstorms around the center of Tropical Depression 7 in the western Gulf of Mexico. There, cloud top temperatures were as cold as minus 70 degrees Fahrenheit (minus 56.6 Celsius). Credit: NASA/NRL

NASA conducts research on tropical cyclones and provides various data to forecasters at NOAA’s National Hurricane Center (NHC) to consider in their forecasts.

NASA’s Aqua satellite used infrared light to analyze the strength of storms in Tropical Depression 7 and found strongest storms in fragmented bands of thunderstorms north and south of the center. The westernmost extent of those strong storms were already affecting the extreme northeastern coast of Mexico. Infrared data provides temperature information, and the strongest thunderstorms that reach high into the atmosphere have the coldest cloud top temperatures.

On Sept. 3 at 4:30 a.m. EDT (0830 UTC) the Moderate Imaging Spectroradiometer or MODIS instrument that flies aboard NASA’s Aqua satellite found strongest thunderstorms had cloud top temperatures as cold as minus 70 degrees Fahrenheit (minus 56.6 Celsius). Cloud top temperatures that cold indicate strong storms with the potential to generate heavy rainfall.

The NHC said the system is expected to produce the following rainfall totals through Friday:

In northeastern Mexico, 6 to 12 inches of rainfall is possible with isolated totals to 15 inches, highest in the Sierra Madre Oriental of Tamaulipas and Nuevo Leon. This rainfall may cause life-threatening mudslides and flash floods. In south Texas and the lower Texas Coast, 2 to 4 inches are possible with isolated amounts as high as 6 inches.

Tropical Depression 7 (TD7) formed around 5 a.m. EDT today, Sept. 3, 2019 and NHC posted a Tropical Storm Warning from La Pesca to Barra El Mezquital, Mexico.

NHC’s advisory at 11 a.m. EDT (1500 UTC) on Sept. 3 noted that the center of Tropical Depression Seven (TD7) was located near latitude 23.6 degrees north and longitude 94.9 degrees west.  The depression is moving toward the west near 7 mph (11 kph), and this motion is expected to continue today.

Maximum sustained winds are near 35 mph (55 km/h) with higher gusts. Slow strengthening is forecast before the system moves inland, and the depression is expected to become a tropical storm by Wednesday. The estimated minimum central pressure is 1004 millibars.

NHC forecasters said a motion toward the west-northwest is forecast tonight and Wednesday.  This motion could bring the system near or over the coast of northeastern Mexico late Wednesday.

For updated forecasts, visit: www.nhc.noaa.gov

By Rob Gutro
NASA’s Goddard Space Flight Center

Dorian – Atlantic Ocean

Sep. 03, 2019 – NASA’s IMERG Estimates Hurricane Dorian’s Rain

In the early hours of Tuesday, September 3, Hurricane Dorian had been stationary over the island of Grand Bahama for 18 hours, most of the time as a category 5 hurricane. Storm-total rain accumulation over parts of Grand Bahama and Abaco Islands have exceeded 24 inches according to NASA satellite-based estimates.

IMERG data on rainfall from Dorian
NASA’s IMERG storm-total rain accumulation over parts of Grand Bahama and Abaco islands have exceeded 24 inches according to NASA satellite-based estimates. The graphic also shows the distance that tropical-storm force (39 mph) winds extend from Hurricane Dorian’s low-pressure center, as reported by the National Hurricane Center. The symbols H and TS represent a hurricane of various Saffir-Simpson categories or a tropical storm, respectively. Image Credit: NASA Goddard

On early Tuesday morning, Dorian’s central pressure had risen and its wind intensity had dropped to category 4 on the Saffir-Simpson scale.  In addition, Dorian had experienced an eyewall replacement cycle on September 2, so by Tuesday morning Sept. 3, the geographic extent of its tropical-storm-force winds had expanded.

These rain estimates come from the NASA IMERG algorithm, which combines observations from a fleet of satellites, in near-realtime, to provide global estimates of precipitation every 30 minutes. The storm-total rainfall at a particular location varies with the forward speed of the hurricane, with the size of the hurricane’s wind field, and with how vigorous the updrafts are inside of the hurricane’s eyewall.

IMERG, or the Integrated Multi-satellitE Retrievals for GPM (IMERG) data product is generated by NASA’s Precipitation Processing System every half hour with a 6 hour latency from the time of data acquisition. It is produced using data from the satellites in the GPM or Global Precipitation Measurement mission constellation of satellites, and is calibrated with measurements from the GPM Core Observatory as well as rain gauge networks around the world.

IMERG is an example of the research role that NASA has in hurricanes  – developing observational tools and building computer models to better understand the behavior of tropical cyclones. NASA’s research data is utilized by NOAA’s National Hurricane Center (NHC) to enhance their forecasts.

On Tuesday, September 3, 2019, at 8 a.m. EDT (1200 UTC), NHC reported at the eye of Hurricane Dorian was located by reconnaissance aircraft and NOAA Doppler radar near latitude 27.1 degrees North and longitude 78.4 degrees West. NHC said Dorian is beginning to move northwestward at about 1 mph (2 kph), and a slightly faster motion toward the northwest or north-northwest is expected later today and tonight.

At present maximum sustained winds are near 120 mph (195 kph) with higher gusts.  Dorian is a category 3 hurricane on the Saffir-Simpson Hurricane Wind Scale.  Dorian is expected to remain a powerful hurricane during the next couple of days. Hurricane-force winds extend outward up to 45 miles (75 km) from the center, and tropical-storm-force winds extend outward up to 160 miles (260 km). The latest minimum central pressure reported by reconnaissance aircraft is 952 mb (28.11 inches).

NHC forecasts a turn toward the north by Wednesday evening, followed by a turn to the north-northeast Thursday morning.  On this track, the core of extremely dangerous Hurricane Dorian will gradually move north of Grand Bahama Island through this evening. The hurricane will then move dangerously close to the Florida east coast late today through Wednesday evening, very near the Georgia and South Carolina coasts Wednesday night and Thursday, and near or over the North Carolina coast late Thursday.

For updated forecasts, visit: www.nhc.noaa.gov

For more about NASA’s IMERG, visit: https://pmm.nasa.gov/gpm/imerg-global-image

By Owen Kelly / with NOAA’s NHC Update
NASA’s Goddard Space Flight Center

Dorian – Atlantic Ocean

Sep. 02, 2019 – Update #2  4:00 pm EDT – NASA Overhead as Dangerous Hurricane Dorian Takes Aim at Grand Bahamas

Dangerous Hurricane Dorian has weakened slightly and is now a Category 4 storm as it continues to spin over the Bahamas.  Dorian has slowed to a crawl in terms of speed of movement only moving at west-northwest at about 1 mph (2 km/h).  This means that the Bahamas will continue to get lashed by this monstrous storm and the amount of rainfall totals for the area continue to grow. The National Hurricane Center (NHC) has reported that the eye of the hurricane has begun to wobble a bit over Grand Bahama Island.  It is expected to stay over the island for much of the day causing extreme destruction.

Astronaut Christina Koch captured this image from the International Space Station earlier this morning.

Image of Dorian from ISS
Astronaut Christine Koch of the International Space Station captured this image of Hurricane Dorian outside the ISS windows the morning of Sep. 02, 2019. Credit: NASA

NOAA-20 observed Hurricane Dorian at 2:13 am EDT (0613 UTC) on the extreme western edge of the scan (image below). It provided an image of the classic presentation of a strong hurricane, with a nearly symmetrical circulation. Tropospheric gravity waves coming off the convection surrounding the central circulation could be seen in the infrared imagery. The Day Night Band imagery (second image below) showed the general structure of the storm with some lightning streaks. In addition, some possible mesospheric gravity waves seemed to be near the circulation center.

NOAA-20 image of Hurricane Dorian
NOAA-20 observed Hurricane Dorian at 2:13 am EDT (0613 UTC) on the extreme western edge of the scan. Credit: NASA/NOAA/UWM-SSEC-CIMSS/William Straka III
NOAA-20 day night band image of Dorian
The Day Night Band on the NOAA-20 satellite showed the general structure of the storm with some lightning streaks. In addition, some possible mesospheric gravity waves seemed to be near the circulation center. Also the lights from the capital city of Nassau could be seen scattering light through the clouds, which were relatively thinner as compared to areas nearer the eye of the storm. Credit: NASA/NOAA/UWM-SSEC-CIMSS/William Straka III

NOAA/NASA’s Suomi NPP satellite flew over Dorian about 50 minutes later at 3:03 am EDT (0703 UTC) and it had the most ideal position for observing the eye of Dorian (image below) . Suomi NPP’s infrared imagery showed the classic presentation of a strong hurricane, though slightly rotated. The lights from the capital city of Nassau could also be seen through the clouds.

Suomi NPP Image of Dorian
NOAA/NASA’s Suomi NPP satellite flew over Dorian about 50 minutes later at 3:03 am EDT (0703 UTC) and it had the most ideal position for observing the eye of Dorian. Suomi NPP’s infrared imagery showed the classic presentation of a strong hurricane, though slightly rotated. Credit: NASA/NOAA/UWM-SSEC-CIMSS/William Straka III
Suomi NPP image of Dorian
NASA NOAA’s Suomi NPP satellite image provided a very clear, very detailed image of Dorian’s eye in this image taken on Sep. 02, 2019 at 2:13 am EDT. Credit: NASA/NOAA/UWM-SSEC-CIMSS/William Straka III

The MiRS rain rate product (image below) on NASA NOAA’s Suomi NPP satellite also showed the rain wrapping into the circulation center.

Suomi NPP image of Dorian showing rainfall rates
The MiRS instrument on NASA NOAA’s Suomi-NPP satellite shows rainfall rates within the storm as well as showing the rain wrapping around the eye of the hurricane. Credit: NASA/NOAA/UWM-SSEC-CIMSS/William Straka III

As of the NHC’s update at Dorian is producing maximum sustained winds of 145 mph (230 km/h) with wind gusts of 190 mph (305 km/h).  The storm is located latitude 26.8N and longitude 78.4W which is about 25 miles (40 km) northeast of Freeport, Grand Bahama Island and about 105 miles (170 km) east of West Palm Beach, FL. The minimum central pressure is 940 Mb.

For the latest information on Dorian, visit: https://www.nhc.noaa.gov

By Lynn Jenner
NASA Goddard Space Flight Center

Dorian – Atlantic Ocean

Sep. 02, 2019- Update #1 – 9:00am EDT – Destructive Dorian Lashing Grand Bahama Island

Hurricane Dorian is breaking records over the Bahamas as the most destructive hurricane to ever hit the Bahama Islands. Catastrophic winds with gusts over 200 mph are smashing through the islands leaving devastation in their wake. Storm surge of 18 to 23 feet above normal tide levels with higher destructive waves are expected throughout the storm’s passing.

On Dorian’s current track and speed of movement, the core of extremely dangerous Hurricane Dorian will continue to pound Grand Bahama Island through much of today and tonight. The hurricane will move dangerously close to the Florida east coast tonight through Wednesday evening.

NASA’s Global Precipitation Measurement mission (GPM) was on hand to measure the amount of rainfall that the Bahama Islands are experiencing now.

GPM imagea of Dorian
These rain estimates come from the NASA IMERG algorithm, which combines observations from a fleet of satellites, in near-realtime, to provide global estimates of precipitation every 30 minutes. The storm-total rainfall at a particular location varies with the forward speed of the hurricane, with the size of the hurricane’s wind field, and with how vigorous the updrafts are inside of the hurricane’s eyewall. The graphic also shows the distance that tropical-storm force (39 mph) winds extend from Hurricane Dorian’s low-pressure center, as reported by the National Hurricane Center. The geographic extent of the tropical-storm strength winds has expanded throughout Dorian’s lifetime. The symbols H and TS represent a hurricane of various Saffir-Simpson categories or a tropical storm, respectively. Visualization by NASA Goddard.

On Monday morning, September 2, Hurricane Dorian was over the island of Grand Bahama as a category 5 storm. As has been the case for the past several days, Dorian’s inner core continues to produce 6 to 14 inches of rain accumulation. Hurricane Dorian’s forward motion has slowed to walking pace, so future updates to this rain-accumulation map may show greater accumulation over Grand Bahama than elsewhere along the storm’s path.

AIRS image of Dorian
On Sep. 01, 2019, at 2:05 am EDT (0705 UTC) the Aqua satellite using the AIRS instrument analyzed temperatures within Hurricane Dorian. Cloud top temperatures within Dorian were as cold as or colder than minus 50 degrees Fahrenheit (minus 45.5 degrees Celsius). Infrared data provides temperature information, and the strongest thunderstorms that reach high into the atmosphere have the coldest cloud top temperatures. In this image, the amount of purple (coldest temperatures) surrounding the eye shows the huge and massive number of thunderstorms that continue to circle around the still very well-defined eye. Credit: NASA JPL/Heidar Thrastarson

NASA’s Aqua satellite captured this image of Dorian at 2:05 am EDT (0705 UTC) using its AIRS (Atmospheric Infrared Sounder) instrument analyzed temperatures within Hurricane Dorian. Cloud top temperatures within Dorian were as cold as or colder than minus 50 degrees Fahrenheit (minus 45.5 degrees Celsius). Infrared data provides temperature information, and the strongest thunderstorms that reach high into the atmosphere have the coldest cloud top temperatures. In this image, the amount of purple (coldest temperatures) surrounding the eye shows the huge and massive number of thunderstorms that continue to circle around the still very well-defined eye.

At present Dorian is located at latitude 26.7N and longitude 78.3W which is about 30 miles (50 km) east-northeast of Freeport, Grand Bahama Island and about 115 miles (185 km) east of West Palm Beach, FL.  Maximum sustained winds are now 165 mph (270 km/h) down from a high of 185 mph (298 km/h).  The present movement of storm is west at 1 mph (2 km/h) leaving the storm basically parked in location for hours. The minimum central pressure inside the storm is 916 mb.

For more updates on this storm, visit: https://www.nhc.noaa.gov

By Lynn Jenner
NASA Goddard Space Flight Center


Dorian – Atlantic Ocean

Sep. 01, 2019 – Update #3 – 3:00 pm – Devastating Category 5 Hurricane Dorian Makes a Direct Hit on Abaco Islands

The eye of Category 5  Hurricane Dorian was directly over the Abaco Islands as of the National Hurricane Center’s (NHC) 2:00 pm EDT advisory and is now heading towards Grand Bahama Island. The hurricane is located about 185 miles (295 km) east of West Palm Beach, FL. Maximum sustained winds are 185 mph (295 km/h) with gusts over 200 mph. Dorian is moving west at 7 mph.  The central pressure is 911 Mb which continues to lower meaning the storm continues to intensify. This is the fifth Category 5 hurricane sustained in the last five years.

Suomi NPP image of Dorian
Suomi NPP image of Hurricane Dorian showing its well-defined eye as it passed over Dorian at 3:20 am EDT (0720 UTC). Credit: NASA/NOAA/UWM-SSEC-CIMSS/William Straka III

NASA and NOAA satellites flew over the storm after the NHC’s 2:00 am EDT (0600Z) advisory each highlighting unique features within the storm. At 3:20 am EDT (0720 UTC) NASA’s Suomi NPP satellite caught Dorian (above) on the east side of the scan in the Day Night band but due to the angle did not yield as many features due to noise at the edge of the scan, however, the well-defined eye can still be seen along with the tropospheric convective gravity waves flowing away from the storm.

NOAA-20’s VIIRS instrument provides this image in its Day Night band of Hurricane Dorian at 2:30 am EDT on Sep. 01, 2019. Credit: NASA/NOAA/UWM-SSEC-CIMSS/William Straka III

A slower westward motion should continue for the next day or two, followed by a gradual turn toward the northwest. On this track, the core of
extremely dangerous Hurricane Dorian will continue to pound Great Abaco today and the move near or over Grand Bahama Island tonight and Monday. The hurricane should move closer to the Florida east coast late Monday through Tuesday night.

Hurricane-force winds extend outward up to 45 miles (75 km) from the center and tropical-storm-force winds extend outward up to 140 miles (220 km). The eye of the hurricane is now 25 nautical miles across.

For continuous coverage visit: https://www.nhc.noaa.gov

By Lynn Jenner
NASA Goddard Space Flight Center