Willa (Eastern Pacific Ocean)

Oct. 22, 2018 – Dangerous Hurricane Willa Probed By NASA and Japan’s GPM Satellite

Hurricane Willa is a major hurricane threatening western Mexico. Forecasters were able to see the rate of rainfall occurring within the powerful storm when the Global Precipitation Measurement mission or GPM’s core satellite passed overhead and provided that data.

GPM image of Willa
GPM passed above Willa on October 21, 2018 at 3:51 p.m. EDT (1951 UTC). The location of precipitation in Willa’s well defined eye wall was made evident by GPM’s radar (DPR Ku Band). DPR indicated that a few powerful convective storms within Willa were dropping rain at a rate of over 6.3 inches (160 mm) per hour. Credit: NASA/JAXA, Hal Pierce

On Oct. 22, the National Hurricane Center or NHC noted that “Will became a potentially catastrophic category 5 hurricane on the Saffir-Simpson hurricane wind scale and is expected to produce life-threatening storm surge, wind, and rainfall over portions of west-central and southwestern Mexico.”

Willa’s Rapid History

Willa formed on Saturday, Oct. 20 and quickly became a tropical storm. By 5 p.m. EDT, Willa strengthened into a major hurricane and continued to strengthen.

Hurricane Willa was a Category 4 hurricane and moving northward toward the western coast of Mexico when the GPM core observatory passed above on October 21, 2018 at 3:51 p.m. EDT (1951 UTC). At that time, the hurricane had maximum sustained winds of about 95 mph (109 knots).

GPM Satellite Provides Rainfall Rates

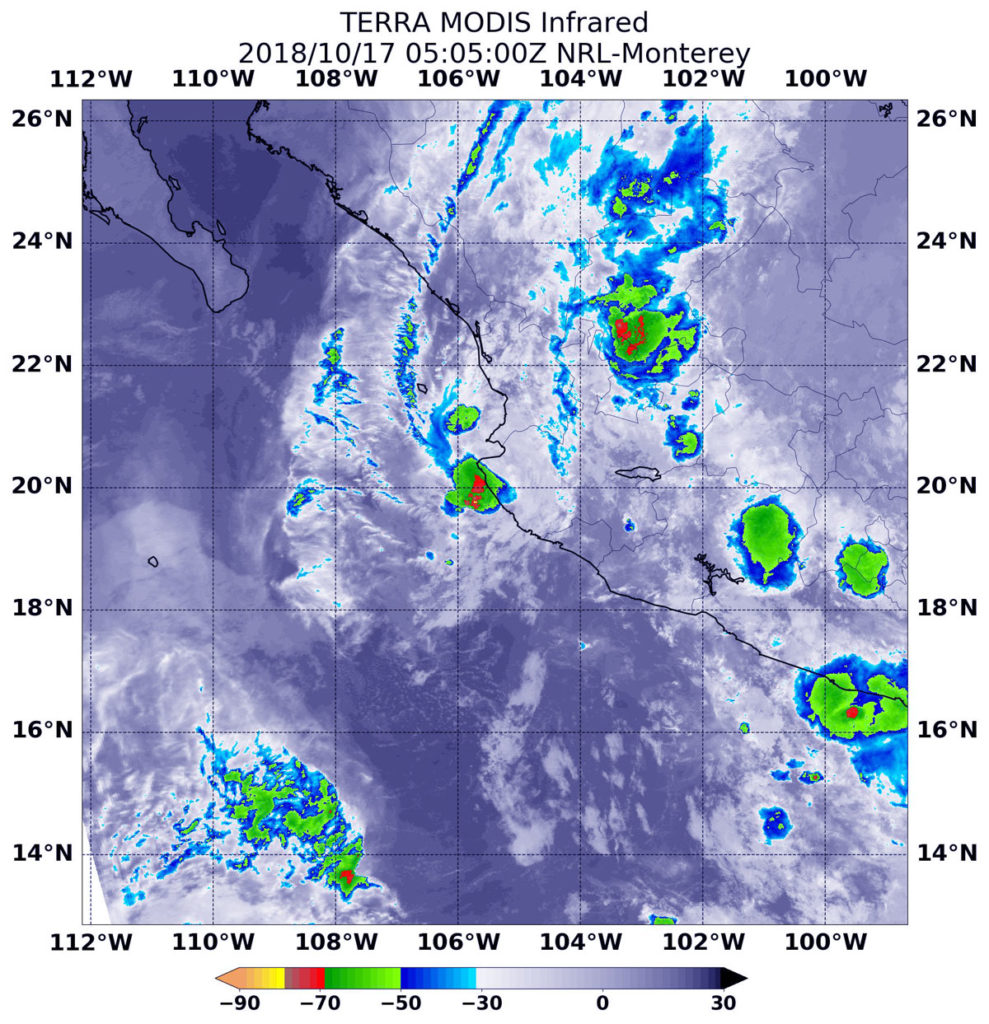
GPM’s Microwave Imager (GMI) and Dual-Frequency Precipitation Radar (DPR) instruments collected data showing that hurricane Willa and feeder bands were producing heavy rainfall over a large area. The location of precipitation in Willa’s well defined eye wall was made evident by GPM’s radar (DPR Ku Band). DPR indicated that a few powerful convective storms within Willa were dropping rain at a rate of over 6.3 inches (160 mm) per hour.

GPM 3-D image of Willa
GPM passed above Willa on October 21, 2018 at 3:51 p.m. EDT (1951 UTC). The location of precipitation in Willa’s well defined eye wall was made evident by GPM’s radar (DPR Ku Band). DPR indicated that a few powerful convective storms within Willa were dropping rain at a rate of over 6.3 inches (160 mm) per hour. GPM’s radar shows that a few powerful storms in the eye of the hurricane were reaching heights above 8.7 miles (14.0 km). Credit: NASA/JAXA, Hal Pierce

At NASA’s Goddard Space Flight Center in Greenbelt, Md. a simulated 3-D view was created of the storm looking from the south-southeast reveals hurricane Willa’s rainfall structure. It was developed using GPM’s radar data (DPR Ku Band). That DPR data enabled a cross-section view that shows the anatomy of precipitation around hurricane Willa’s eye. Intense radar echoes of up to 57dBZ are shown (dark red) in this slice through the center of the intensifying hurricane. GPM’s radar shows that a few powerful storms in the eye of the hurricane were reaching heights above 8.7 miles (14.0 km). These tall storms referred to as “hot towers” are often an indication of hurricane intensification. These powerful convective storms near the center of the hurricane were releasing energy in the form of latent heat of condensation that powers the hurricane.

GPM is a joint mission between NASA and JAXA, the Japan Aerospace Exploration Agency.

Willa’s Expected Rainfall

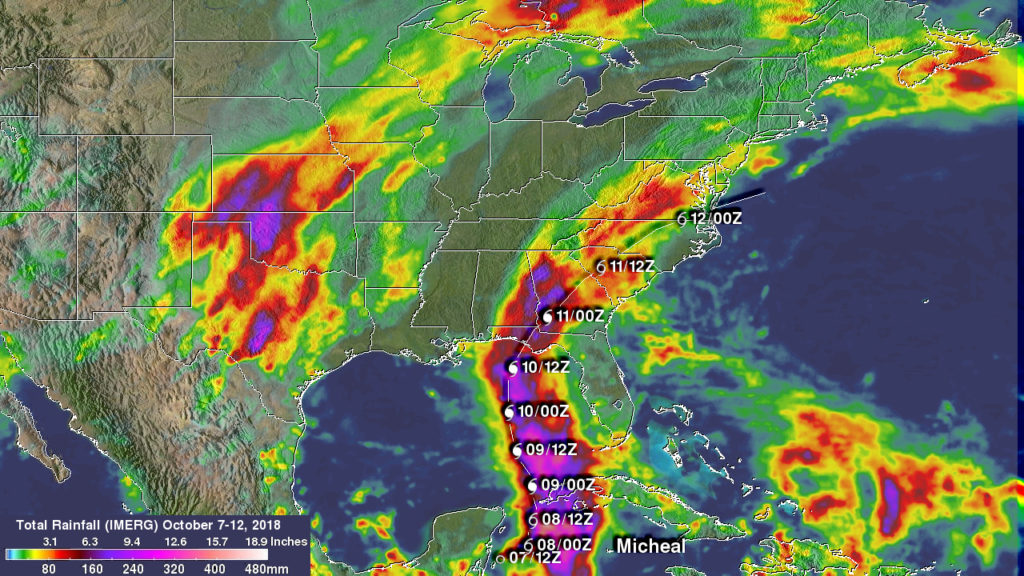
The National Hurricane Center said “Willa is expected to produce storm total rainfall accumulations of 6 to 12 inches, with local amounts to 18 inches, across portions of western Jalisco, western Nayarit, and southern Sinaloa in Mexico.  This rainfall will cause life-threatening flash flooding and landslides. Farther inland, Willa is expected to produce rainfall amount of 2 to 4 inches across portions of Zacateca, Durango, southeast Chihuahua, and Coahuila in Mexico, with local amounts to 6 inches possible. This rainfall could cause life-threatening flash flooding.”

Warnings and Watches in Effect on Oct. 22

A Hurricane Warning is in effect for San Blas to Mazatlan, including Las Islas Marias. A Tropical Storm Warning is in effect for Playa Perula to San Blas and north of Mazatlan to Bahia Tempehuaya.


GPM passed above Willa on October 21, 2018 at 3:51 p.m. EDT (1951 UTC). The location of precipitation in Willa’s well defined eye wall was made evident by GPM’s radar (DPR Ku Band). DPR indicated that a few powerful convective storms within Willa were dropping rain at a rate of over 6.3 inches (160 mm) per hour. GPM’s radar shows that a few powerful storms in the eye of the hurricane were reaching heights above 8.7 miles (14.0 km).  Click to see 3-D flyby animation. Credit: NASA/JAXA, Hal Pierce

Status of Willa on Oct. 22

At 11 a.m. (1500 UTC) on Oct. 22 the center of Hurricane Willa was located near latitude 19.1 degrees north, longitude 107.2 degrees west.  About 175 miles (280 km) south-southwest of Las Islas Marias Mexico. Willa is moving toward the north near 7 mph (11 kph), and this general motion is expected to continue today.

Satellite data indicate that the maximum sustained winds have increased to near 160 mph (260 kph) with higher gusts.  Willa is a category 5 hurricane on the Saffir-Simpson Hurricane Wind Scale.

Some strengthening is still possible today.  Slight weakening is forecast to begin on Tuesday, but Willa is expected to be an extremely dangerous major hurricane when it reaches the coast of Mexico. Hurricane-force winds extend outward up to 30 miles (45 km) from the center and tropical-storm-force winds extend outward up to 105 miles (165 km).

The National Hurricane Center (NHC) predicts Willa to accelerate toward the north-northeast and move over or very near the Islas Marias early Tuesday and make landfall along the southwestern coast of mainland Mexico in the hurricane warning area Tuesday afternoon or evening.

For details on Storm Surge, Wind and Surf, visit: www.nhc.noaa.gov.

By Harold F. Pierce / Rob Gutro
NASA Goddard Space Flight Center

Yutu (Northwestern Pacific Ocean)

Oct. 22, 2018 – NASA Tracks Tropical Storm Yutu, Warnings Posted

NASA-NOAA’s Suomi NPP satellite passed over the Northwestern Pacific Ocean and captured a visible image of Tropical Storm Yutu as warnings were posted. A typhoon watch is in force for Tinian and Saipan and a tropical storm watch is in force for Rota.

Suomi NPP image of Yutu
On Oct. 21 NASA-NOAA’s Suomi NPP satellite captured a visible image of Tropical Storm Yutu, north of Papau New Guinea and east of Guam. Credit:  NASA Worldview, Earth Observing System Data and Information System (EOSDIS) /NOAA

The National Weather Service in Tiyan, Guam noted that residents of Guam, Alamagan, Pagan and Agrihan should continue to monitor the progress of Tropical Storm Yutu.

Tropical Depression 31 developed on Monday, Oct. 22 at 2 a.m. CHST (Guam local time) and rapidly intensified into a tropical storm.

On Oct. 22, the Visible Infrared Imaging Radiometer Suite (VIIRS) instrument aboard NASA-NOAA’s Suomi NPP satellite passed over Yutu and captured a visible image of the storm. VIIRS showed an organized storm with strong thunderstorms circling the center and in bands feeding into the center from the south and east.

At 1 a.m. CHST (local time) on Oct. 23 (11 a.m. EDT/1500 UTC on Oct. 22) the center of Tropical Storm Yutu was located near latitude 10.9 degrees north and longitude 153.3 degrees east. That’s about 255 miles north-northeast of Chuuk and about 585 miles east-southeast of Saipan.

Maximum sustained winds have increased to 50 mph. Yutu will continue to intensify through Wednesday, possibly becoming a typhoon later today. Tropical storm force winds extend outward from the center up to 80 miles to the southwest and up to 150 miles elsewhere.

Yutu is moving northwest at 16 mph and is expected to continue its northwest motion through Thursday, but the National Weather Service in Guam said its forward speed will decrease slightly today and tonight. This forecast keeps Yutu on a track that will pass just north of Saipan late Wednesday night or Thursday morning, Oct. 24 local time.

For updated forecasts, visit: http://www.prh.noaa.gov/guam/cyclone.php

By Rob Gutro
NASA’s Goddard Space Flight Center

Vicente (Eastern Pacific Ocean)

Oct. 22, 2018 – NASA Sees Tiny Tropical Storm Vicente Near Southwestern Mexico’s Coast

NASA-NOAA’s Suomi NPP satellite passed over the Eastern Pacific Ocean and captured a visible image of the small tropical storm named Vicente.

Suomi NPP image of Vincente
On Oct. 21 NASA-NOAA’s Suomi NPP satellite captured a visible image of Tropical Storm Vicente that showed it was a small storm. Credit: NASA Worldview, Earth Observing System Data and Information System (EOSDIS) /NOAA

Vicente developed on Friday, Oct. 19 as Tropical Depression Twenty-Three-E (TD 23E). TD23E formed about 85 miles (135 km) west-southwest of Puerto San Jose Guatemala and moved west-northwest while intensifying. Later in the day TD23E strengthened into a tropical storm and was renamed Vicente, but the storm was moving slowly. Because of the slow movement, heavy rains fell over portions of El Salvador, Guatemala and southeastern Mexico. Vicente then moved west

On. Oct. 21, the Visible Infrared Imaging Radiometer Suite (VIIRS) instrument aboard NASA-NOAA’s Suomi NPP satellite passed over Vicente and captured a visible image of the storm. VIIRS showed that the storm was small in diameter. Tropical-storm-force winds extend outward up to 45 miles (75 km) from the center. Vicente appeared less organized in the image than it did hours earlier.

On Oct. 22 at 11 a.m. EDT (1500 UTC) NOAA’s National Hurricane Center (NHC) in Miami, Fla. noted that the center of Tropical Storm Vicente was located near latitude 14.9 degrees north and longitude 100.8 degrees west.  Vicente is moving toward the west-northwest near 12 mph (19 kph) and a turn to the northwest is expected today followed by a turn to the north-northwest on Tuesday, Oct. 23. Maximum sustained winds are near 45 mph (75 kph) with higher gusts. Weakening is forecast, and Vicente is expected to become a tropical depression by tonight or Tuesday.

On Oct. 22 although there are no coastal watches or warnings in effect, the NHC cautioned that interests along the southern and southwestern coasts of Mexico should monitor the progress of Vicente. On the forecast track, the center of Vicente is expected to approach the southwestern coast of Mexico on Tuesday, Oct. 23. The cyclone’s circulation is expected to dissipate near the southwestern coast of Mexico by Wednesday, Oct. 24.

For updated forecasts, visit: www.nhc.noaa.gov

By Rob Gutro
NASA’s Goddard Space Flight Center

Tara (Eastern Pacific Ocean) 2018

Oct. 17, 2018 – NASA Catches the Scattered Remains of Former Tropical Storm Tara

NASA’s Aqua satellite captured an infrared image of the remnants of former Tropical Storm Tara after it dissipated near the coast of western Mexico’s Jalisco state.  Jalisco is a western Mexican state along the Eastern Pacific Ocean.

Aqua image of Tara
At 1:05 a.m. EDT (0505 UTC) on Oct. 17 NASA’s Aqua satellite gathered infrared data on the remnants of Tara. Infrared data provides temperature information. Strongest thunderstorms were found along the coast just south of Puerto Vallarta and scattered throughout Jalisco state. Those fragmented storms had cloud top temperatures as cold as (yellow) minus 63 degrees Fahrenheit (minus 53 Celsius). Credit: NASA/NRL

On Oct. 16 the high terrain of Mexico caused Tara’s surface circulation to open into a trough or elongated area of low pressure and dissipate.

At 11 p.m. EDT on Oct. 16 (0300 UTC on Oct 17) the National Hurricane Center or NHC noted the remnants of Tara were located near latitude 20.0 degrees north and longitude 105.5 degrees west. That’s 105 miles (170 km) northwest of Manzanillo, Mexico. Maximum sustained winds were near 35 mph (55 kph) and waning.

At that time, NHC’s discussion stated “The remnants of Tara are expected to produce additional rainfall of 1 to 3 inches over the Mexican states of Colima and western Jalisco, through tonight, with isolated maximum storm total amounts of 15 inches possible. These rains may produce life-threatening flash floods and mudslides, especially in mountainous terrain.”

At 1:05 a.m. EDT (0505 UTC) on Oct. 17, the MODIS instrument that flies aboard NASA’s Aqua satellite gathered infrared data on the remnants of Tara. Infrared data provides temperature information. Strongest thunderstorms were found along western Mexico’s coast just south of Puerto Vallarta and scattered throughout Jalisco state. Those fragmented storms had cloud top temperatures as cold as minus 63 degrees Fahrenheit (minus 53 Celsius). NASA research has shown that cloud tops with temperatures that cold were high in the troposphere and have the ability to generate heavy rain.

By Rob Gutro
NASA’s Goddard Space Flight Center

Tara (Eastern Pacific Ocean) 2018

Oct. 16, 2018 – Tropical Storm Tara’s Water Vapor Concentrations Seen by NASA’s Aqua Satellite

When NASA’s Aqua satellite passed over the Eastern Pacific Ocean on Oct. 16 the MODIS instrument aboard analyzed water vapor within Tropical Storm Tara.

Aqua image of Tara
NASA’s Aqua satellite passed over Tropical Storm Tara in the Eastern Pacific Ocean on Oct. 16 at 4:45 a.m. EDT (0845 UTC). The MODIS instrument showed highest concentrations of water vapor (brown) and coldest cloud top temperatures were around the center (over water) and north of the center over western Mexico. Credits: NASA/NRL

On Oct. 16, a Tropical Storm Warning is in effect from Manzanillo to Cabo Corrientes, Mexico and a Tropical Storm Watch is in effect from east of Manzanillo to Punta San Telmo, Mexico.

Water vapor analysis of tropical cyclones tells forecasters how much potential a storm has to develop and shows where the heaviest rainfall may be found. Water vapor releases latent heat as it condenses into liquid. That liquid becomes clouds and thunderstorms that make up a tropical cyclone. Temperature is important when trying to understand how strong storms can be. The higher the cloud tops, the colder and the stronger they are.

NASA’s Aqua satellite passed over Tropical Storm Tara on Oct. 16 at 4:45 a.m. EDT (0845 UTC) and the Moderate Resolution Imaging Spectroradiometer or MODIS instrument gathered water vapor content and temperature information. The MODIS image showed highest concentrations of water vapor and coldest cloud top temperatures circled the center and extended in areas over mainland Mexico to the north-northeast including the coast.

MODIS saw coldest cloud top temperatures were as cold as minus 70 degrees Fahrenheit (minus 56.6 degrees Celsius) in those areas. Storms with cloud top temperatures that cold have the capability to produce heavy rainfall. After Aqua passed by, locally heavy rainfall continued along the immediate coastal areas of western Mexico.

The National Hurricane Center or NHC said at 11 a.m. EDT (1500 UTC), the center of Tropical Storm Tara was located near latitude 18.6 degrees north and longitude 104.5 degrees west.

Tara is drifting toward the north-northwest near 1 mph (2 kph). A very slow northwestward motion is expected during the next day or so. Maximum sustained winds have decreased to near 45 mph (75 kph) with higher gusts.

On NHC’s forecast track, the center of Tara should pass very close to the coast of southwestern Mexico, or possibly move inland, today or Wednesday, Oct. 13. Gradual weakening is forecast as Tara’s circulation interacts with the mountains of southwestern Mexico, and the system is forecast to degenerate into a remnant low by Wednesday evening.

NHC forecaster Stewart noted in the 11 a.m. Discussion, “Regardless of the exact track or intensity of Tara or its remnants, heavy rainfall will continue to be a threat along the immediate coast of southwestern Mexico due to the system’s slow motion, and life-threatening flash flooding will be possible in mountainous areas.”

For updated forecasts, visit: www.nhc.noaa.gov.

By Rob Gutro
NASA’s Goddard Space Flight Center

Tara (Eastern Pacific Ocean) 2018

Oct. 15, 2018 – NASA Finds Tropical Storm Tara Affecting Western Mexico

NASA-NOAA’s Suomi NPP satellite found newly developed Tropical Storm Tara affecting the western coast of Mexico.

Suomi NPP image of Tara
NASA-NOAA’s Suomi NPP satellite passed over Tropical Storm Tara on Oct. 15 and the VIIRS instrument provided a visible image of the storm along the coast of coasts of Mexico’s Michoacan and Jalisco states. Credit: NASA Worldview, Earth Observing System Data and Information System (EOSDIS)

A Tropical Storm Watch is in effect for Punta San Telmo to Cabo Corrientes on Oct. 15.

Tara formed on Oct. 14 around 11 a.m. EDT. It was the twenty second tropical depression of the Eastern Pacific Hurricane Season. Suomi NPP passed over Tara on Oct. 14 and the Visible Infrared Imaging Radiometer Suite (VIIRS) instrument provided a visible image of the storm. The VIIRS image showed the eastern quadrant of the storm over the coasts of Mexico’s Michoacan and Jalisco states.

At 11 a.m. EDT (1500 UTC), the National Hurricane Center or NHC noted that the center of Tropical Storm Tara was located near latitude 17.6 degrees north and longitude 104.4 degrees west. That’s just 95 miles (155 km) south of Manzanillo, Mexico. Tara is moving toward the west-northwest near 1 mph (2 kph) and this slow motion is expected to continue for the next day or so. Maximum sustained winds have increased to near 45 mph (75 kph) with higher gusts. Slow strengthening is forecast during the next few days.

NHC said “On the forecast track, the center of Tara is expected to remain near or just offshore of the southwestern coast of Mexico during the next couple of days.”

By Rob Gutro
NASA’s Goddard Space Flight Center

Michael 2018

Oct. 15, 2018 – Hurricane Michael’s Heavy Rainfall Measured by NASA

Some casualties resulted not only from Michael’s destructive winds and storm surges but also from the blinding rain that Michael produced as it battered states from Florida northeastward through Virginia. NASA used satellite data to estimate how much rainfall occurred along Hurricane Michael’s track from Oct. 7 to Oct. 12, 2018.

GPM image of Michael
Hurricane Michael frequently produced rainfall totals greater than 10 inches (254 mm) along its track. IMERG data indicated that the heaviest rainfall accumulation occurred off the Yucatan where were over 20 inches (512 mm) were estimated. Michael’s approximate 0000Z and 1200Z (8 p.m. EDT and 8 a.m. EDT) locations are shown overlaid on this analysis. Credit: NASA/JAXA, Hal Pierce

On Friday, Oct. 12, Tropical Storm Michael moved out over the Atlantic Ocean and has transitioned into a powerful extratropical storm.

A rainfall accumulation analysis created at NASA’s Goddard Space Flight Center in Greenbelt, Md. was derived from NASA’s Integrated Multi-satellitE Retrievals data (IMERG). IMERG data were used to calculate estimates of precipitation totals from a combination of space-borne passive microwave sensors, including the GMI microwave sensor on the GPM or Global Precipitation Measurement mission satellite, and geostationary infrared data. IMERG data benefits from algorithms developed by NASA’s Precipitation Measurement Missions (PMM) science team that supports GPM’s Missions. GPM is a joint mission between NASA and the Japan Aerospace Exploration Agency, JAXA.

An analysis showed IMERG rainfall accumulation estimates along Michael’s track during the period from becoming a tropical depression fourteen off the coast of the Yucatan Peninsula on Oct. 7 until it passed off the U.S. East Coast on Oct. 12. IMERG rainfall accumulation data indicated that Michael frequently produced rainfall totals greater than 10 inches (254 mm) along its track. IMERG data indicated that the heaviest rainfall accumulation occurred off the Yucatan where were over 20 inches (512 mm) were estimated.

Also of interest is the heavy rainfall that fell in less than a week with stormy weather extending from Texas to the Great Lakes.

By Harold F. Pierce
NASA Goddard Space Flight Center

Luban (Northern Indian Ocean) 2018

Oct. 15, 2018 – NASA Finds Remnants of Tropical Cyclone Luban Near Yemen/Oman Border

Tropical Cyclone Luban made landfall in northern Yemen and imagery from NASA-NOAA’s Suomi NPP satellite confirmed that the low pressure area has continued to linger near the border of Yemen and Oman.

Suomi NPP image of Luban
On Oct. 15, NASA-NOAA’s Suomi NPP satellite passed over the Northern Indian Ocean and captured a visible image of the remnants of Tropical Cyclone Luban along the coast of Yemen and Oman. Credit: NASA Worldview, Earth Observing System Data and Information System (EOSDIS)/NOAA

On Oct. 14, Tropical Cyclone Luban made landfall in Yemen near the border with Oman. The storm made landfall between Mukalla and Al Ghaidahnear bringing heavy rainfall and causing flooding and power outages in the eastern city of Ghaida. According to the Oman Observer, the Salalah Airport reported 11mm rainfall while other areas reported much more. Sadah received 70.8 mm of rain and Dalkhout received 89.0 mm.

On Oct. 15, NASA-NOAA’s Suomi NPP satellite passed over the Northern Indian Ocean and the Visible Infrared Imaging Radiometer Suite (VIIRS) instrument provided a visible image the remnant clouds associated with former Tropical Cyclone Luban. Luban’s clouds lingered along the border or Yemen and Oman and into the Northern Indian Ocean.

The meteorological office in Yemen reported that seas would continue to be rough on Oct. 15.

By Rob Gutro
NASA’s Goddard Space Flight Center

Leslie (Eastern Atlantic Ocean) 2018

Oct. 15, 2018 – NASA Sees Remnants of Post-Tropical Cyclone Leslie Over Spain

Post-tropical cyclone Leslie made landfall in Portugal bringing heavy rains and hurricane-force winds. On Oct. 14, NASA-NOAA’s Suomi NPP satellite spotted the remnant clouds over northern Spain.

Suomi NPP image of Leslie
NASA-NOAA’s Suomi NPP satellite passed over Post-tropical Cyclone Leslie on Oct. 13 and the VIIRS instrument provided a visible image of the storm. The VIIRS image showed a disorganized low pressure area over the Iberian Peninsula, covering Portugal and Spain. Credit: NASA

Post-tropical cyclone Leslie made landfall at night on Oct. 13, local time. Leslie’s winds left 300,000 without power in Portugal and brought heavy rain. Lisbon, Leiria and Coimbra received the strongest winds.

Suomi NPP passed over Leslie on Oct. 13 and the Visible Infrared Imaging Radiometer Suite (VIIRS) instrument provided a visible image of the storm. The VIIRS image showed a disorganized low pressure area over the Iberian Peninsula, covering Portugal and Spain.

On Oct. 15, the remnants were bringing downpours to southern Spain and western Italy down to Sicily. The remnants continue to move east through the Mediterranean Sea.

By Rob Gutro
NASA’s Goddard Space Flight Center

Luban (Northern Indian Ocean) 2018

Oct. 12, 2018 – NASA Sees Tropical Cyclone Luban Nearing Oman

Tropical Cyclone Luban continued to track toward Oman as NASA-NOAA’s Suomi NPP satellite passed over the Northern Indian Ocean.

Suomi NPP image of Luban
NASA-NOAA’s Suomi NPP satellite passed over the Northern Indian Ocean and captured a visible image of Tropical Cyclone Luban nearing Oman’s coast on Oct. 11. Credit: NASA Worldview, Earth Observing System Data and Information System (EOSDIS)/NOAA

Suomi NPP passed over Luban on Oct. 11 and the Visible Infrared Imaging Radiometer Suite (VIIRS) instrument provided a visible image of the storm. The VIIRS image showed Luban stretched from the Gulf of Marisa south to Socotra Island. Luban had a symmetrical shape with a cloud-filled eye, surrounded by powerful thunderstorms.

At 11 a.m. EDT (1500 UTC), the center of Tropical Cyclone Luban was located near latitude 14.6 degrees north and longitude 56.8 degrees east. Luban was moving toward the west. Maximum sustained winds are near 52 mph (45 knots/83 kph) with higher gusts.

Luban is forecast to move north of Socotra Island and make landfall in Oman between Lukalla and Salalah on Oct. 14.

By Rob Gutro 
NASA’s Goddard Space Flight Center