Dorian – Atlantic Ocean

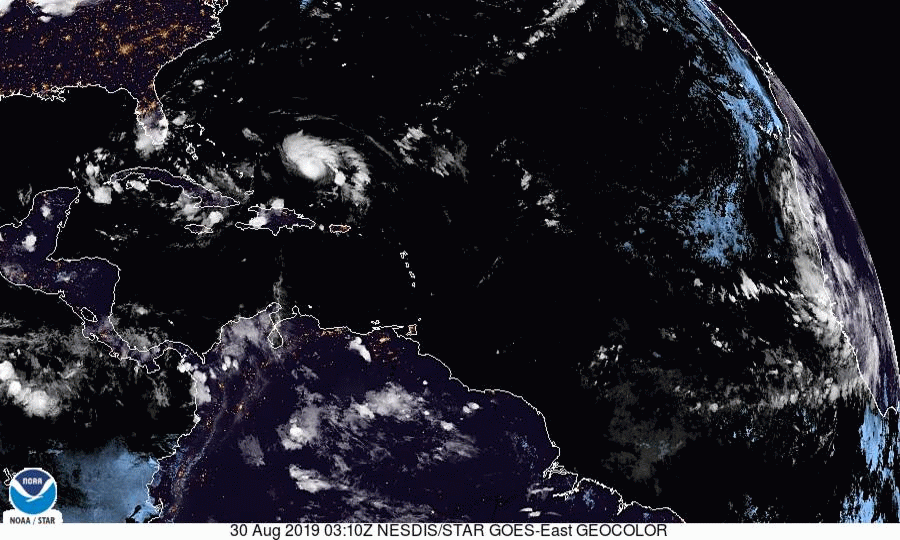
Aug. 30, 2019 – Update #2 – Hurricane Dorian Marching Slowly Across Atlantic

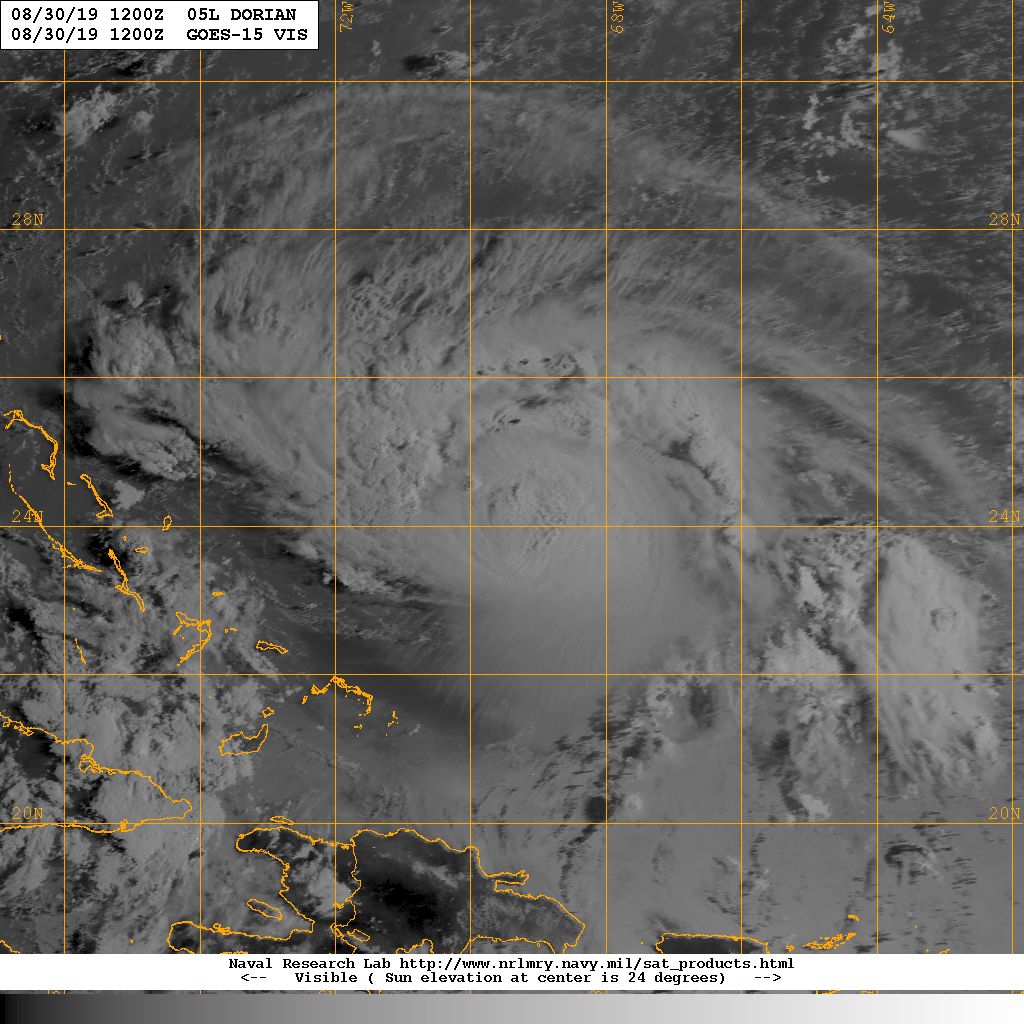
The National Hurricane Center (NHC) in Miami reports that an Air Force plane is finding Dorian a “little stronger” as of the 8:00am EDT advisory put out today, Aug. 30, 2019.  Data from an Air Force Reserve reconnaissance aircraft indicate that maximum sustained winds have increased to near 110 mph (175 km/h) with higher gusts. That is in keeping with what weather forecasters are predicting for the storm.

AIRS image of Dorian from 8/30/19.
On Aug. 29 at 1:29 p.m. EDT (1729 UTC), the AIRS instrument aboard NASA’s Aqua satellite analyzed cloud top temperatures of Tropical Storm Dorian in infrared light. AIRS found coldest cloud top temperatures (purple) of strongest thunderstorms were as cold as or colder than minus 63 degrees Fahrenheit (minus 53 degrees Celsius). Credit: NASA JPL/Heidar Thrastarson

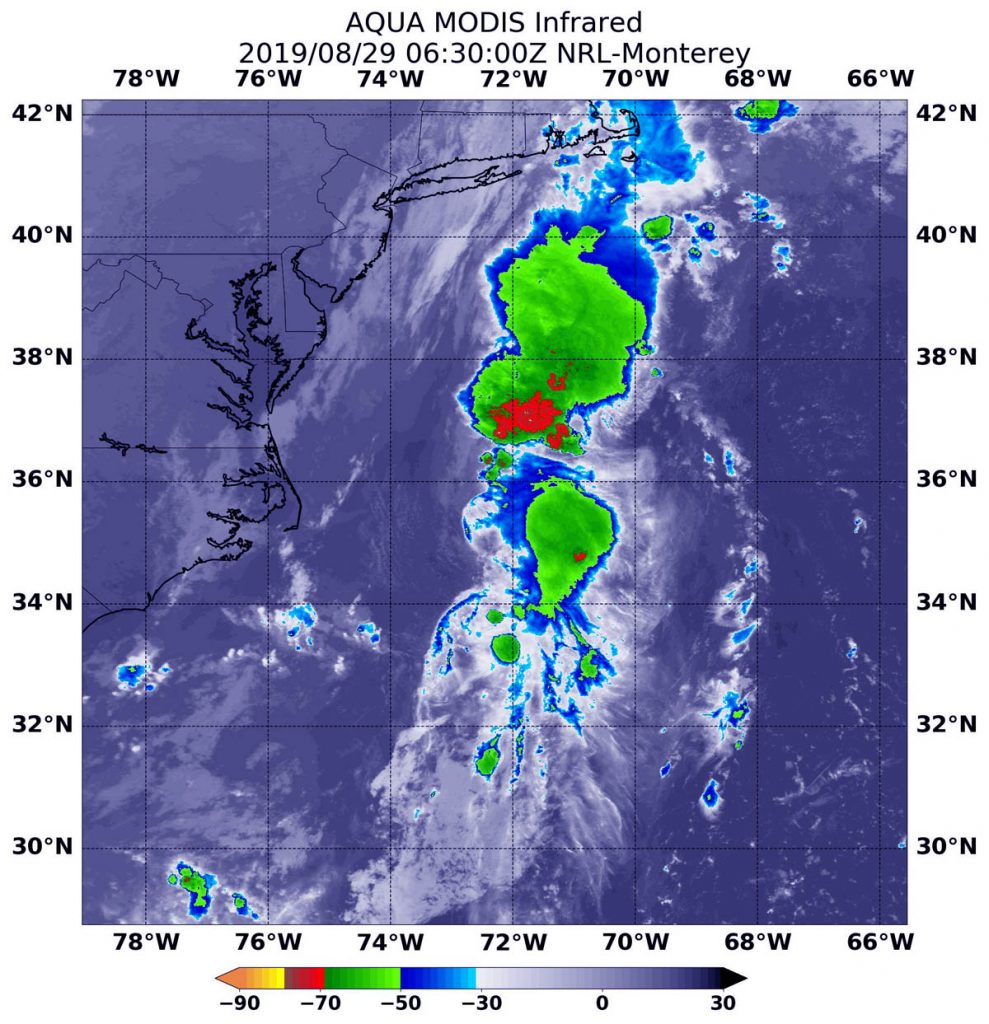
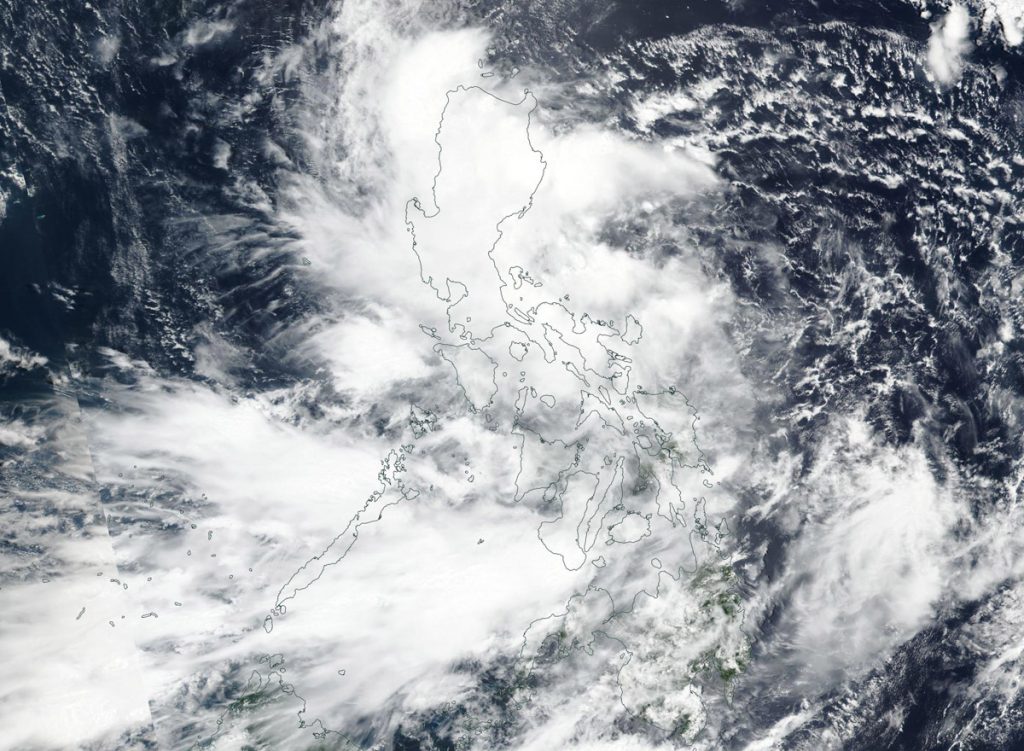
On Aug. 29, 2019, NASA’s Aqua satellite captured this infrared image with the AIRS instrument which analyzed cloud top temperatures in the storm.  The coldest temperatures AIRS found were in the center of the storm where the strongest thunderstorms are found.  These storms were as cold as or colder than minus 63 degrees Fahrenheit (minus 53 degrees Celsius).  NASA research has found that cloud top temperatures that cold indicate strong storms with the potential to generate heavy rainfall.

At 8:00 am EDT (1200 UTC), the NHC reported that “the the center of Hurricane Dorian was located near latitude 24.2 North, longitude 69.4 West. Dorian is moving toward the northwest near 12 mph (19 km/h), and this motion is expected to continue through today. A slower west-northwestward to westward motion is forecast to begin tonight and continue through the weekend. On this track, Dorian should move over the Atlantic well east of the southeastern and central Bahamas today, approach
the northwestern Bahamas Saturday, and move near or over portions of
the northwestern Bahamas on Sunday.”

Dorian is expected to strengthen during the next few days, and become a major hurricane later today (Aug. 30). Dorian is likely to remain an extremely dangerous hurricane while it moves near the northwestern Bahamas and approaches the Florida peninsula through the weekend.

Currently hurricane-force winds extend outward up to 25 miles (35 km) from the center, and tropical-storm-force winds extend outward up to 105
miles (165 km).  Yesterday the barometric pressure inside the storm was 991 mb.  Today the minimum central pressure just reported by the Air Force reconnaissance plane was 972 mb (28.70 inches).  The lower the barometric pressure in hurricanes, the higher the wind speeds— and the more dangerous the storm.

Hurricane conditions are possible within the watch area by Sunday, with tropical storm conditions possible by Saturday night or Sunday morning.

A life-threatening storm surge will raise water levels by as much as 10 to 15 feet above normal tide levels in areas of onshore winds in the northwestern Bahamas. Near the coast the surge will be accompanied by large and destructive waves.

Dorian is expected to produce the following rainfall accumulations this weekend into the middle of next week:

Northwestern Bahamas and coastal sections of the Southeast United States…6 to 12 inches, isolated 15 inches.
Central Bahamas…1 to 2 inches, isolated 4 inches.

This rainfall may cause life-threatening flash floods.

Swells are likely to begin affecting the east-facing shores of the Bahamas and the southeastern United States coast during the next few days. These swells are likely to cause life-threatening surf and rip current conditions.

For updated forecasts, visit NOAA’s NHC: www.nhc.noaa.gov

By Lynn Jenner
NASA’s Goddard Space Flight Center

Dorian (Atlantic Ocean)

Aug 30, 2019 – Update #1 – NOAA’s GOES-East and GOES-15 Capture Dorian’s Movement in the Atlantic

This short animated GIF shows night and day movement of Dorian across the Atlantic from Aug. 29, 2019 at 11:30 pm (EDT) to Aug. 30, 2019 at 9:00 am (EDT).

GOES-East gif of Dorian across the Atlantic.
NOAA’s GOES-East satellite shows Dorian’s progression towards the U.S. in this animated GIF.

A second image provided by the U.S. Naval Research Laboratory shows a visible satellite image of Dorian taken by NOAA’s GOES-15 at 8:00 am EDT.

NOAA's GOES-15 visible image of Dorian at 8:00am EDT.
NOAA’s GOES-15 visible image of Dorian at 8:00am EDT.

Ongoing coverage of this storm will be provided by NASA during the day today and over the Labor Day weekend.

For more information, visit: https://www.nhc.noaa.gov

By Lynn Jenner
NASA’s Goddard Space Flight Center

Podul (was 13W) – Northwestern Pacific Ocean

Aug. 29, 2019 – NASA Tracks Tropical Storm Podul’s Landfall Approach to Vietnam

NASA’s Aqua satellite passed over the South China Sea and provided forecasters with a visible image of Tropical Storm Podul as it moved closer to the coast of north and central Vietnam where it is expected to make landfall on August 29.

Aqua image of Podul
On Aug. 29, 2019 at 2 a.m. EDT (0600 UTC), the MODIS instrument aboard NASA’s Aqua satellite provided a visible image of Podul in the South China Sea. Podul had already started its landfall in central Vietnam and appeared somewhat elongated. Credit: NASA/NRL

On Aug. 29, 2019 at 2 a.m. EDT (0600 UTC), the Moderate Resolution Imaging Spectroradiometer or MODIS instrument aboard NASA’s Aqua satellite provided a visible image of Podul in the South China Sea. Podul had already started its landfall in central Vietnam and appeared somewhat elongated because northerly winds outside the storm are pushing clouds south of the center.

At 5 a.m. EDT (0900 UTC) on Aug. 29, Tropical storm Podul was centered near 17.8 degrees north latitude and 108.3 degrees east longitude, about 108 nautical miles north of Da Nang, Vietnam. Podul continued moving west and had maximum sustained winds 35 knots (40 mph/65 kph).

The Vietnam National Centre for Hydro-Meteorological Forecasting (NCHMF) is a governmental organization belonging Vietnam Meteorological Hydrological Administration (VMHA) with authority to issue forecasting/warning information for weather, climate, hydrology, water resource, marine weather (i.e. hydrometeorology) and provide hydro-meteorology services.  NHCMF has issued a Tropical Storm Warning for central Vietnam with the approach of Podul.

For updated warnings and forecasts from NCHMF, visit: http://www.nchmf.gov.vn/Web/en-US/104/102/18004/Default.aspx

By Rob Gutro
NASA’s Goddard Space Flight Center

Dorian (Atlantic Ocean)

Aug. 29, 2019 – NASA Estimates Heavy Rainfall in Hurricane Dorian

Hurricane Dorian is packing heavy rain as it moves toward the Bahamas as predicted by NOAA’s NHC or National Hurricane Center. NASA analyzed the storm and found heavy rainfall in the storm.

GPM image of Dorian
This image shows estimated rainfall accumulations for the region affected by Hurricane Dorian over the 24 hour period of Aug.27 11:59 UTC to Aug. 28 11:59 UTC. The imagery was generated using the Integrated Multi-satEllite Retrievals for GPM (IMERG) “early run” product. The data indicates that up to 120 mm (4.72 inches) of rainfall accumulated in certain regions during the 24 hour period. Credit: NASA/Jacob Reed

NASA has the ability to peer under the “hood” or clouds of a tropical cyclone and estimate the rainfall rates occurring. After looking into Dorian’s clouds, imagery was generated using the Integrated Multi-satEllite Retrievals for GPM or IMERG “early run” product, at NASA’s Goddard Space Flight Center in Greenbelt, Maryland. IMERG uses a constellation of satellites united by the GPM Core Observatory to provide global observations of Earth’s precipitation every 30 minutes.

IMERG estimated rainfall accumulations for the region affected by Hurricane Dorian over the 24 hour period of August 27 at (7:59 a.m. EDT) 11:59 UTC to August 28 at (7:59 a.m. EDT) 11:59 UTC. “The data indicates that up to 120 mm (4.72 inches) of rainfall accumulated in certain regions during the 24 hour period,” said Jacob Reed of NASA Disasters Program, GPM at NASA Goddard.

NHC said that Dorian is expected to produce the following rainfall accumulations this weekend into early next week: The central Bahamas…2 to 4 inches, isolated 6 inches; the northwestern Bahamas and coastal sections of the Southeastern United States…4 to 8 inches, isolated 12 inches. This rainfall may cause life-threatening flash flood.

On Aug. 29 at 5 a.m. EDT (0900 UTC), NOAA’s NHC said the center of Hurricane Dorian was located near latitude 20.5 degrees north and longitude 66.6 degrees west. That puts Dorian’s center about 150 miles (240 km) north-northwest of San Juan, Puerto Rico and about 425 miles (685 km) east-southeast of the southeastern Bahamas.

Dorian is moving toward the northwest near 13 mph (20 kph), and this general motion is expected to continue through Friday.  A west-northwestward motion is forecast to begin Friday night and continue into the weekend.

Maximum sustained winds are near 85 mph (140 kph) with higher gusts. Strengthening is forecast during the next few days, and Dorian is expected to become a major hurricane on Friday. The minimum central pressure based on earlier Air Force Reserve Hurricane Hunter data is 991 mb (29.27 inches).

NHC said “On this track, Dorian should move over the Atlantic well east of the southeastern and central Bahamas today and on Friday, and approach the northwestern Bahamas on Saturday.”

Interests in the northwestern and central Bahamas should monitor the progress of Dorian. Swells are likely to begin affecting the east-facing shores of the Bahamas and the southeastern United States coast during the next few days.  These swells are likely to cause life-threatening surf and rip current conditions.

For updated forecasts, visit NOAA’s NHC: www.nhc.noaa.gov

By Rob Gutro
NASA’s Goddard Space Flight Center

Erin (Atlantic Ocean)

Aug. 29, 2019 – NASA Sees a Transitioned, Merging Extra-Tropical Storm Erin Off U.S. East Coast

Former tropical depression Erin has made the transition into an extra-tropical system off the eastern coast of the U.S. Infrared imagery from NASA’s Aqua satellite provided temperature data on storms associated with Erin and the weather system it is merging with.

NOAA’s National Hurricane Center or NHC issued the final advisory on Erin on Aug. 29 at 5 a.m. EDT.

Aqua image of Erin
On Aug. 29 at 2:30 a.m. EDT (630 UTC), the MODIS instrument that flies aboard NASA’s Aqua satellite found Erin’s strongest thunderstorms (yellow circle) confined to a small area around the center. Cloud top temperatures were as cold as minus 50 degrees Fahrenheit (minus 45.5 degrees Celsius). Storms with colder cloud top temperatures were located far to the north of Erin’s center and are associated with the frontal system of which Erin is merging. Those storms had cloud top temperatures as cold as minus 70F degrees (minus 56.6C). Cloud top temperatures that cold indicate strong storms with the potential to generate heavy rainfall. Credit: NASA/NRL

On Aug. 29 at 2:30 a.m. EDT (630 UTC), the Moderate Imaging Spectroradiometer or MODIS instrument that flies aboard NASA’s Aqua satellite used infrared light and found strongest thunderstorms associated with Erin where confined to a small area around the center. There, cloud top temperatures were as cold as minus 50 degrees Fahrenheit (minus 45.5 degrees Celsius). Infrared data provides temperature information, and the strongest thunderstorms that reach high into the atmosphere have the coldest cloud top temperatures.

Storms with colder cloud top temperatures were located far to the north of Erin’s center and are associated with the frontal system of which Erin is merging. Those storms had cloud top temperatures as cold as minus 70 degrees Fahrenheit (minus 56.6 Celsius). Cloud top temperatures that cold indicate strong storms with the potential to generate heavy rainfall.

Satellite imagery and scatterometer (wind) data indicate that Erin is merging with a frontal system and is now an extratropical low pressure area. On Aug. 30, Erin is expected to be absorbed by a larger extratropical low pressure area over eastern Canada.

When a storm becomes extra-tropical, it means that a tropical cyclone has lost its “tropical” characteristics. The National Hurricane Center defines “extra-tropical” as a transition that implies both poleward displacement (meaning it moves toward the north or south pole) of the cyclone and the conversion of the cyclone’s primary energy source from the release of latent heat of condensation to baroclinic (the temperature contrast between warm and cold air masses) processes. It is important to note that cyclones can become extratropical and still retain winds of hurricane or tropical storm force.

At 5 a.m. EDT (0900 UTC), NHC noted that the center of Post-Tropical Cyclone Erin was located near latitude 36.1 degrees north and longitude 71.6 degrees west. That puts the center of Erin about 225 miles (365 km) east-northeast of Cape Hatteras, North Carolina.  The post-tropical cyclone is moving toward the north-northeast near 15 mph (24 kph). A turn toward the northeast and a faster forward motion are expected later today, with this motion continuing through Friday. Maximum sustained winds are near 35 mph (55 kph) with higher gusts.

The post-tropical cyclone is expected to strengthen a little on Friday, Aug. 30, before it is absorbed by a larger extratropical low over eastern Canada Friday night.

Additional information on this system can be found in High Seas Forecasts issued by the National Weather Service online at: http://ocean.weather.gov/shtml/NFDHSFAT1.php.

By Rob Gutro
NASA’s Goddard Space Flight Center

Dorian – Atlantic Ocean

Aug. 28, 2019 – Update #2 – NASA Sees Dorian Become a Hurricane

NASA’s Terra satellite passed over the northwestern Atlantic Ocean as Dorian reached hurricane status during the afternoon of August 28, 2019.

Terra image of Dorian
On Aug. 28, 2019 at 1:30 p.m. EDT, the MODIS instrument aboard NASA’s Terra satellite provided a visible image of Dorian as it became a hurricane near St. Thomas and the U.S. Virgin Islands. Credit: NASA Worldview, Earth Observing System Data and Information System (EOSDIS)

On Aug. 28, 2019 at 1:30 p.m. EDT, the Moderate Resolution Imaging Spectroradiometer or MODIS instrument aboard NASA’s Terra satellite provided a visible image of Dorian near St. Thomas and the U.S. Virgin Islands. At 2 p.m. EDT, the National Hurricane Center noted, “Satellite and radar images indicate that the cloud pattern has become better organized during the past several hours.”

Dorian strengthened over the warm waters of the eastern Caribbean Sea and was officially designated a Category 1 hurricane on the Saffir-Simpson Hurricane Wind Scale at 2 p.m. EDT.

At 2 p.m. EDT, a Hurricane Warning is in effect for Vieques and Culebra, the U.S. Virgin Islands and the British Virgin Islands. The National Hurricane Center issued a Tropical Storm Warning for Puerto Rico with a Hurricane Watch also in effect as changing conditions warrant.

NOAA’s National Hurricane Center or NHC said that at 2 p.m. EDT (1800 UTC), the center of Hurricane Dorian was located near latitude 18.3 degrees north and longitude 65.0 degrees west. That puts Dorian directly over the island of St. Thomas.

Dorian is moving toward the northwest near 13 mph (20 kph), and this motion is expected to continue for the next day or two. Maximum sustained winds have increased to near 75 mph (120 kph) with higher gusts. Hurricane-force winds extend outward up to 20 miles (30 km) to the north and east of the center. Tropical-storm-force winds extend outward up to 80 miles (130 km) primarily to the east of the center. An elevated weather station on Buck Island just south of St. Thomas reported a sustained wind of 82 mph (132 kph) and a gust of 111 mph (178 kph). The estimated minimum central pressure from nearby observations is 997 millibars.

NOAA’s National Hurricane Center provided three key messages for Dorian:

  1. Hurricane conditions are expected in the U.S. and British Virgin Islands, Culebra, and Vieques today. Tropical storm conditions are expected in Puerto Rico today with hurricane conditions possible.
  2. Heavy rainfall over portions of Puerto Rico and the U.S. and British Virgin Islands could produce flash flooding during the next couple of days. Heavy rains are expected to occur over portions of the Bahamas, Florida, and elsewhere in the southeastern United States later this week and into early next week.
  3. The risk of dangerous storm surge and hurricane-force winds is increasing in the central and northwestern Bahamas and along the Florida east coast, although it is too soon to determine where these hazards will occur. Residents in these areas should ensure that they have their hurricane plan in place and not focus on the exact forecast track of Dorian’s center.

On this track, Dorian should continue to move near or over the U.S. and British Virgin Islands this afternoon and then move over the open Atlantic well east of the southeastern Bahamas. Dorian is forecast to continue strengthening during the next few days over the Atlantic waters.

For updated forecasts, visit: www.nhc.noaa.gov

By Rob Gutro
NASA’s Goddard Space Flight Center

Podul (was13W – Northwestern Pacific Ocean)

Aug. 28, 2019 – NASA-NOAA Satellite Finds Tropical Storm Podul Marching Through South China Sea

Tropical Storm Podul was moving through the South China Sea when NASA-NOAA’s Suomi NPP satellite passed overhead from space and snapped a visible image of the storm.

Suomi NPP image of Podul
NASA-NOAA’s Suomi NPP provided a visible image of Tropical Storm Podul on Aug. 28 at 2:18 a.m. EDT (0618 UTC). The image showed that the storm had encountered wind shear because the bulk of clouds were pushed west of the center. Credit: NASA/NRL

The Visible Infrared Imaging Radiometer Suite (VIIRS) instrument aboard Suomi NPP provided a visible image of the storm on Aug. 28 at 2:18 a.m. EDT (0618 UTC). The VIIRS image showed the storm was being affected by wind shear because much of the cloud cover and thunderstorms were being pushed west of the center. That left minimal clouds and storms east of center. The Joint Typhoon Warning Center noted, “The environment is marginal overall with unfavorably strong (25-30 knot) vertical wind shear.”

In general, wind shear is a measure of how the speed and direction of winds change with altitude. Tropical cyclones are like rotating cylinders of winds. Each level needs to be stacked on top each other vertically in order for the storm to maintain strength or intensify. Wind shear occurs when winds at different levels of the atmosphere push against the rotating cylinder of winds, weakening the rotation by pushing it apart at different levels.

At 11 a.m. EDT (1500 UTC) on Aug. 28, the Joint Typhoon Warning Center or JTWC noted that Tropical Storm Podul was centered near 17.2 degrees north latitude and 114.0 degrees east longitude. That’s about 336 nautical miles east-northeast of Da Nang, Vietnam. Podul was moving west toward Vietnam. Maximum sustained winds 35 knots (40 mph/65 kph).

Podul is expected to strengthen as it continues moving through the South China Sea, and will make landfall in northern Vietnam on Aug. 30.

By Rob Gutro 
NASA’s Goddard Space Flight Center

Erin (was TD6) – Atlantic Ocean

Aug. 28, 2019 – NASA Finds Wind Shear Affecting Tropical Depression Erin

Visible and infrared imagery from NASA’s Terra satellite revealed that strong wind shear was adversely affecting Tropical Depression Erin, located about 200 miles off the Carolina coast.

Terra image of Erin
On Aug. 27, the MODIS instrument aboard NASA’s Terra satellite provided a visible image of Tropical Depression Erin that showed the storm was being affected by vertical wind shear. Credit: NASA Worldview, Earth Observing System Data and Information System (EOSDIS)

On Aug. 27, the Moderate Resolution Imaging Spectroradiometer or MODIS instrument aboard NASA’s Terra satellite provided a visible image of Tropical Depression Erin. In the image, Erin appeared as a swirl of clouds around its center with most of its clouds and thunderstorms pushed southeast of center. Strong northwesterly vertical wind shear was pushing at the storm.

Despite fighting wind shear on Aug. 27, Tropical Depression 6 strengthened into a tropical storm by 11 p.m. EDT, and was renamed Erin.

Infrared imagery from NASA’s Aqua satellite confirmed that wind shear was still affecting Tropical Storm Erin on Wednesday, August 28 at 3:25 a.m. EDT (0725 UTC). Infrared imagery reveals temperature data, and showed the only strong storms in the tropical storm were being pushed to the southeast. Strongest storms were as cold as minus 70 degrees Fahrenheit (minus 56.6 degrees Celsius).

Aqua image of Erin
Infrared imagery from NASA’s Aqua satellite confirmed that wind shear was still affecting Erin on Aug.28 at 3:25 a.m. EDT (0725 UTC). Infrared imagery reveals temperature data, and showed the only strong storms (red) in the tropical depression were pushed to the southeast. Strongest storms were as cold as minus 70 degrees Fahrenheit (minus 56.6 degrees Celsius). Credit: NASA/NRL

In general, wind shear is a measure of how the speed and direction of winds change with altitude. Tropical cyclones are like rotating cylinders of winds. Each level needs to be stacked on top each other vertically in order for the storm to maintain strength or intensify. Wind shear occurs when winds at different levels of the atmosphere push against the rotating cylinder of winds, weakening the rotation by pushing it apart at different levels.

By 11 a.m. EDT (1500 UTC), Tropical Storm Erin had weakened back to a depression. At that time, the center of Tropical Depression Erin was located near latitude 33.6 degrees north and longitude 72.8 degrees west. That places the center of Erin about 190 miles (305 km) southeast of Cape Hatteras, North Carolina. The bulk of clouds and precipitation, however, are south of the center. However, because Erin is so far from the coast, there are no coastal watches or warnings in effect.

The depression is moving toward the north-northwest near 13 mph (20 kph). Maximum sustained winds are near 35 mph (55 km/h) with higher gusts. The estimated minimum central pressure is 1006 millibars.

The cyclone is expected to turn northward later today and then north-northeastward early Thursday morning with an increase in forward speed.

NHC forecaster Daniel Brown noted in the Aug. 28 discussion, “The northwesterly shear that has been affecting Erin is forecast to decrease somewhat later today and tonight, but given the current structure of the system, little overall change in intensity is anticipated during that time. If convection does not re-develop closer to the center later today, Erin could become post-tropical.”

For updated forecasts, visit: www.nhc.noaa.gov

By Rob Gutro
NASA’s Goddard Space Flight Center

Dorian (Atlantic Ocean)

Aug. 28, 2019 – Update #1 – NASA Finds Heavy Rain Potential in Tropical Storm Dorian

NASA’s Aqua satellite provided forecasters at the National Hurricane Center with visible imagery and infrared data on Tropical Storm Dorian as it continued its western track into the Eastern Caribbean Sea. Infrared data provided an indication of the storm’s heavy rain making potential.

Aqua image of Dorian
On Aug. 27 at 1:35 p.m. EDT (1735 UTC) the MODIS instrument aboard NASA’s Aqua provided a visible look at Tropical Storm Dorian as it moved over the Leeward Islands. Credit: NASA Worldview, Earth Observing System Data and Information System (EOSDIS)

Watches and Warnings

On Wednesday, August 28, 2019, the National Hurricane Center or NHC noted that a Hurricane Watch is in effect for Puerto Rico, Vieques, Culebra, and the U.S. Virgin Islands. A Tropical Storm Warning is in effect for Puerto Rico, Vieques, Culebra, the U.S. Virgin Islands and the British Virgin Islands. A Tropical Storm Watch is in effect for the Dominican Republic from Isla Saona to Samana.

Infrared Temperatures Indicate Strong Storms

Cloud top temperatures provide information to forecasters about where the strongest storms are located within a tropical cyclone. The stronger the storms, the higher they extend into the troposphere, and the colder the cloud top temperatures. NASA’s Aqua satellite analyzed Tropical Storm Dorian’s cloud tops to get that information. AIRS found that some areas in Dorian were being affected by dry air, which was sapping the development of thunderstorms.

Aqua image of Dorian
On Aug. 27 at 1:35 p.m. EDT (1735 UTC), the AIRS instrument aboard NASA’s Aqua satellite analyzed cloud top temperatures of Tropical Storm Dorian in infrared light. AIRS found coldest cloud top temperatures (purple) of strongest thunderstorms were as cold as or colder than minus 63 degrees Fahrenheit (minus 53 degrees Celsius). Credit: NASA JPL/Heidar Thrastarson

The NHC noted that 10-mile wide eye feature developed in Martinique and Guadeloupe radar data between 11 a.m. and 12 p.m. EDT (1500-1600 UTC) around the time Aqua passed over Dorian, and then again between 1 p.m. and 2 p.m. EDT (1700-1800 UTC) around the time the Aqua satellite passed overhead.

NASA’s Aqua satellite analyzed the storm on Aug. 27 at 1:35 p.m. EDT (1735 UTC) using the Atmospheric Infrared Sounder or AIRS instrument. AIRS found coldest cloud top temperatures as cold as or colder than minus 63 degrees Fahrenheit (minus 53 degrees Celsius) around the center and in a thick band of thunderstorms east of the center. NASA research has indicated that cloud top temperatures that cold indicate strong storms that have the capability to create heavy rain.

Heavy Rainfall Expected

NHC forecasters said that Dorian is expected to produce the following rainfall accumulations:

  • Western Leeward Islands from Guadeloupe to St. Kitts to Anguilla…1 to 4 inches
  • Southern and Eastern Puerto Rico and the U.S. and British Virgin Islands…4 to 6 inches, isolated 10 inches
  • Northwestern Puerto Rico…1 to 4 inches
  • Haiti and Dominican Republic…1 to 3 inches
  • Southern Bahamas…1 to 4 inches
  • Northern Bahamas…3 to 6 inches
  • Florida Peninsula…4 to 8 inches, isolated 10 inches

This rainfall may cause life-threatening flash floods.

Dorian’s Status at 8 a.m. EDT on August 28, 2019

At 8 a.m. EDT (1200 UTC), the center of Tropical Storm Dorian was located near latitude 17.1 North, longitude 64.1 West.

Dorian is moving toward the northwest near 13 mph (20 kph), and this general motion is expected to continue during the next few days.  Maximum sustained winds are near 60 mph (95 kph) with higher gusts. Tropical-storm-force winds extend outward up to 60 miles (95 km) from the center. NHC forecasters said some strengthening is expected today, and Dorian is forecast to be near hurricane strength when it approaches the Virgin Islands and Puerto Rico. An Air Force reconnaissance plane just reported an estimated minimum central pressure of 1003 millibars.

Tropical storm conditions are expected and hurricane conditions are possible in Puerto Rico, Vieques, Culebra, and the U.S. Virgin Islands today. Swells are expected to increase later this morning across the U.S. and British Virgin Islands and along the southern coasts of Puerto Rico and Hispaniola, and they could cause life-threatening surf and rip current conditions.

On the forecast track, the center of Dorian will pass over or near the U.S. and British Virgin Islands and Puerto Rico later today, Aug. 28. Dorian is then forecast to move to the east of the Turks and Caicos and the southeastern Bahamas on Thursday, and near or to the east of the central and northwestern Bahamas on Friday and Saturday.

For updated forecasts, visit: www.nhc.noaa.gov

By Rob Gutro
NASA’s Goddard Space Flight Center  

Podul (was 13W) – Northwestern Pacific Ocean

Aug. 27, 2019 – NASA-NOAA Satellite Tracks Tropical Depression Podul Across Philippines

Tropical Depression 13W, now named Podul, was crossing the Philippines from east to west as NASA-NOAA’s Suomi NPP satellite provided a visible image of the storm.

Suomi NPP image of Podul
On August 27, 2019, NASA-NOAA’s Suomi NPP satellite passed over the South China Sea and captured a visible image of Tropical Storm Podul. Credit: NASA Worldview, Earth Observing System Data and Information System (EOSDIS).

Podul’s trek across the country triggered many Philippines warnings on August 27, 2019. Tropical cyclone wind signal #2 is in effect over the following Luzon provinces:  Isabela, Aurora, Quirino, Nueva Vizcaya, Ifugao, Mountain Province, Ifugao, Benguet, Ilocos Sur, La Union and Pangasinan. Tropical cyclone wind signal #1 is in effect over the following Luzon provinces: Cagayan, Apayao, Abra, Kalinga, Ilocos Norte, Nueva Ecija, Tarlac, Zambales, Bataan, Pampanga, Bulacan, Metro Manila, Rizal, northern portion of Quezon including Polillo Island and Alabat Island, Cavite, Laguna, Camarines Norte, northeastern portion of Camarines Sur and Catanduanes.

The Visible Infrared Imaging Radiometer Suite (VIIRS) instrument aboard Suomi NPP provided a visible image of the storm on August 27, 2019. The VIIRS image showed the storm blanketed the country from north to south. The bulk of the clouds were located over the northern and central Philippines.

At 11 a.m. EDT (1500 UTC), Podul, known locally in the Philippines as “Jenny,” was located near 16.0 degrees north latitude and 123.2 degrees east longitude. That puts the center of circulation about 153 nautical miles northeast of Manila, Philippines. It was moving to the west-northwest and had maximum sustained winds near 30 knots (34.5 mph/55.5. kph).

The Joint Typhoon Warning Center said that Podul will move west across the Philippines, before turning northwest towards Hainan Island, China. The system is expected to make final landfall in Vietnam after five days.

By Rob Gutro 
NASA’s Goddard Space Flight Center