Subtropical Storm Alpha has formed near the coast of Portugal, becoming the first named storm using the Greek Alphabet list, now that the annual list of names is exhausted. NASA’s Aqua satellite obtained visible imagery of the new storm.
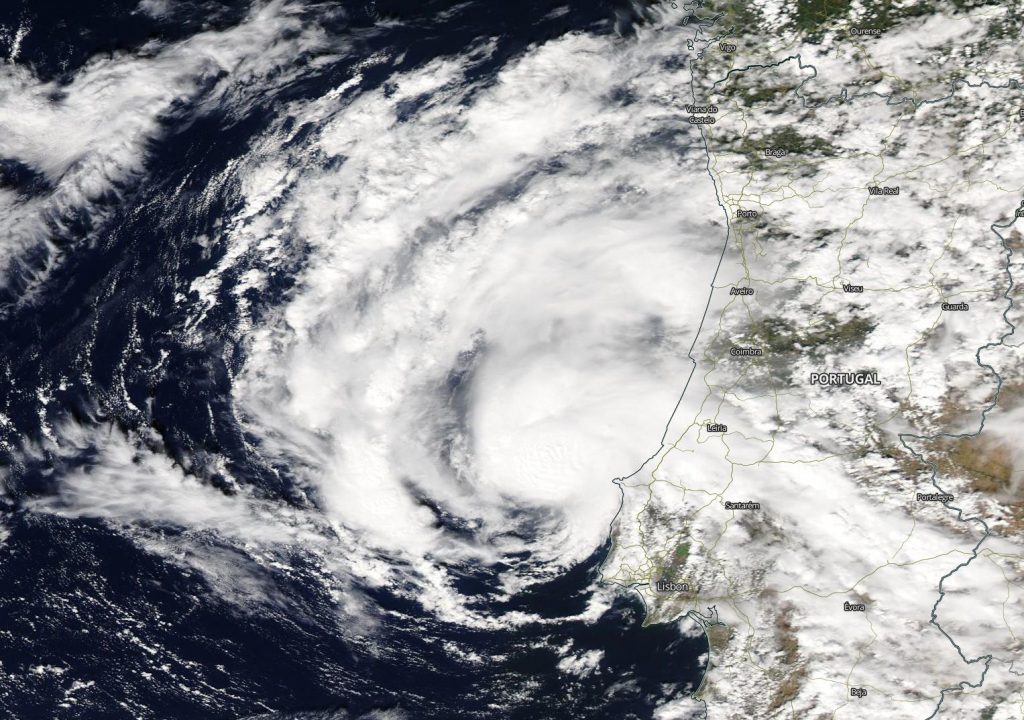
On Sept. 18, 2020, NASA’s Aqua satellite provided a visible image of Subtropical Storm Alpha in the eastern North Atlantic Ocean near Portugal’s coast. Image Courtesy: NASA Worldview, Earth Observing System Data and Information System (EOSDIS).
NASA Satellite View
The Moderate Resolution Imaging Spectroradiometer or MODIS instrument that flies aboard NASA’s Aqua satellite captured a visible image of Subtropical Storm Alpha on Sept. 18 at 8:30 a.m. EDT (1:30 p.m. local time) near Portugal. The image showed a better-organized small low-pressure area that has been rotating around a larger extratropical low pressure area. Satellite imagery shows that moderate-to-deep convection has persisted near the center creating thunderstorms since last night. Meanwhile scatterometer data shows a closed 40-knot low-pressure area, and the National Hurricane Center noted that radar images from Portugal show a definite organized convective pattern.
Although Alpha is “likely neutral- or cold-core, it has developed enough tropical characteristics to be considered a subtropical storm,” said Eric Blake, senior hurricane specialist at NOAA’s National Hurricane Center (NHC) in Miami, Fla.
Satellite imagery was created using NASA’s Worldview product at NASA’s Goddard Space Flight Center in Greenbelt, Md.
Alpha’s Status
At 12:30 p.m. EDT (1630 UTC), NOAA’s National Hurricane Center (NHC) noted the center of Subtropical Storm Alpha was located near latitude 39.9 degrees north and longitude 9.3 degrees west. That is just 75 miles (125 km) north of Lisbon, Portugal. The storm is moving toward the northeast near 17 mph (28 kph), and this general motion is expected during the next day or so before dissipation. Maximum sustained winds are near 50 mph (85 kph) with higher gusts. The estimated minimum central pressure is 999 millibars.
Alpha’s Impacts
Alpha should move across the coast of west-central Portugal during the next couple of days. Little change in strength is expected before landfall, with rapid weakening over land through the weekend.
NHC said Alpha is expected to produce 1 to 2 inches (25 to 50 mm) of rainfall, with isolated amounts of 3 inches (75 mm) over the northern portion of Portugal and into west-central Spain through Saturday morning.
Information on wind hazards from Alpha can be found in products from the Portuguese Institute for Sea and Atmosphere at www.ipma.pt.
Global models show the small low pressure area moving northeastward for the next 24 hours before dissipating over northern Spain or the Bay of Biscay.
About NASA’s Worldview and Aqua Satellite
NASA’s Earth Observing System Data and Information System (EOSDIS) Worldview application provides the capability to interactively browse over 700 global, full-resolution satellite imagery layers and then download the underlying data. Many of the available imagery layers are updated within three hours of observation, essentially showing the entire Earth as it looks “right now.”
NASA’s Aqua satellite is one in a fleet of NASA satellites that provide data for hurricane research.
Tropical cyclones/hurricanes are the most powerful weather events on Earth. NASA’s expertise in space and scientific exploration contributes to essential services provided to the American people by other federal agencies, such as hurricane weather forecasting.
Sep. 18, 2020 – NASA-NOAA Satellite Sees Tropical Depression 22 Strengthening in Gulf of Mexico
NASA-NOAA’s Suomi NPP satellite provided an infrared image of Tropical Depression 22 in the Gulf of Mexico during the early morning hours of Sept. 18. TD22 is expected to become a tropical storm, according to the National Hurricane Center (NHC).
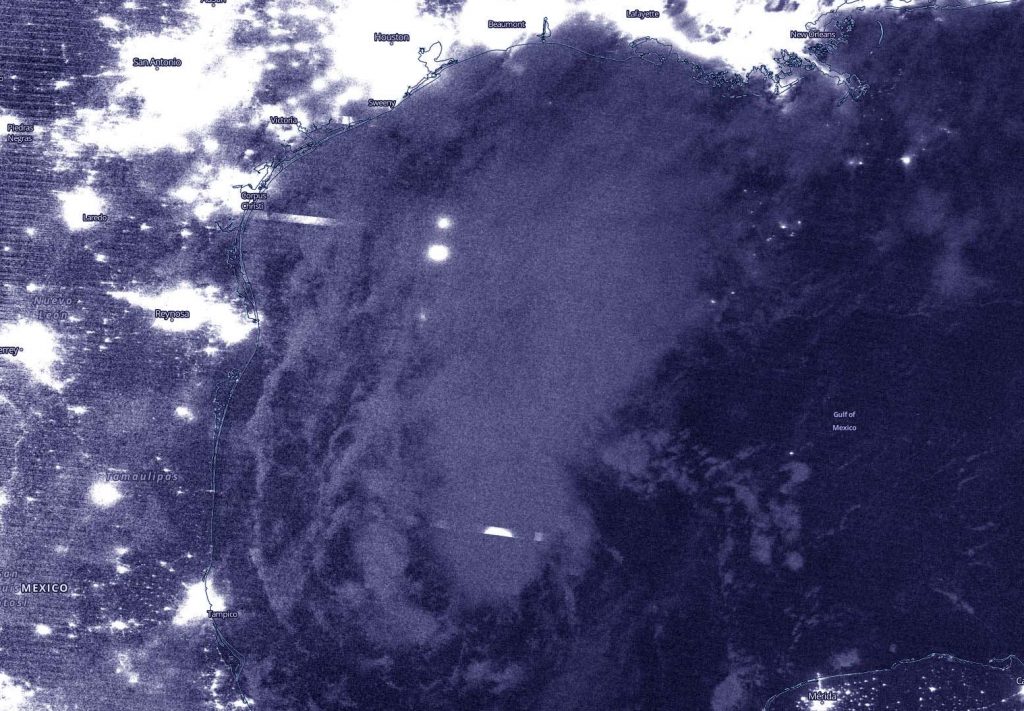
NASA-NOAA’s Suomi NPP satellite passed the Gulf of Mexico on Sept. 18 at 3:40 a.m. EDT (0740 UTC) and captured a night-time image of Tropical Depression 22, centered in the Gulf of Mexico, east of northern Mexico. Credit: NASA Worldview, Earth Observing System Data and Information System (EOSDIS)
NASA’s Night-Time View
The Visible Infrared Imaging Radiometer Suite (VIIRS) instrument aboard Suomi NPP provided a nighttime image of Tropical Depression 22. The nighttime image taken on Sept. 18 at 3:40 a.m. EDT (0740 UTC) showed Tropical Depression 22, centered in the Gulf of Mexico, east of northern Mexico.
The image was created using the NASA Worldview application at NASA’s Goddard Space Flight Center in Greenbelt, Md.
By 11 a.m. EDT, the National Hurricane Center noted satellite imagery showed Tropical Depression 22 was getting better organized, with gradually increasing convective banding (of thunderstorms) in the northeastern semicircle.
NHC Senior Hurricane Specialist Jack Beven noted, “Given the lack of organization seen in earlier scatterometer data, the intensity will be held at 30 knots pending the data from the next set of scatterometer overpasses. It should be noted that the Air Force Reserve Hurricane Hunter aircraft that was scheduled to investigate the depression had to turn back after getting hit by lightning.”
TD22’s Status on Friday, Sept. 18
At 11 a.m. EDT (1500 UTC), the center of Tropical Depression 22 was located near latitude 23.8 degrees north and longitude 93.9 degrees west. The depression is moving toward the north-northeast near 7 mph (11 kph), and this general motion is expected through early Saturday. Maximum sustained winds are near 35 mph (55 kph) with higher gusts. The estimated minimum central pressure is 1005 millibars.
TD22’s Forecast
A slow westward motion is forecast to begin late Saturday afternoon or Saturday night, and this motion will likely continue into early next week. Strengthening is forecast during the next few days, and the depression is expected to become a tropical storm later today. The system could be near or at hurricane strength by Sunday.
NHC Key Messages for TD22
The National Hurricane Center issued three key messages for Tropical Depression 22:
Tropical Depression 22 is expected to strengthen to a tropical storm, and possibly a hurricane, while moving slowly over the western Gulf of Mexico during the next few days.
There is an increasing risk of heavy rainfall and flooding along the Texas coast from Sunday through at least the middle of next week as the system is forecast to move slowly near the Texas coast.
While it is too early to determine what areas could see direct wind and storm surge impacts from this system, interests throughout the western Gulf of Mexico should monitor the progress of this system and future updates to the forecast.
About NASA’s EOSDIS Worldview
NASA’s Earth Observing System Data and Information System (EOSDIS) Worldview application provides the capability to interactively browse over 700 global, full-resolution satellite imagery layers and then download the underlying data. Many of the available imagery layers are updated within three hours of observation, essentially showing the entire Earth as it looks “right now.”
NASA Researches Earth from Space
For more than five decades, NASA has used the vantage point of space to understand and explore our home planet, improve lives and safeguard our future. NASA brings together technology, science, and unique global Earth observations to provide societal benefits and strengthen our nation. Advancing knowledge of our home planet contributes directly to America’s leadership in space and scientific exploration.
Sep. 18, 2020 – NASA Confirms Development of Record-Breaking Tropical Storm Wilfred, Ending Hurricane List
The list of hurricane names is officially used up with the development of the 23rd tropical cyclone of the year. Tropical Storm Wilfred just formed in the Eastern Atlantic Ocean today, Sept. 18. Using a NASA satellite rainfall product that incorporates data from satellites and observations, NASA estimated Wilfred’s rainfall rates.
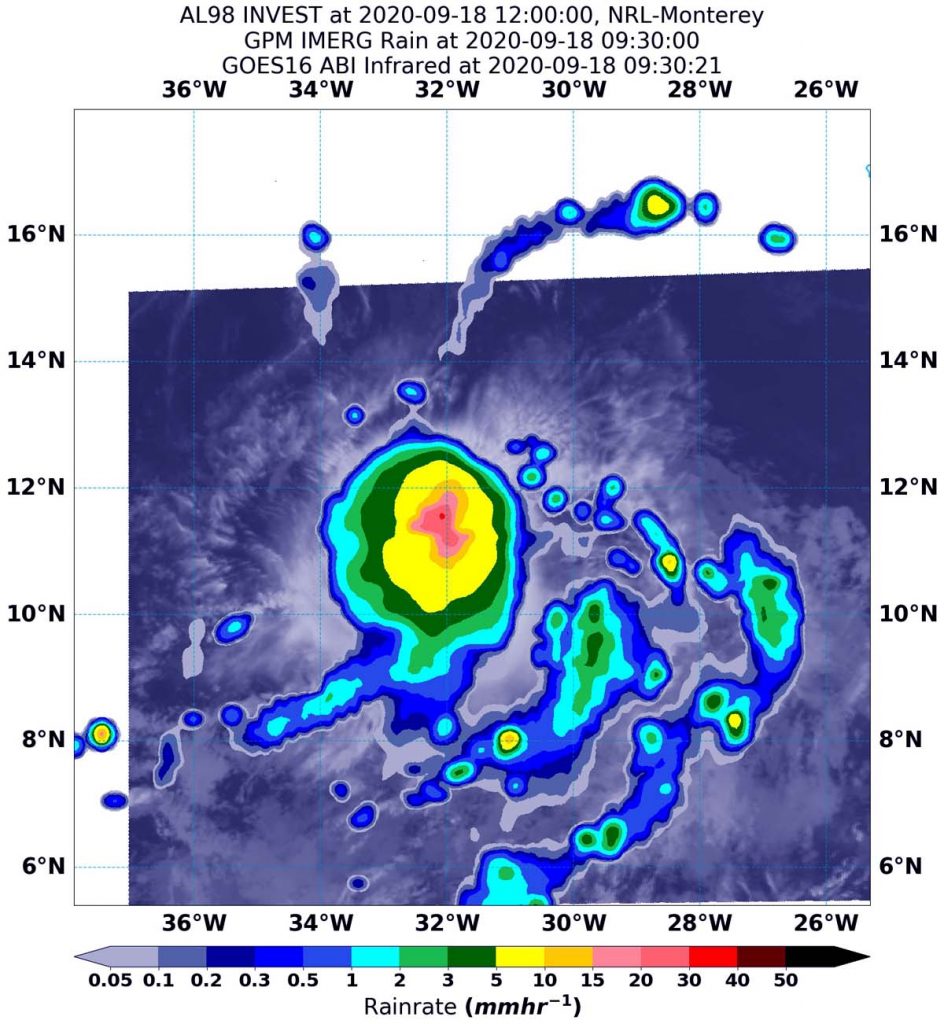
On Sept. 18 at 5:30 a.m. EDT (0930 UTC), NASA’s IMERG estimated Tropical Storm Wilfred was generating as much as 30 mm/1.18 inches of rain (dark pink) around the center of circulation. Rainfall throughout most of the storm and in fragmented bands of thunderstorms to the southeast of the center, was occurring between 5 and 15 mm (0.2 to 0.6 inches/yellow and green colors) per hour. The rainfall data was overlaid on infrared imagery from NOAA’s GOES-16 satellite. Credit: NASA/NOAA/NRL
All of the names on the 2020 official list of hurricane names for the Atlantic Ocean hurricane season have now been claimed. That means the next system that forms into a tropical storm will get a name from the Greek Alphabet. This only happened once in Atlantic hurricane history, back in 2005. If Tropical Depression 22, located in the Gulf of Mexico, becomes a tropical storm it would be named Alpha.
Eric Blake, Senior Hurricane Specialist at NOAA’s National Hurricane Center in Miami, Fla. noted, “Wilfred has formed, continuing the record-setting pace of the 2020 hurricane season since it is the earliest 21st named storm on record, about 3 weeks earlier than Vince of 2005.”
Wilfred’s Status on Sept. 18
At 11 a.m. EDT (1500 UTC), the center of Tropical Storm Wilfred was located near latitude 11.9 degrees north and longitude 32.4 degrees west. That is 630 miles (1,105 km) west-southwest of the Cabo Verde Islands. Wilfred is moving toward the west-northwest near 17 mph (28 kph) and this general motion is expected for the next few days.
Maximum sustained winds are near 40 mph (65 km/h) with higher gusts. Some slight strengthening is possible today, and weakening should start this weekend and continue into next week. The estimated minimum central pressure is 1008 millibars.
Estimating Wilfred’s Rainfall Rates from Space
NASA’s Integrated Multi-satellitE Retrievals for GPM or IMERG, which is a NASA satellite rainfall product, estimated on Sept. 18 at 5:30 a.m. EDT (0930 UTC), Wilfred was generating as much as 30 mm (1.18 inches) of rain per hour around the center of circulation.
Rainfall throughout most of the storm and in fragmented bands of thunderstorms to the southeast of the center was estimated as falling at a rate between 5 and 15 mm (0.2 to 0.6 inches) per hour. At the U.S. Naval Laboratory in Washington, D.C., the IMERG rainfall data was overlaid on infrared imagery from NOAA’s GOES-16 satellite to provide a full extent of the storm.
What Does IMERG Do?
This near-real time rainfall estimate comes from the NASA’s IMERG, which combines observations from a fleet of satellites, in near-real time, to provide near-global estimates of precipitation every 30 minutes. By combining NASA precipitation estimates with other data sources, we can gain a greater understanding of major storms that affect our planet.
What the IMERG does is “morph” high-quality satellite observations along the direction of the steering winds to deliver information about rain at times and places where such satellite overflights did not occur. Information morphing is particularly important over the majority of the world’s surface that lacks ground-radar coverage. Basically, IMERG fills in the blanks between weather observation stations.
NASA Researches Tropical Cyclones
Hurricanes/tropical cyclones are the most powerful weather events on Earth. NASA’s expertise in space and scientific exploration contributes to essential services provided to the American people by other federal agencies, such as hurricane weather forecasting.
For more than five decades, NASA has used the vantage point of space to understand and explore our home planet, improve lives and safeguard our future. NASA brings together technology, science, and unique global Earth observations to provide societal benefits and strengthen our nation. Advancing knowledge of our home planet contributes directly to America’s leadership in space and scientific exploration.
Using a NASA satellite rainfall product that incorporates data from satellites and observations, NASA estimated Hurricane Teddy’s rainfall rates. Teddy is a major hurricane in the Central North Atlantic Ocean.
On Sept. 18 at 8 a.m. EDT (1200 UTC), NASA’s IMERG estimated Hurricane Teddy was generating as much as (30 mm/1.18 inches of rain (dark pink) on the western side of its eye. Rainfall throughout most of the storm was occurring between 5 and 15 mm (0.2 to 0.6 inches/yellow and green colors) per hour. The rainfall data was overlaid on infrared imagery from NOAA’s GOES-16 satellite. Credit: NASA/NOAA/NRL
On Sept. 18, NOAA’s National Hurricane Center (NHC) warned that Teddy remains a powerful hurricane over the Central Atlantic Ocean, and large ocean swells are forecast to spread across much of the western Atlantic increasing a rip current threat.
Hurricane Teddy’s Status on Sept. 18
At 5 a.m. EDT (0900 UTC), the center of Hurricane Teddy was located near latitude 21.6 degrees north and longitude 55.4 degrees west. That is about 550 miles (890 km) east-northeast of the Northern Leeward Islands, and about 935 miles (1,510 km) southeast of Bermuda.
Teddy is moving toward the northwest near 12 mph (19 kph) and this general motion is expected to continue for the next couple of days, followed by a turn to the north by early next week. Maximum sustained winds are near 130 mph (215 kph) with higher gusts. Teddy is a category 4 hurricane on the Saffir-Simpson Hurricane Wind Scale. Some fluctuations in strength are expected during the next day or so. The estimated minimum central pressure is 947 millibars.
Estimating Teddy’s Rainfall Rates from Space
NASA’s Integrated Multi-satellitE Retrievals for GPM or IMERG, which is a NASA satellite rainfall product, estimated on Sept. 18 at 8 a.m. EDT (1200 UTC), Hurricane Teddy was generating as much as 30 mm (1.18 inches) of rain per hour on the western side of its eye. That was the area of where the heaviest rainfall was occurring.
Rainfall throughout most of the rest of the storm was estimated as falling at a rate between 5 and 15 mm (0.2 to 0.6 inches) per hour. At the U.S. Naval Laboratory in Washington, D.C., the IMERG rainfall data was overlaid on infrared imagery from NOAA’s GOES-16 satellite to provide a full extent of the storm.
“Teddy remains a powerful category 4 hurricane with a well-defined eye and intense eyewall,” said John Cangialosi Senior Hurricane Specialist at NHC in Miami, Fla. “There have been occasional dry slots that have eroded some of the convection in the eyewall and rain bands, but these seem to be transient.”
What Does IMERG Do?
This near-real time rainfall estimate comes from the NASA’s IMERG, which combines observations from a fleet of satellites, in near-real time, to provide near-global estimates of precipitation every 30 minutes. By combining NASA precipitation estimates with other data sources, we can gain a greater understanding of major storms that affect our planet.
Instead, what the IMERG does is “morph” high-quality satellite observations along the direction of the steering winds to deliver information about rain at times and places where such satellite overflights did not occur. Information morphing is particularly important over the majority of the world’s surface that lacks ground-radar coverage. Basically, IMERG fills in the blanks between weather observation stations.
NHC Key Messages for Teddy
The NHC issued key messages for Teddy, including about its forecast track and the ocean swells it is generating.
NHC said Teddy is expected to approach Bermuda as a hurricane this weekend and make its closest approach to the island late Sunday or Monday (Sept. 20 or 21). While the exact details of Teddy’s track and intensity near the island are not yet known, the risk of strong winds, storm surge, and heavy rainfall on Bermuda is increasing.
Large swells produced by Teddy are expected to affect portions of the Leeward Islands, the Greater Antilles, the Bahamas, Bermuda, and the southeastern United States during the next few days. These swells could cause life-threatening surf and rip current conditions.
NASA Researches Tropical Cyclones
Hurricanes/tropical cyclones are the most powerful weather events on Earth. NASA’s expertise in space and scientific exploration contributes to essential services provided to the American people by other federal agencies, such as hurricane weather forecasting.
For more than five decades, NASA has used the vantage point of space to understand and explore our home planet, improve lives and safeguard our future. NASA brings together technology, science, and unique global Earth observations to provide societal benefits and strengthen our nation. Advancing knowledge of our home planet contribues directly to America’s leadership in space and scientific exploration.
Sep. 18, 2020 – NASA-NOAA’s Suomi NPP Satellite Finds Tropical Storm Noul Fading over Laos
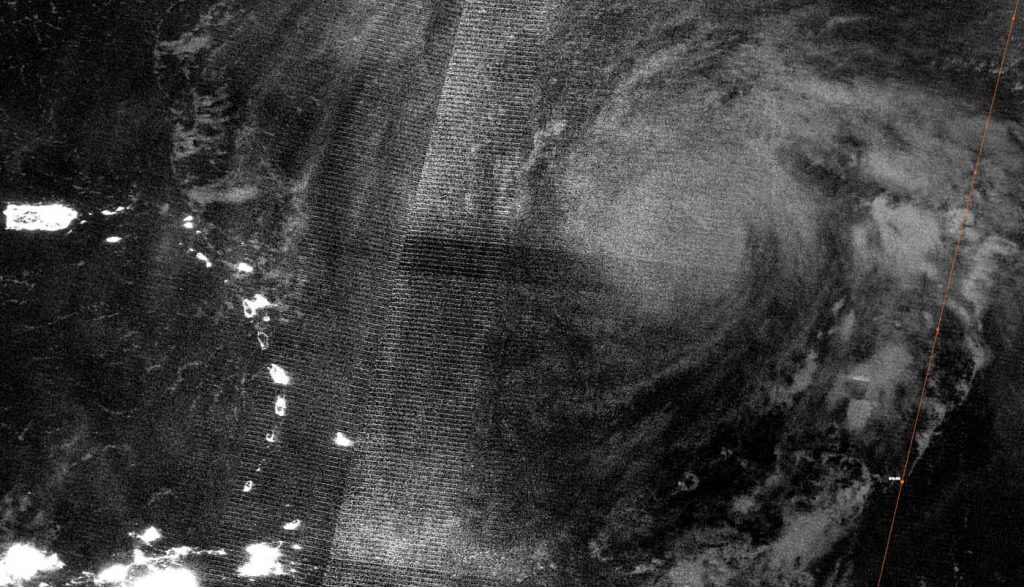
Tropical Storm Noul made landfall in central Vietnam on Sept. 17 and NASA-NOAA’s Suomi NPP satellite captured an image of the storm over Laos. Noul was weakening as it moves toward Thailand where it is forecast to dissipate.
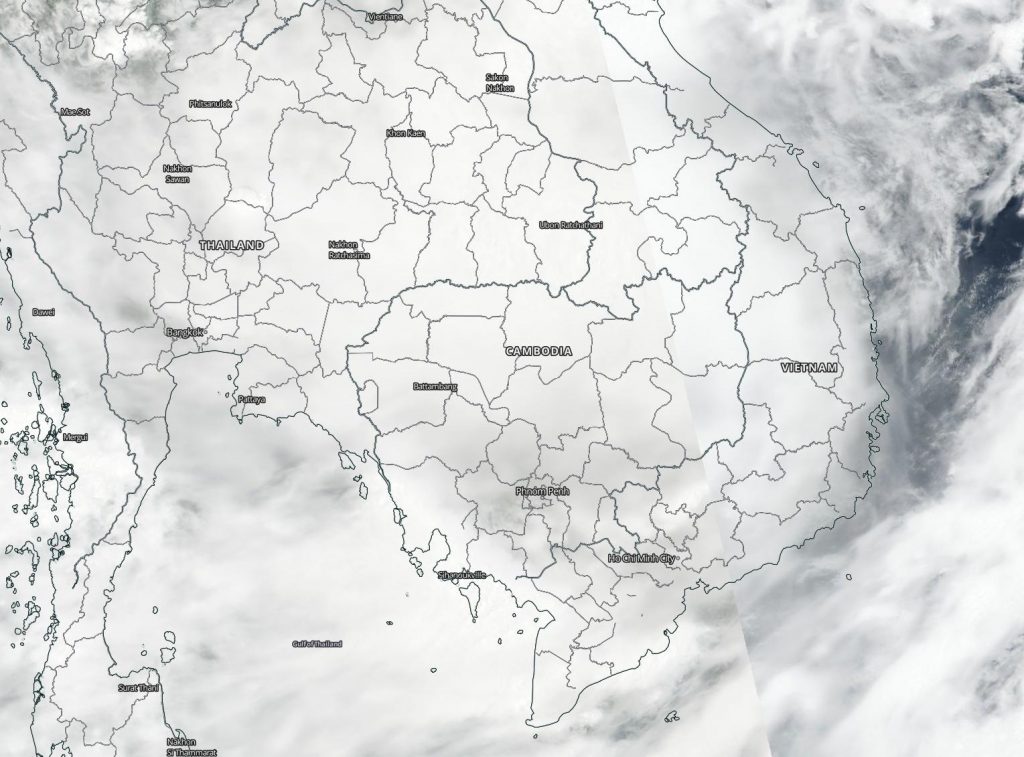
NASA-NOAA’s Suomi NPP satellite provided forecasters with a visible image of Tropical Storm Noul over Laos on Sept. 18. It is expected to dissipate over Thailand in a day. Credit: NASA Worldview, Earth Observing System Data and Information System (EOSDIS)
The Joint Typhoon Warning Center (JTWC) reported that the system made landfall just north of Hue, Vietnam at about 0100 UTC on Sept. 18 (9 p.m. EDT on Sept. 17) and had begun to track inland.
On Sept. 18 at 3 a.m. EDT (0700 UTC/2 p.m. Vietnam local time), the VIIRS instrument aboard the Suomi NPP satellite provided a visible image of Noul as it moved into Thailand. The storm appeared shapeless and the low-level center was difficult to find. Deep convection is obscuring the low-level circulation center which has tracked inland and is located over Laos.
By 5 a.m. EDT (0900 UTC), JTWC issued the final bulletin on the storm. At that time, Tropical storm Noul was located near latitude 16.4 degrees north and longitude 104.4 degrees east, about 174 nautical miles west of Da Nang, Vietnam and over Laos. It was moving to the west and had maximum sustained winds 40 knots (46 mph/74 kph).
Noul is now dissipating as it moves toward Thailand.
NASA Researches Tropical Cyclones
Hurricanes/tropical cyclones are the most powerful weather events on Earth. NASA’s expertise in space and scientific exploration contributes to essential services provided to the American people by other federal agencies, such as hurricane weather forecasting.
For more than five decades, NASA has used the vantage point of space to understand and explore our home planet, improve lives and safeguard our future. NASA brings together technology, science, and unique global Earth observations to provide societal benefits and strengthen our nation. Advancing knowledge of our home planet contributes directly to America’s leadership in space and scientific exploration.
Sep. 17, 2020 – NASA Finds Tropical Storm Noul Packing a Punch
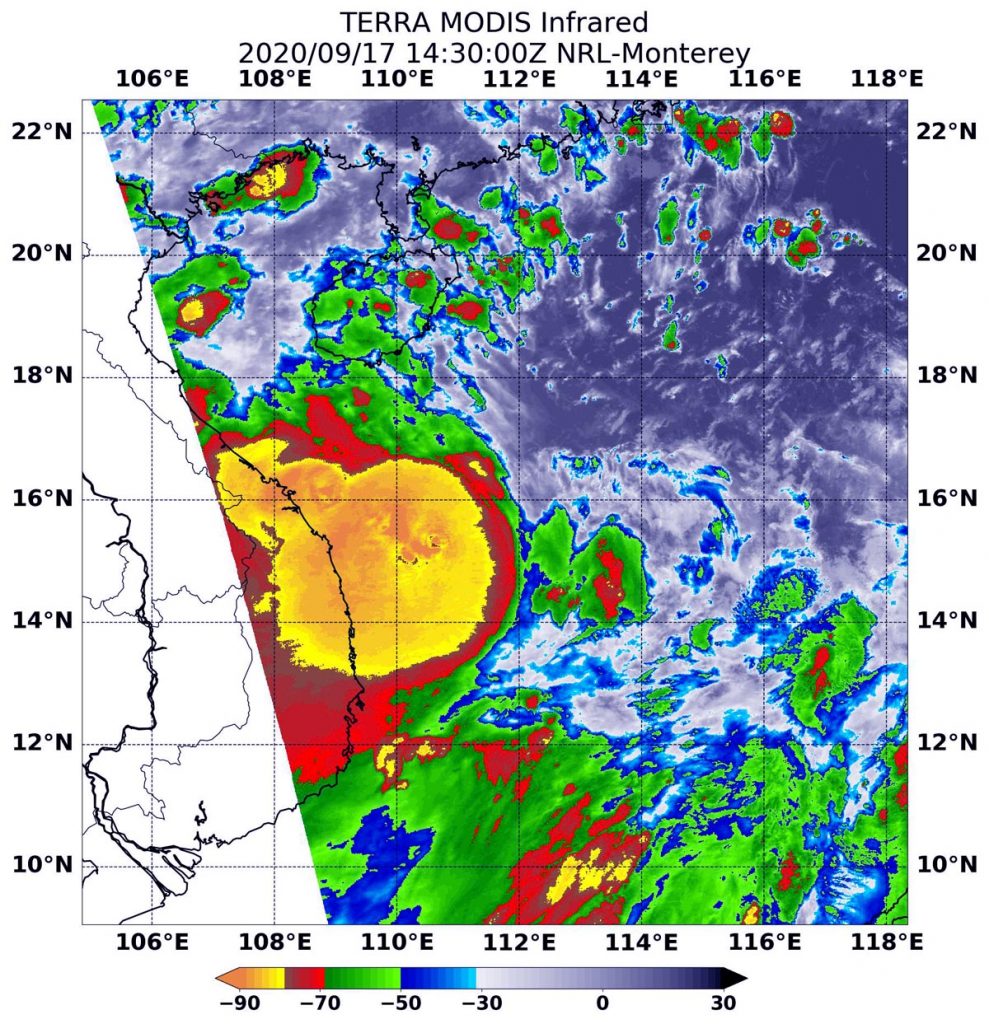
Powerful storms with heavy rainmaking capabilities appeared over the coast of central Vietnam in NASA provided infrared imagery on Sept. 17.
On Sept. 17 at 10:30 a.m. EDT (1430 UTC) the MODIS instrument that flies aboard NASA’s Aqua satellite revealed a large area of the most powerful thunderstorms (yellow) were around Noul’s center where cloud top temperatures were as cold as minus 80 degrees Fahrenheit (minus 62.2 Celsius). Those storms were over the central Vietnam coast and extended over the South China Sea. Strong storms (red) with cloud top temperatures as cold as minus 70 degrees Fahrenheit (minus 56.6. degrees Celsius) surrounded the center and were generating large amounts of rain. Credit: NASA/NRL
NASA’s Infrared Data Reveals Heavy Rainmakers
Tropical cyclones are made up of hundreds of thunderstorms, and infrared data can show where the strongest storms are located. That is because infrared data provides temperature information, and the strongest thunderstorms that reach highest into the atmosphere have the coldest cloud top temperatures.
On Sept. 17 at 10:30 a.m. EDT (1430 UTC), the Moderate Imaging Spectroradiometer or MODIS instrument that flies aboard NASA’s Aqua satellite revealed a large area of the most powerful thunderstorms (yellow) were around Noul’s center where cloud top temperatures were as cold as minus 80 degrees Fahrenheit (minus 62.2 Celsius). Those storms were mostly in the western quadrant of the storm and over the central Vietnam coast and they extended over the South China Sea. Strong storms with cloud top temperatures as cold as minus 70 degrees Fahrenheit (minus 56.6. degrees Celsius) surrounded the center and were generating large amounts of rain.
Noul was encountering some northeasterly vertical wind shear. That is, outside winds blowing from the northeast and pushing the bulk of clouds and precipitation toward the southwest of the center of circulation.
National Centre for Hydro-Meteorological Forecasting (NCHMF) is a governmental organization belonging Vietnam Meteorological Hydrological Administration (VMHA). NCHMF has authority to issue forecasting/warning information for weather, climate, hydrology, water resource, marine weather (i.e. hydrometeorology) and provide hydrometeorology services. NHCMF has issued coastal warnings for central Vietnam. Those warnings can be found on their website: https://nchmf.gov.vn/KttvsiteE/en-US/2/index.html.
Noul’s Status on Sept. 17
At 11 a.m. EDT (1500 UTC), Noul had maximum sustained winds near 45 knots. It was located over the coastline of central Vietnam, near latitude 15.9 degrees north and longitude 110.9 degrees east, about 191 nautical miles east of Da Nang, Vietnam. Noul was moving to the west and is forecast to move across Laos and Thailand over the next couple of days as it weakens due to interaction with land.
NASA Researches Earth from Space
For more than five decades, NASA has used the vantage point of space to understand and explore our home planet, improve lives and safeguard our future. NASA brings together technology, science, and unique global Earth observations to provide societal benefits and strengthen our nation. Advancing knowledge of our home planet contributes directly to America’s leadership in space and scientific exploration.
Sep. 17, 2020 – NASA-NOAA Satellite Catches Nighttime View of Major Hurricane Teddy
An early morning infrared image of Hurricane Teddy taken from NASA-NOAA’s Suomi NPP satellite shows the proximity of the strengthening hurricane to the Lesser Antilles island chain and Puerto Rico. Teddy is a major hurricane on the Saffir-Simpson Hurricane Wind Scale.
NASA-NOAA’s Suomi NPP satellite passed the North Atlantic Ocean overnight on Sept. 17 at 12:40 a.m. EDT (0440 UTC) and captured a nighttime image of Hurricane Teddy. Puerto Rico and the Lesser Antilles can be seen lit up to the west (left).Credit: NASA Worldview, Earth Observing System Data and Information System (EOSDIS)
NASA-NOAA’s Suomi NPP satellite passed the North Atlantic Ocean overnight on Sept. 17 at 12:40 a.m. EDT (0440 UTC). The Visible Infrared Imaging Radiometer Suite (VIIRS) instrument aboard Suomi NPP provided a nighttime image of Hurricane Teddy. Puerto Rico and the Lesser Antilles can be seen lit up by night lights to the west in the image. The Lesser Antilles a group of islands that frame the eastern side of the Caribbean Sea.
The image was created using the NASA Worldview application at NASA’s Goddard Space Flight Center in Greenbelt, Md.
By 11 a.m. EDT infrared imagery revealed Teddy’s satellite appearance had steadily developed. There is now a ragged warming eye surrounded by a ring of convection with cloud tops colder than minus 76 degrees Fahrenheit/minus 60 degrees Celsius.
Teddy’s Status on Sept. 17
At 11 a.m. EDT (1500 UTC), National Hurricane Center (NHC) said the center of Hurricane Teddy was located near latitude 19.3 degrees north and longitude 53.0 degrees west. Teddy was about 610 miles (980 km) east-northeast of the Lesser Antilles.
Teddy is moving toward the northwest near 12 mph (19 kph) and this motion is expected to continue for the next few days. Maximum sustained winds were near 120 mph (195 kph) with higher gusts. Teddy is a category 3 hurricane on the Saffir-Simpson Hurricane Wind Scale. The estimated minimum central pressure is 957 millibars.
Teddy’s Forecast
Some additional strengthening is possible through tonight as Teddy moves northwest. A slow weakening trend is expected to begin over the weekend.
About NASA’s EOSDIS Worldview
NASA’s Earth Observing System Data and Information System (EOSDIS) Worldview application provides the capability to interactively browse over 700 global, full-resolution satellite imagery layers and then download the underlying data. Many of the available imagery layers are updated within three hours of observation, essentially showing the entire Earth as it looks “right now.”
NASA Researches Earth from Space
For more than five decades, NASA has used the vantage point of space to understand and explore our home planet, improve lives and safeguard our future. NASA brings together technology, science, and unique global Earth observations to provide societal benefits and strengthen our nation. Advancing knowledge of our home planet contributes directly to America’s leadership in space and scientific exploration.
Sep. 17, 2020 – NASA Finds a Fading Wispy Tropical Depression Vicky
NASA’s Terra satellite found Vicky to be a shadow of its former self, devoid of precipitation around its low-level center. Any precipitation had been pushed far to the northeast from wind shear. Vicky looked like a wispy ring of clouds on visible satellite imagery and nearby Hurricane Teddy is not helping.
On Sept. 17 at 9:25 a.m. EDT (1325 UTC), the MODIS instrument aboard NASA’s Terra satellite provided a visible image of Vicky in the eastern North Atlantic Ocean. The image showed a swirl of wispy clouds around the low-level center with the bulk of clouds pushed far to the east-northeast of the center. Credit: NASA/NRL
On Sept. 17 at 9:25 a.m. EDT (1325 UTC), the Moderate Resolution Imaging Spectroradiometer or MODIS instrument aboard NASA’s Terra satellite provided a visible image of Vicky in the eastern North Atlantic Ocean. The image showed a swirl of wispy clouds around the low-level center with the bulk of clouds pushed far to the east-northeast of the center.
Dan Brown, a Senior Hurricane Specialist at NOAA’s National Hurricane Center in Miami, Fla. noted at 11 a.m. EDT on Sept. 17, “Vicky is feeling the effects of very strong upper-level winds associated with the outflow of Hurricane Teddy. These winds have caused the remaining convection to be stripped well away from the center, and recent ASCAT (a scatterometer instrument that measures winds) data indicates that Vicky has weakened to a tropical depression.”
Wind Shear Battering Vicky
Wind shear, that is, outside winds blowing at different directions at different levels in the atmosphere are battering Vicky. The NHC indicated that vertical wind shear of 40 to 50 knots is forecast to continue plaguing Vicky and the cyclone should continue to weaken and become a remnant low later today.
Vicky’s Status on Sept. 17
At 11 a.m. EDT (1500 UTC), the center of Tropical Depression Vicky was located near latitude 21.4 degrees north and longitude 38.2 degrees west. That is about 1,000 miles (1,610 km) west-northwest of the Cabo Verde Islands. The depression was moving toward the west near 14 mph (22 kph). Satellite wind data indicate that the maximum sustained winds have decreased to near 35 mph (55 kph) with higher gusts. The estimated minimum central pressure was 1008 millibars.
Vicky’s Fatal Forecast
A turn toward the west-southwest is expected later today, and that motion should continue through Friday. Additional weakening is forecast during the next day or so, and Vicky is expected to become a remnant low later today. The cyclone is forecast to dissipate Friday night or early Saturday, Sept. 19.
NASA Researches Earth from Space
For more than five decades, NASA has used the vantage point of space to understand and explore our home planet, improve lives and safeguard our future. NASA brings together technology, science, and unique global Earth observations to provide societal benefits and strengthen our nation. Advancing knowledge of our home planet contributes directly to America’s leadership in space and scientific exploration.
Sep. 17, 2020 – NASA Analyzes Rainfall and Rainmaking Capability in Hurricane Sally
NASA satellites provided a look at the rainfall potential in Hurricane Sally before and after it made landfall in southern Alabama. NASA’s Aqua satellite and IMERG analysis were used to analyze the storm’s flooding potential.
NASA’s Aqua satellite provided a visible image of Sally at 1:30 p.m. EDT on Sept. 16 about 8 hours after landfall in southern Alabama. Sally then continued a slow trek through Alabama. Credit: NASA Worldview, Earth Observing System Data and Information System (EOSDIS)
Sally came ashore on Wednesday, Sept. 16 around 5:45 a.m. EDT near Gulf Shores, Alabama. It was a Category 2 storm on the Saffir-Simpson Hurricane Wind scale with sustained winds near 105 mph (169 kph). As a slow-moving storm, Sally generated a lot of rainfall, left behind flooded streets and knocked out power to hundreds of thousands on the U.S. Gulf Coast.
NASA’s Infrared View of Sally
Cloud top temperatures provide information to forecasters about where the strongest storms are located within a tropical cyclone. Tropical cyclones do not always have uniform strength, and some sides are stronger than others. The stronger the storms, the higher they extend into the troposphere, and the colder the cloud top temperatures. NASA provides that data to forecasters at NOAA’s National Hurricane Center or NHC so they can incorporate it in their forecasting.
On Sept. 16 at 3:11 p.m. EDT (1911 UTC) NASA’s Aqua satellite analyzed Sally using the Atmospheric Infrared Sounder or AIRS instrument. AIRS found coldest cloud top temperatures as cold as or colder than minus 63 degrees Fahrenheit (minus 53 degrees Celsius) around the center of circulation and to the northeast and east of the center. NASA research has shown that cloud top temperatures that cold indicate strong storms that have the capability to create heavy rain.
On Sept. 16 at 3:11 p.m. EDT (1911 UTC) NASA’s Aqua satellite analyzed Sally using the Atmospheric Infrared Sounder or AIRS instrument. AIRS found coldest cloud top temperatures as cold as or colder than minus 63 degrees Fahrenheit (minus 53 degrees Celsius) around the center of circulation and to the northeast and east of the center. NASA research has shown that cloud top temperatures that cold indicate strong storms that have the capability to create heavy rain. Credit: NASA JPL/Heidar Thrastarson
At that time, the AIRS image showed those strong storms over the Florida Panhandle, much of Alabama, Georgia and extending into western South Carolina.
On Sept. 16 at 3:11 p.m. EDT (1911 UTC) NASA’s Aqua satellite analyzed Sally using the Atmospheric Infrared Sounder or AIRS instrument. AIRS found the coldest cloud top temperatures as cold as or colder than minus 63 degrees Fahrenheit (minus 53 degrees Celsius) around the center of circulation and to the northeast and east of the center. NASA research has shown that cloud top temperatures that cold indicate strong storms that have the capability to create heavy rain. Credit: NASA JPL/Heidar ThrastarsonNASA Calculates Sally’s Rainfall
NASA combined data from multiple satellites to estimate the rainfall from Hurricane Sally in near-real time at half-hourly intervals from September 11-16, 2020. Rainfall rates and rainfall accumulations are estimated using NASA’s Integrated Multi-satellitE Retrievals for GPM (IMERG) algorithm. IMERG combines observations from a fleet of satellites, in near-real time, to provide near-global estimates of precipitation every 30 minutes.
NASA IMERG combined data from multiple satellites to estimate the rainfall from Hurricane Sally in near-real time at half-hourly intervals from September 11 to 16, 2020. This animation shows rainfall rates (blue/yellow shading) and rainfall accumulations (green shading) from NASA’s IMERG algorithm, overlaid on shades of white/gray cloud data from NOAA infrared satellite instruments. The multi-colored line shows Sally’s track based on National Hurricane Center advisories, with orange indicating hurricane strength winds. Credit: NASA/Jason West
Rain rates along Sally’s track periodically exceeded 1 inch/hour near its core and combined with its slow speed, led to high accumulations along the Gulf Coast. By 5:00 a.m. CDT (1000 UTC) on Sep. 16, IMERG had estimated total accumulations along the southern Alabama coastline and western Florida Panhandle exceeding 16 inches in some locations. NOAA rain gauge observations were broadly consistent with the IMERG accumulations.
Sally Breaks a Pensacola Rainfall Record
The National Weather Service at the Pensacola Regional Airport in Florida reported 18.17 inches of rainfall from Sally on Sept. 16. That broke the previous record of 5.28 inches on that date in 1979.
Forecast for Excessive Rainfall Over the U.S. Southeast
NHC’s key message is about the rainfall from Sally: Widespread flooding is expected from central Georgia through southeastern Virginia. Along the central Gulf Coast, most widespread moderate to major river flooding from the historic rainfall event will crest by the weekend, but rivers will remain elevated well into next week.
NHC Rainfall totals expected as Sally moves across the Southeast U.S. through Friday:
Central Georgia: Sally will produce additional rainfall totals of 3 to 6 inches, with localized higher amounts, on top of 3 to 6 inches, which has already fallen. Widespread flash flooding and minor to moderate river flooding is likely.
Central to upstate South Carolina: 3 to 6 inches, with isolated amounts of 10 inches. Widespread flash flooding and minor to moderate river flooding is likely.
Western to central North Carolina into south-central and southeast Virginia: 4 to 6 inches, isolated amounts up to 8 inches. Flash flooding and widespread minor river flooding is likely.
Sally’s Status on Sept. 17
At 5 a.m. EDT (0900 UTC), the center of Tropical Depression Sally was located near latitude 31.8 degrees north and longitude 85.7 degrees west. The center was about 50 miles (80 km) southeast of Montgomery, Alabama. The depression is moving toward the northeast near 12 mph (19 kph) and a northeastward to east-northeastward motion is expected into Friday.
Maximum sustained winds have decreased to near 30 mph (45 kph) with higher gusts.
The estimated minimum central pressure based on nearby surface observations is 1000 millibars.
Senior Hurricane Specialist Stacy Stewart of NOAA’s National Hurricane Center in Miami, Fla. noted, “Although the overall convective cloud and rain shield in satellite and radar imagery continues to erode, Tropical Depression Sally is still producing significant rainfall across east-central Alabama and west-central and central Georgia. Surface observations and Doppler radar data indicate that Sally has weakened to a 25 knots [29 mph/46 kph] depression over southeastern Alabama.”
Sally’s Forecast Track
NHC says that additional weakening is forecast during the next couple of days, and Sally is expected to become a remnant low by tonight or Friday morning. On the forecast track, the center of Sally will move across southeastern Alabama this morning, over central Georgia this afternoon and evening, and move over South Carolina late tonight into Friday, Sept. 18.
NASA Researches Earth from Space
For more than five decades, NASA has used the vantage point of space to understand and explore our home planet, improve lives and safeguard our future. NASA brings together technology, science, and unique global Earth observations to provide societal benefits and strengthen our nation. Advancing knowledge of our home planet contributes directly to America’s leadership in space and scientific exploration.
Sep. 16, 2020 – NASA-NOAA Satellite Finds a Strengthening Tropical Storm Noul
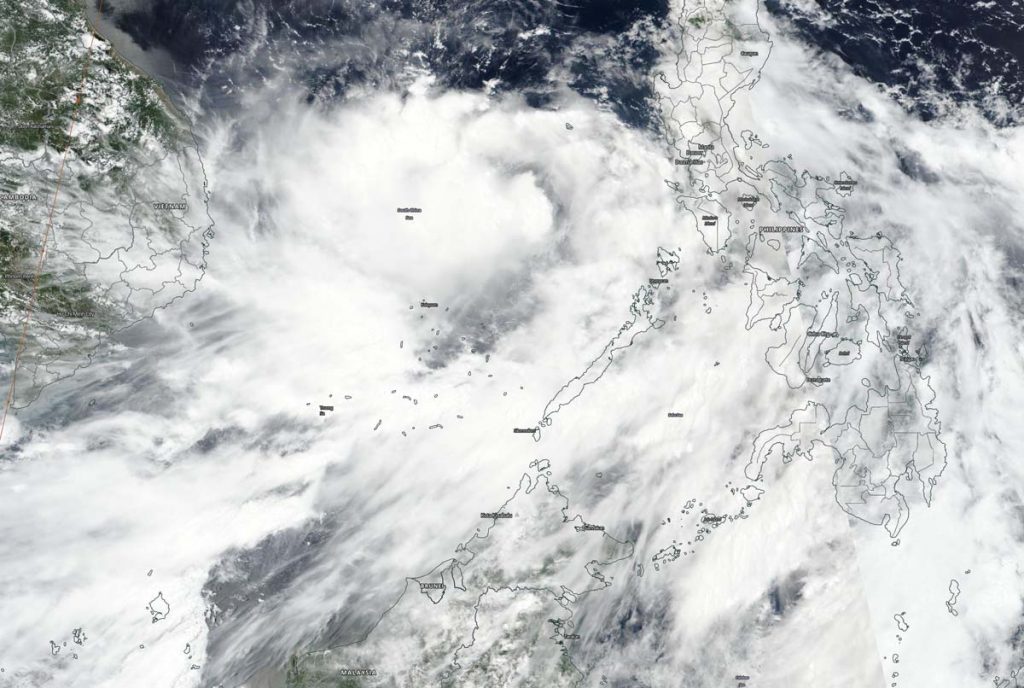
NASA-NOAA’s Suomi NPP satellite passed over the South China Sea and captured a visible image of Tropical Storm Noul as it continued to organize and intensify.
On Sept. 16, NASA-NOAA’s Suomi NPP satellite passed over the South China Sea and captured a visible image of Tropical storm Noul as it continued to strengthen. Credit: NASA Worldview, Earth Observing System Data and Information System (EOSDIS).
Noul formed from a low-pressure area that began on the eastern side of the Philippines. The low crossed the Philippines and developed into Tropical Depression 13W in the Sulu Sea. The depression intensified, consolidated and became a tropical storm renamed Noul.
The Visible Infrared Imaging Radiometer Suite (VIIRS) instrument aboard Suomi NPP provided a visible image of Noul on Sept. 16. The VIIRS imagery and animated enhanced infrared satellite imagery shows building convection and clouds obscuring a partially exposed low-level circulation center. The image also showed some banding of thunderstorms.
At 11 a.m. EDT (1500 UTC) on Sept. 16, the Joint Typhoon Warning Center noted that Tropical storm Noul was located near latitude 13.7 degrees north and longitude 115.6 degrees east. That is about 445 nautical miles east-southeast of Da Nang, Vietnam. Noul is moving to the west-northwest and had maximum sustained winds near 45 knots (52 mph/83 kph). The storm was strengthening in the warm waters of the South China Sea.
Noul is forecast to move west-northwest across the South China Sea. The storm will strengthen to 65 knots (75 mph), just attaining typhoon strength prior to landfall in central Vietnam in one and a half days.
For more than five decades, NASA has used the vantage point of space to understand and explore our home planet, improve lives and safeguard our future. NASA brings together technology, science, and unique global Earth observations to provide societal benefits and strengthen our nation. Advancing knowledge of our home planet contributes directly to America’s leadership in space and scientific exploration.