Sep. 22, 2020 – NASA Catches Tropical Storm Dolphin Swimming North
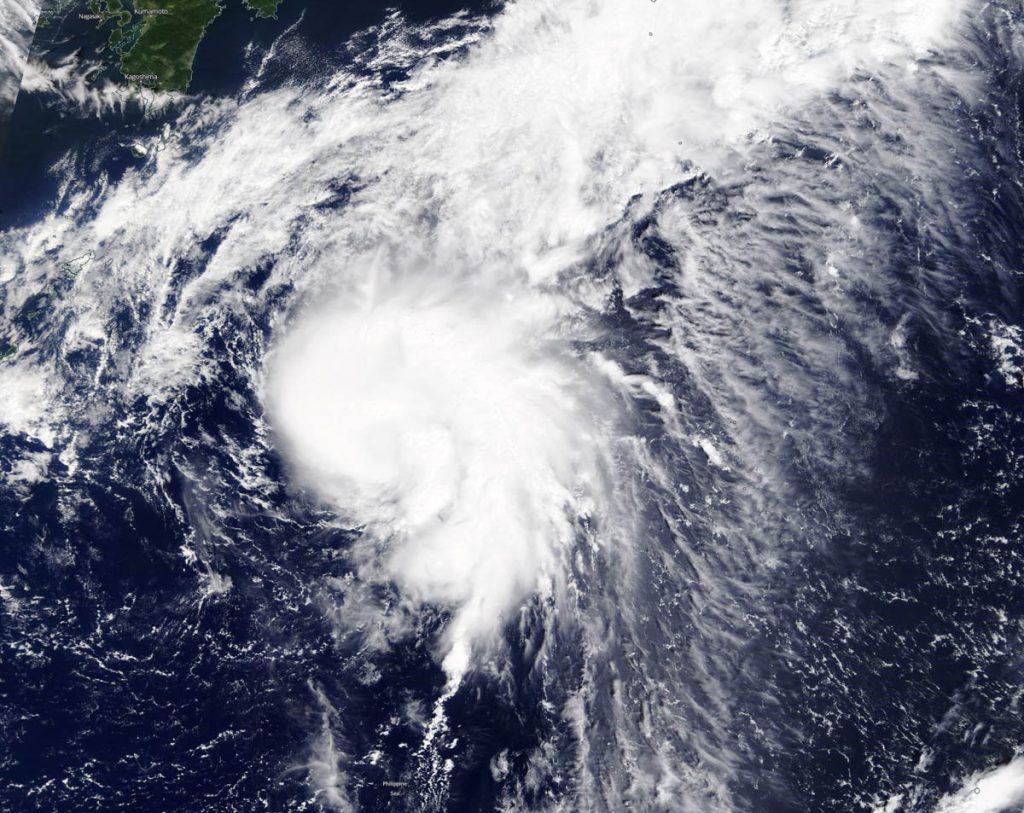
NASA’s Terra satellite obtained visible imagery of Tropical Storm Dolphin as it continued moving north though the Northwestern Pacific Ocean on a track toward east central Japan.
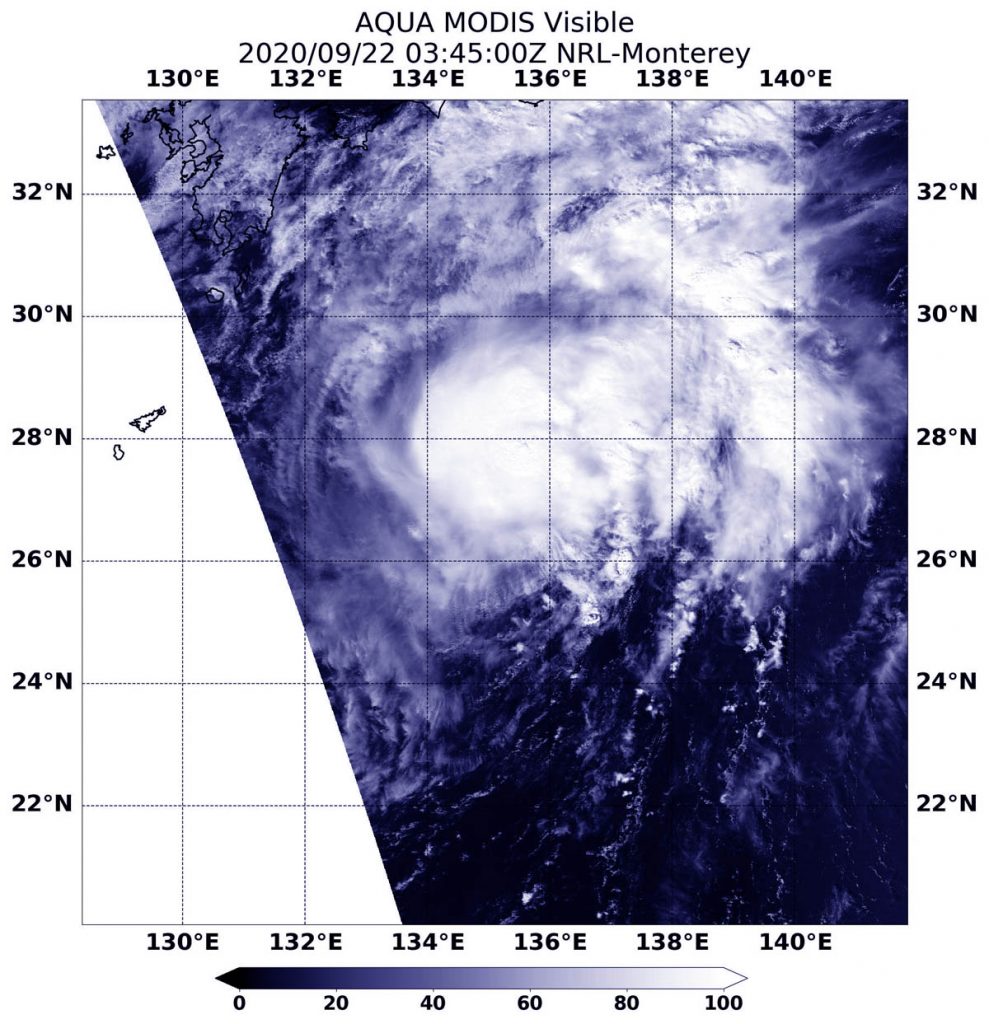
On Sept. 22, 2020, NASA’s Terra satellite provided a visible image of Tropical Storm Dolphin as it continued moving north through the Northwestern Pacific Ocean. Credit: NASA/NRL
NASA Satellite View: Dolphin’s Organization
The Moderate Resolution Imaging Spectroradiometer or MODIS instrument that flies aboard NASA’s Terra satellite captured a visible image of Tropical Storm Dolphin on Sept. 22 at 0345 UTC (Sept. 21 at 11:45 p.m. EDT). The visible image revealed strong storms around the low-level center of circulation with bands of thunderstorms in the northeastern quadrant. Microwave satellite imagery revealed an eye feature.
The Joint Typhoon Warning Center noted that another satellite image indicates that the upper-level circulation center is tilted about 30 nautical miles east of the low-level center due to increasing westerly vertical wind shear.
NASA’s Terra satellite is one in a fleet of NASA satellites that provide data for hurricane research.
Dolphin on Sept. 22
At 5 a.m. EDT (0900 UTC) on Sept. 22 Tropical storm Dolphin was located near latitude 27.9 degrees north and longitude 135.5 degrees east, about 493 nautical miles south-southwest of Yokosuka, Japan. Dolphin was moving to the north and had maximum sustained winds 60 knots (69 mph/111 kph).
Dolphin will move north, later turning to the northeast. It is expected to weaken gradually before becoming extra-tropical near Tokyo.
NASA Researches Earth from Space
For more than five decades, NASA has used the vantage point of space to understand and explore our home planet, improve lives and safeguard our future. NASA brings together technology, science, and unique global Earth observations to provide societal benefits and strengthen our nation. Advancing knowledge of our home planet contributes directly to America’s leadership in space and scientific exploration.
Sep. 22, 2020 – NASA Analyzes Tropical Storm Lowell’s Very Cold Cloud Tops
NASA analyzed the cloud top temperatures in Tropical Storm Lowell using infrared light to determine the strength of the storm. Infrared imagery revealed that the strongest storms were around Lowell’s center and in its southern quadrant because of northerly wind shear.
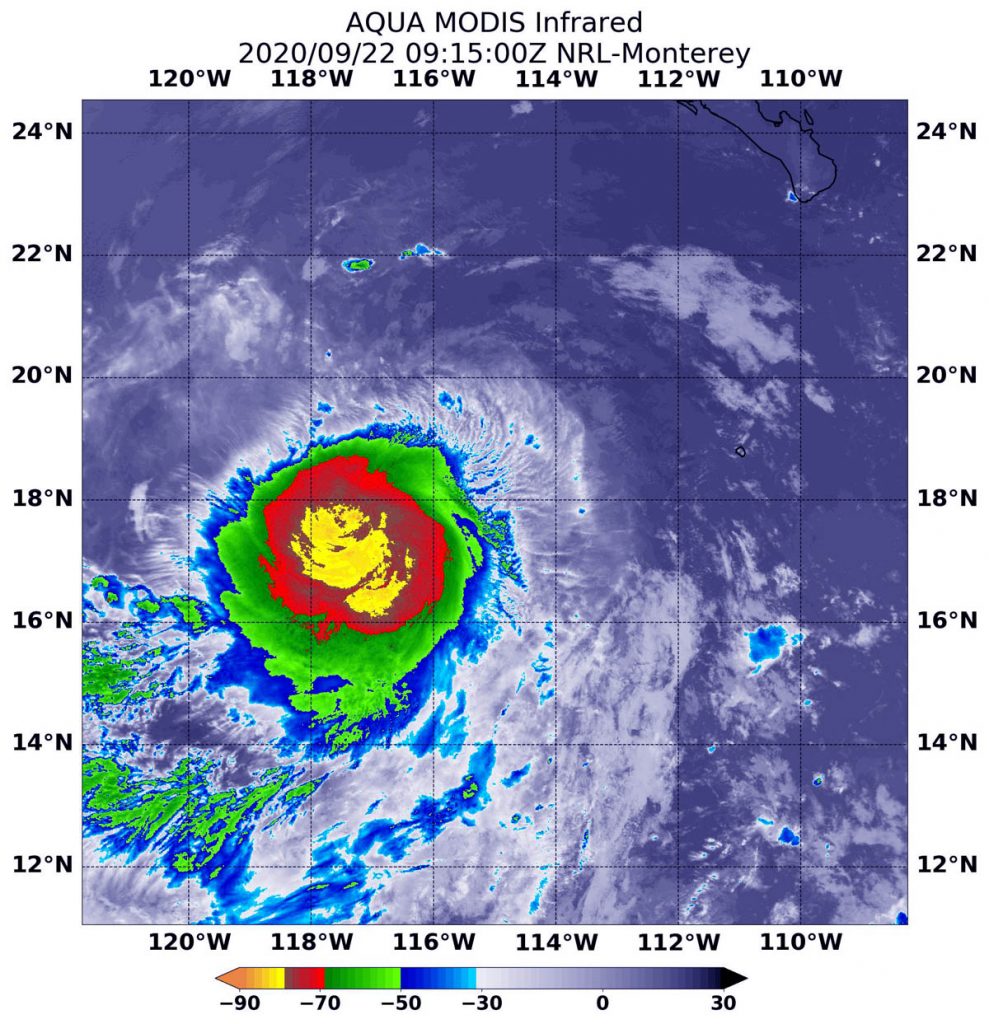
On Sept. 22 at 4:15 a.m. EDT (0915 UTC) NASA’s Aqua satellite analyzed Tropical Storm Lowell’s cloud top temperatures and found strongest storms (yellow) were around Lowell’s center of circulation and pushed into its southern quadrant. Temperatures in those areas were as cold as minus 80 degrees Fahrenheit (minus 62.2 Celsius). An area of strong storms with cloud top temperatures as cold as minus 70 degrees (red) Fahrenheit (minus 56.6. degrees Celsius) surrounded the center. Credit: NASA/NRL
Tropical Storm Lowell developed about 500 miles away from Baja California, Mexico. On Sept. 21, it formed as Tropical Depression 17E. By 5 p.m. EDT, the depression organized and strengthened into a tropical storm and was renamed Lowell.
Lowell is Battling Wind Shear
“Lowell continues to be affected by north-northeasterly shear, and the center is estimated to be located near the north-northeastern edge of the main convective mass,” said Senior Hurricane Specialist Richard Pasch at NOAA’s National Hurricane Center in Miami, Fla.
In general, wind shear is a measure of how the speed and direction of winds change with altitude. Tropical cyclones are like rotating cylinders of winds. Each level needs to be stacked on top each other vertically in order for the storm to maintain strength or intensify. Wind shear occurs when winds at different levels of the atmosphere push against the rotating cylinder of winds, weakening the rotation by pushing it apart at different levels.
An Infrared View of Lowell
One of the ways NASA researches tropical cyclones is using infrared data that provides temperature information. Cloud top temperatures identify where the strongest storms are located. The stronger the storms, the higher they extend into the troposphere, and the colder the cloud top temperatures.
On Sept. 22 at 4:15 a.m. EDT (0915 UTC) NASA’s Aqua satellite analyzed the storm using the Moderate Resolution Imaging Spectroradiometer or MODIS instrument. The MODIS imagery showed the strongest storms were around Lowell’s center of circulation and pushed into its southern quadrant. Temperatures in those areas were as cold as minus 80 degrees Fahrenheit (minus 62.2 Celsius). An area of strong storms with cloud top temperatures as cold as minus 70 degrees Fahrenheit (minus 56.6. degrees Celsius) surrounded the center. NASA research has shown that cloud top temperatures that cold indicate strong storms that have the capability to create heavy rain.
NASA then provides data to tropical cyclone meteorologists so they can incorporate it in their forecasts.
Lowell’s Status on Sept. 22
At 5 a.m. EDT (0900 UTC) on Sept. 22, the center of Tropical Storm Lowell was located near latitude 18.0 degrees north and longitude 115.6 degrees west. That is about 500 miles (805 km) southwest of the southern tip of Baja California, Mexico. Lowell is moving toward the west-northwest near 13 mph (20 kph). Maximum sustained winds are near 45 mph (75 kph) with higher gusts. The estimated minimum central pressure is 1001 millibars.
Lowell’s Forecast
Some strengthening is forecast during the next couple of day as Lowell continues to move away from land areas and in a west-northwest direction followed by a turn toward the west. Lowell is no threat to land areas.
NASA Researches Earth from Space
For more than five decades, NASA has used the vantage point of space to understand and explore our home planet, improve lives and safeguard our future. NASA brings together technology, science, and unique global Earth observations to provide societal benefits and strengthen our nation. Advancing knowledge of our home planet contributes directly to America’s leadership in space and scientific exploration.
Sep. 22, 2020 – NASA Sees Hurricane Teddy Threaten Eastern Canada
NASA’s Aqua satellite used infrared light to identify strongest storms and coldest cloud top temperatures in Hurricane Teddy as it nears eastern Canada. Teddy has triggered multiple warnings and watches.
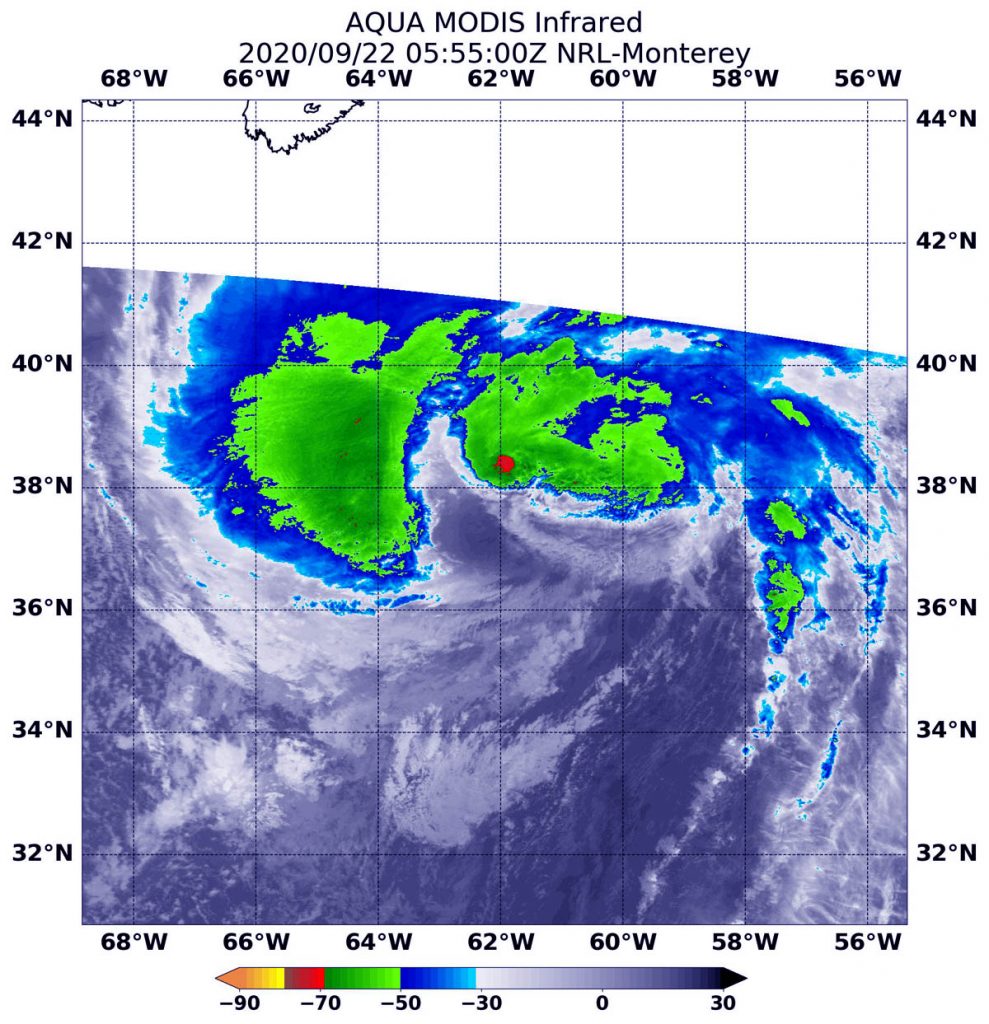
On Sept. 22 at 1:55 a.m. EDT (0555 UTC), the MODIS instrument aboard NASA’s Aqua satellite gathered temperature information about Teddy’s cloud tops. MODIS found the most powerful thunderstorms (red) were in a very small area near the center where temperatures were as cold as or colder than minus 70 degrees Fahrenheit (minus 56.6 Celsius). Most of the rest of the storm had cloud top temperatures as cold as or colder than minus 63 degrees Fahrenheit (minus 53 degrees Celsius). Credit: NASA/NRL
Warnings and Watches on Sept. 22
NOAA’s National Hurricane Center noted that a Tropical Storm Warning is in effect for the south coast of Nova Scotia from Digby to Meat Cove, Canada.
A Tropical Storm Watch is in effect from Meat Cove to Tidnish, Nova Scotia, from north of Digby to Fort Lawrence, Nova Scotia. A Watch is also in effect for the Magdalen Islands, Quebec, for Port aux Basques to Francois, Newfoundland and for Prince Edward Island.
Infrared Data Reveals Powerful Storms
On Sept. 22 at 1:55 a.m. EDT (0555 UTC), the Moderate Resolution Imaging Spectroradiometer or MODIS aboard NASA’s Aqua satellite gathered temperature information about Teddy’s cloud tops. MODIS found the most powerful thunderstorms were in a very small area near the center where temperatures were as cold as or colder than minus 70 degrees Fahrenheit (minus 56.6 Celsius). Most of the rest of the storm had cloud top temperatures as cold as or colder than minus 63 degrees Fahrenheit (minus 53 degrees Celsius). Cloud top temperatures that cold indicate strong storms with the potential to generate heavy rainfall.
Recent satellite imagery shows that the central convection is diminishing, with a comma-like cloud pattern developing.
Teddy’ Status on Sept. 22
At 8 a.m. EDT (1200 UTC) on Sept. 22, the center of Hurricane Teddy was located near latitude 39.3 degrees north and longitude 63.5 degrees west. That is about 365 miles (590 km) south of Halifax, Nova Scotia, Canada.
Teddy is moving toward the north-northwest near 28 mph (44 kph), and a turn toward the north-northeast is expected by early Wednesday. Maximum sustained winds are near 105 mph (165 kph) with higher gusts. Teddy is a large hurricane. Hurricane-force winds extend outward up to 105 miles (165 km) from the center and tropical-storm-force winds extend outward up to 400 miles (645 km). The estimated minimum central pressure is 950 millibars.
Teddy’s Forecast
On the forecast track, the center will move over eastern Nova Scotia on Wednesday, Sept. 23 and then near or over Newfoundland by Wednesday night. Although some weakening is likely later today and Wednesday, Teddy should be a strong post-tropical cyclone when it moves near and over Nova Scotia.
NHC Key Messages
The National Hurricane Center’s key messages are:
WIND: Tropical storm conditions are expected to begin in the warning area by this afternoon. Tropical storm conditions could begin in the watch areas late today or early Wednesday.
SURF: Large swells generated by Teddy are affecting Bermuda, the Lesser Antilles, the Greater Antilles, the Bahamas, the east coast of the United States, and Atlantic Canada. These swells are likely to cause life-threatening surf and rip current conditions.
RAINFALL: Through Thursday, Teddy is expected to produce rainfall accumulations of 2 to 4 inches (50 to 100 mm) with isolated totals of 6 inches (150 mm) across sections of Atlantic Canada.
STORM SURGE: A dangerous storm surge is expected to produce significant coastal flooding near and to the east of where the center makes landfall in Nova Scotia. Near the coast, the surge will be accompanied by very large and destructive waves.
NASA Researches Tropical Cyclones
Hurricanes/tropical cyclones are the most powerful weather events on Earth. NASA’s expertise in space and scientific exploration contributes to essential services provided to the American people by other federal agencies, such as hurricane weather forecasting.
For more than five decades, NASA has used the vantage point of space to understand and explore our home planet, improve lives and safeguard our future. NASA brings together technology, science, and unique global Earth observations to provide societal benefits and strengthen our nation. Advancing knowledge of our home planet contributes directly to America’s leadership in space and scientific exploration.
Sep. 22, 2020 – NASA Imagery Reveals Strongest Areas of Tropical Storm Beta
NASA’s Aqua satellite analyzed Tropical Storm Beta in infrared imagery to determine where the strongest parts of the storm were located. Beta is expected to stall inland over Texas today, Sept. 21, and heavy rains will continue over portions of the middle and upper Texas coast.
On Sept. 21 at 3:29 p.m. EDT (1929 UTC) NASA’s Aqua satellite analyzed Tropical Storm Beta using the Atmospheric Infrared Sounder or AIRS instrument. AIRS found coldest cloud top temperatures as cold as or colder than (purple) minus 63 degrees Fahrenheit (minus 53 degrees Celsius) northeast of the center and in a band of thunderstorms southeast of center. Credit: NASA JPL/Heidar Thrastarson
Beta’s center has continued to move farther inland since making landfall on the southern end of the Matagorda Peninsula around 11 p.m. EDT on Sept. 21.
One of the ways NASA researches tropical cyclones is by using infrared data that provides temperature information. The AIRS instrument aboard NASA’s Aqua satellite captured a look at those temperatures in Beta and gave insight into the size of the storm and its rainfall potential.
Infrared Data Shows Storms with Greatest Rainfall Potential
Cloud top temperatures provide information to forecasters about where the strongest storms are located within a tropical cyclone. Tropical cyclones do not always have uniform strength, and some sides are stronger than others. The stronger the storms, the higher they extend into the troposphere, and the colder the cloud top temperatures. NASA provides that data to forecasters at NOAA’s National Hurricane Center or NHC so they can incorporate into their forecasting.
The heavy rains that have been occurring over the Texas coast were found in infrared imagery from NASA. On Sept. 21 at 3:29 p.m. EDT (1929 UTC) NASA’s Aqua satellite analyzed Tropical Storm Beta using the Atmospheric Infrared Sounder or AIRS instrument. AIRS found coldest cloud top temperatures as cold as or colder than minus 63 degrees Fahrenheit (minus 53 degrees Celsius) around the center and in a thick band of storms southeast of Beta’s center. Those storms were just offshore from southeastern Louisiana and over the northern Gulf of Mexico. NASA research has shown that cloud top temperatures that cold indicate strong storms that have the capability to create heavy rain.
This snapshot of the storms that have the greatest rainfall potential help forecasters determine what areas are more subject to flooding. NOAA’s GOES-East satellite stays in a fixed position over the eastern U.S. and provides continuous infrared imagery that enables forecasters to see the movement of the areas of strongest storms.
Warnings and Watches on Sept. 21
NOAA’s National Hurricane Center issued a Storm Surge Warning on Sept. 21 from Sargent, Texas to Sabine Pass including Galveston Bay. A Tropical Storm Warning is in effect from Port Aransas, Texas to Sabine Pass.
Beta’s Status of Sept. 10
By 8 a.m. EDT CDT (1200 UTC), the center of Tropical Storm Beta was located by surface observations and NOAA Doppler radars near latitude 28.8 degrees north and longitude 96.8 degrees west. That is about 10 miles (15 km) east-southeast of Victoria and about 35 miles (55 km) west of Palacios, Texas.
Beta is moving toward the northwest near 3 mph (6 kph). Maximum sustained winds are near 40 mph (65 km/h) with higher gusts. Beta is likely to begin weakening later today. The estimated minimum central pressure is 999 millibars.
Beta’s Forecast
NHC expects Beta to stall inland over Texas today but will then begin to move slowly toward the east-northeast tonight. An east-northeast to northeast motion with increasing forward speed is expected Wednesday through Friday. On the forecast track, the center of Beta will move inland over southeastern Texas through Wednesday and then over Louisiana and Mississippi Wednesday night through Friday (Sept. 25).
NHC Key Messages
The National Hurricane Center issued three Key Messages about Beta:
Significant flash and urban flooding is occurring and will continue for the middle and upper Texas coast today. The slow motion of Beta will continue to produce a long duration rainfall event from the middle Texas coast to southern Louisiana. Flash, urban, and minor river flooding is likely. Periods of rainfall will continue into the ArkLaTex region and spread east into the Lower Mississippi Valley and portions of the Southeast through the end of the week. Flash, urban, and isolated minor river flooding is possible.
Storm surge flooding will continue throughout the morning, around the times of high tide along portions of the Texas coast within the storm surge warning areas. Residents in these areas should continue to follow advice of local officials.
Tropical-storm-force winds will continue near portions of the Texas coast within the warning area today.
NASA Researches Tropical Cyclones
Hurricanes/tropical cyclones are the most powerful weather events on Earth. NASA’s expertise in space and scientific exploration contributes to essential services provided to the American people by other federal agencies, such as hurricane weather forecasting.
The AIRS instrument is one of six instruments flying on board NASA’s Aqua satellite, launched on May 4, 2002.
For more than five decades, NASA has used the vantage point of space to understand and explore our home planet, improve lives and safeguard our future. NASA brings together technology, science, and unique global Earth observations to provide societal benefits and strengthen our nation. Advancing knowledge of our home planet contributes directly to America’s leadership in space and scientific exploration.
Sep. 22, 2020 – NASA Sees Rebirth of Tropical Storm Paulette
Tropical Storm Paulette just reformed in the central North Atlantic Ocean today, Sept. 22. Using a NASA satellite rainfall product that incorporates data from satellites and observations, NASA estimated Paulette’s rainfall rates.
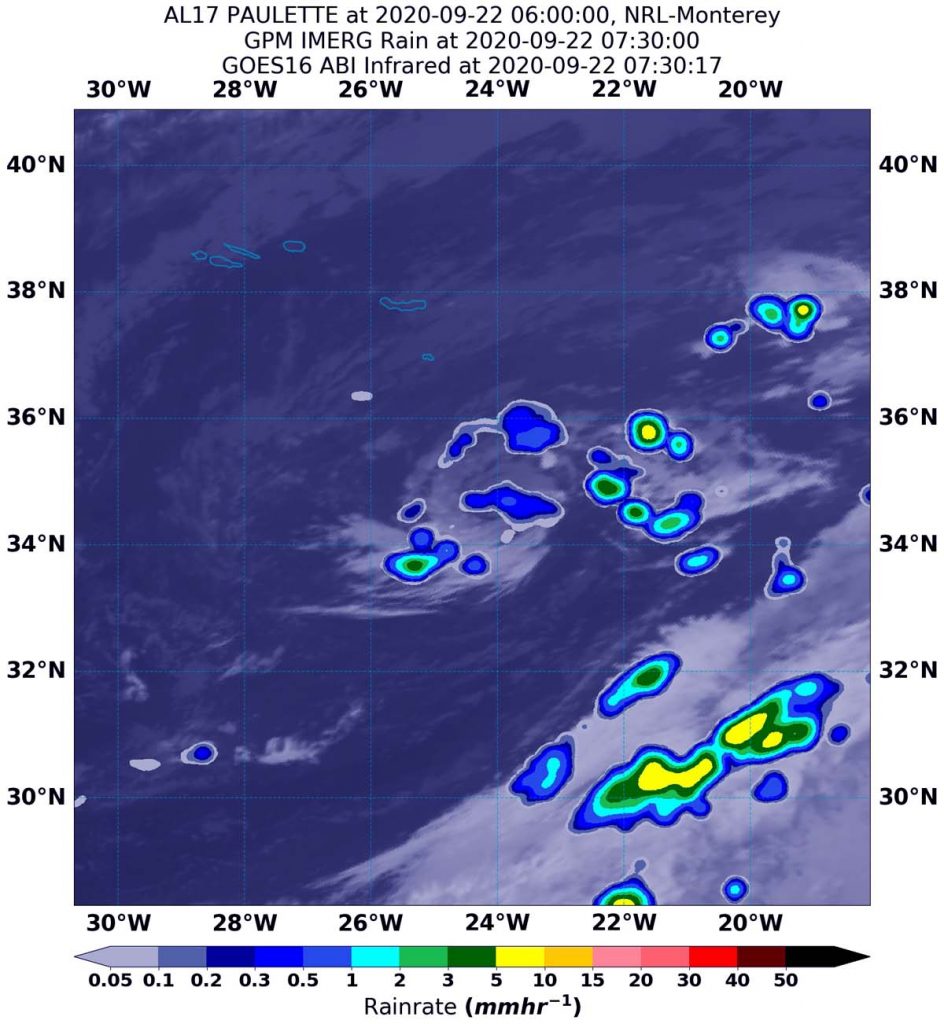
On Sept. 22 at 3:30 a.m. EDT (0730 UTC), NASA’s IMERG estimated Tropical Storm Paulette was generating as much as (5 mm/0.20 inches of rain (yellow) around the center of circulation. The rainfall data was overlaid on infrared imagery from NOAA’s GOES-16 satellite. Credit: NASA/NOAA/NRL
Paulette was a hurricane whose eye passed directly over Bermuda, then weakened and became a post-tropical cyclone on Sept. 16 in the North Atlantic Ocean when it was located 450 miles (725 km) east-southeast of Cape Race Newfoundland, Canada. A Post-Tropical Storm is a generic term for a former tropical cyclone that no longer possesses sufficient tropical characteristics to be considered a tropical cyclone.
At 11 a.m. EDT (1500 UTC) on Sept.16 NOAA’s National Hurricane Center (NHC) issued the final advisory on Paulette but tracked its remnants over the last 6 days. NHC forecasters had assigned a medium chance that Paulette could redevelop over that time. At 11 p.m. EDT on Sept. 21 (0300 UTC on Sept. 22), Paulette regained tropical characteristics.
Paulette’s Status on Sept. 22
At 5 a.m. EDT (0900 UTC) on Sept. 22, the center of Tropical Storm Paulette was located near latitude 34.7 degrees north and longitude 23.7 degrees west. That is about 295 miles (470 km) southeast of the Azores Islands. The Azores islands are an autonomous region of Portugal in the mid-Atlantic.
Paulette was moving toward the east-northeast near 17 mph (28 kph). An east or east-northeast motion at a slower forward speed is expected through Wednesday. Paulette is then expected to turn southward and southwestward Wednesday night and Thursday.
Maximum sustained winds are near 60 mph (95 km/h) with higher gusts. Weakening is forecast during the next couple of days, and Paulette is expected to become post-tropical by Wednesday night or Thursday. The estimated minimum central pressure is 1002 millibars.
Estimating Paulette’s Rainfall Rates from Space
At 11 p.m. EDT on Sept. 21, deep convection and thunderstorm development associated with the post-tropical remnants of Paulette had become better organized over the past 6 to 12 hours. “An ASCAT over pass from a few hours ago indicate that increase in convective organization has resulted in strengthening and the system is being classified as a tropical cyclone once again,” noted Daniel Brown, senior hurricane specialist and warning coordination meteorologist at NOAA’s National Hurricane Center in Miami, Fla.
Four and a half hours later, NASA’s Integrated Multi-satellitE Retrievals for GPM or IMERG, which is a NASA satellite rainfall product, estimated rainfall occurring in the newly reformed tropical storm. On Sept. 22 at 3:30 a.m. EDT (0730 UTC) IMERG formed Paulette was generating as much as 5 mm (0.20 inches) of rain per hour around the center of circulation.
By 5 a.m. EDT (0900 UTC), the NHC noted that the tops of Paulette’s convective clouds have been warming since the previous advisory, and first-light visible images showed that a swirl of low- to mid-level clouds is about all that is left.
At the U.S. Naval Laboratory in Washington, D.C., the IMERG rainfall data was overlaid on infrared imagery from NOAA’s GOES-16 satellite to provide a full extent of the storm.
What Does IMERG Do?
This near-real time rainfall estimate comes from the NASA’s IMERG, which combines observations from a fleet of satellites, in near-real time, to provide near-global estimates of precipitation every 30 minutes. By combining NASA precipitation estimates with other data sources, we can gain a greater understanding of major storms that affect our planet.
What the IMERG does is “morph” high-quality satellite observations along the direction of the steering winds to deliver information about rain at times and places where such satellite overflights did not occur. Information morphing is particularly important over the majority of the world’s surface that lacks ground-radar coverage. Basically, IMERG fills in the blanks between weather observation stations.
NASA Researches Tropical Cyclones
Hurricanes/tropical cyclones are the most powerful weather events on Earth. NASA’s expertise in space and scientific exploration contributes to essential services provided to the American people by other federal agencies, such as hurricane weather forecasting.
For more than five decades, NASA has used the vantage point of space to understand and explore our home planet, improve lives and safeguard our future. NASA brings together technology, science, and unique global Earth observations to provide societal benefits and strengthen our nation. Advancing knowledge of our home planet contributes directly to America’s leadership in space and scientific exploration.
NASA’s Terra satellite obtained visible imagery of recently formed Tropical Depression 14W as it strengthened into a tropical storm. Terra satellite imagery showed the storm was organizing.
NASA’s Terra satellite provided a visible image to forecasters of Tropical Storm Dolphin on Sept. 21. The imagery showed the storm was consolidating and organizing. Image Courtesy: NASA Worldview, Earth Observing System Data and Information System (EOSDIS).
Dolphin developed from Tropical Depression 14W. 14W formed on Sept. 20 about 366 miles east-southeast of Kadena Air Base, Okinawa Island, Japan. By 5 a.m. EDT (0900 UTC) on Sept. 21, the storm organized and strengthened into a tropical storm.
NASA Satellite View: Dolphin’s Organization
The Moderate Resolution Imaging Spectroradiometer or MODIS instrument that flies aboard NASA’s Terra satellite captured a visible image of Tropical Storm Dolphin on Sept. 21. Satellite imagery revealed a persistent deep convection and development of thunderstorms wrapping into a low-level circulation center. That is an indication of consolidation and better organization.
The satellite image was created using NASA’s Worldview product at NASA’s Goddard Space Flight Center in Greenbelt, Md.
Tropical Storm Dolphin on Sept. 21
Tropical storm Dolphin was located about 625 nautical miles south-southwest of Yokosuka, Japan, near latitude 25.7 degrees north and longitude 135.0 degrees east. It was moving slowly to the north-northeast at 4 knots and had maximum sustained winds 45 knots (52 mph/83 kph).
Dolphin’s Forecast and Track
The Joint Typhoon Warning Center (JTWC) forecasts that Dolphin will move north. Then later it is expect to turn to the northeast and strengthen to 55 knots.
JTWC forecasters expect the system to take on additional subtropical characteristics as it moves into an area of decreasing sea surface temperatures and increasing vertical wind shear. The storm’s upper level outflow is also expected to become more strongly associated with the robust westerly wind flow associated with the jet stream. By 11 a.m. EDT (1500 UTC) on Sept. 22, the system will begin extratropical transition and will complete that transition to the south of Japan.
About NASA’s Worldview and Terra Satellite
NASA’s Earth Observing System Data and Information System (EOSDIS) Worldview application provides the capability to interactively browse over 700 global, full-resolution satellite imagery layers and then download the underlying data. Many of the available imagery layers are updated within three hours of observation, essentially showing the entire Earth as it looks “right now.”
NASA’s Terra satellite is one in a fleet of NASA satellites that provide data for hurricane research.
Tropical cyclones/hurricanes are the most powerful weather events on Earth. NASA’s expertise in space and scientific exploration contributes to essential services provided to the American people by other federal agencies, such as hurricane weather forecasting.
Sep. 21, 2020 – NASA Looks at Rainfall Potential in Tropical Storm Beta
Tropical Storm Beta is forecast to be a soaker because of its rainfall potential and its forecast slow movement along the Texas coast. NASA calculated rainfall rates within the storm to give forecasters an idea of its soaking potential.
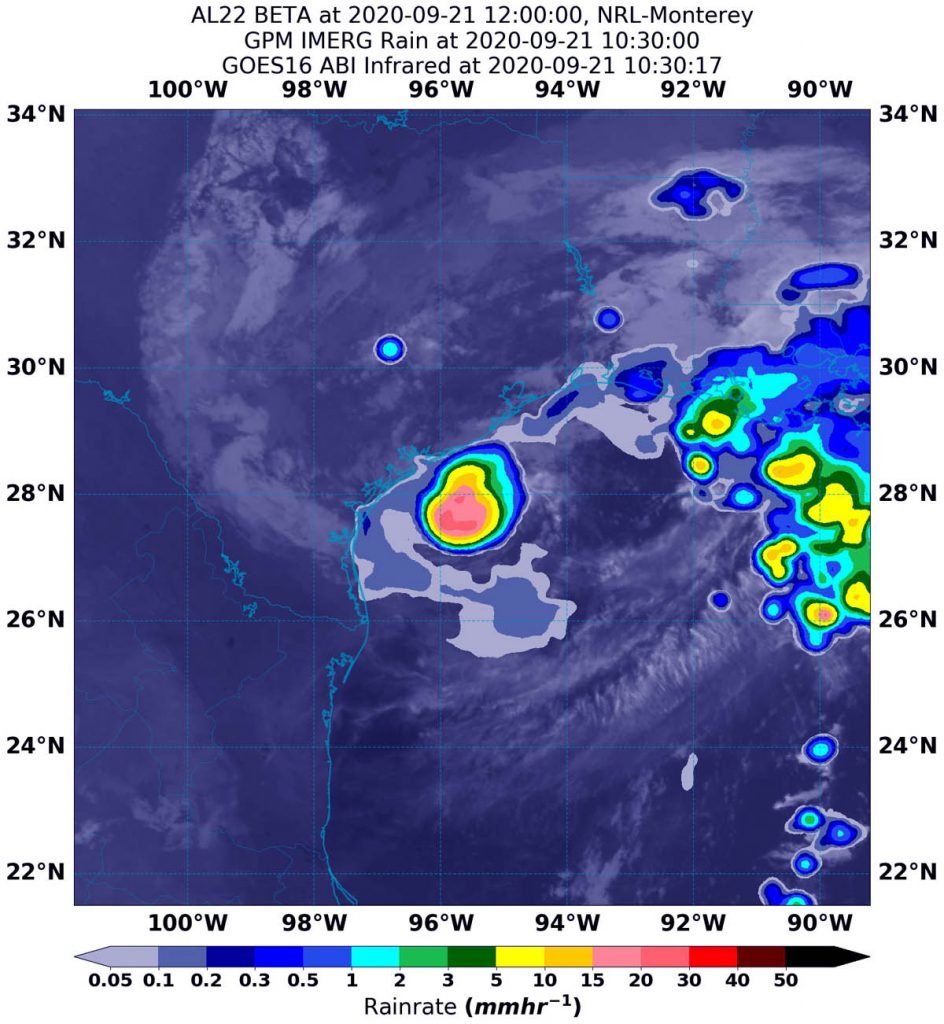
On Sept. 21 at 8 a.m. EDT (1200UTC), NASA’s IMERG estimated Tropical Beta was generating as much as 30 mm/1.18 inches of rain (dark pink) around the center of circulation, and over the Gulf of Mexico. Rainfall throughout most of the rest of the storm was occurring between 5 and 15 mm (0.2 to 0.6 inches/yellow and green colors) per hour. The rainfall data was overlaid on infrared imagery from NOAA’s GOES-16 satellite. Credit: NASA/NOAA/NRL
Using a NASA satellite rainfall product that incorporates data from satellites and observations, NASA found Beta was producing heavy rainfall off the coast of Texas.
Watches and Warnings on Sept. 21
NOAA’s National Hurricane Center posted a Storm Surge Warning from Port Aransas, Texas to Sabine Pass, Texas including Copano Bay, Aransas Bay, San Antonio Bay, Matagorda Bay, and Galveston Bay.
A Tropical Storm Warning is in effect for Port Aransas, Texas to Morgan City, Louisiana. A Tropical Storm Watch is in effect for Baffin Bay to Port Aransas, Texas.
Beta’s Status on Sept. 21
At 11 a.m. EDT (1500 UTC), the center of Tropical Storm Beta was located by an Air Force Reserve reconnaissance aircraft and NOAA Doppler weather radars near latitude 27.9 degrees north and longitude 95.7 degrees west. That is 55 miles (90 km) southeast of Port O’Connor, Texas, and about 75 miles (120 km) south-southeast of Freeport, Texas.
Beta was moving toward the west-northwest near 7 mph (11 kph), and this general motion is forecast to continue today. Data from the aircraft and Doppler radars indicate that maximum sustained winds are near 50 mph (85 kph) with higher gusts.
NOAA’s National Hurricane Center (NHC) noted that tropical-storm-force winds extend outward up to 175 miles (280 km) from the center. The estimated minimum central pressure based on data from the reconnaissance aircraft is 996 millibars.
Estimating Beta’s Rainfall Rates from Space
NASA’s Integrated Multi-satellitE Retrievals for GPM or IMERG, which is a NASA satellite rainfall product, estimated on Sept. 21 at 8 a.m. EDT (1200UTC), Beta was generating as much as 30 mm (1.18 inches) of rain per hour around the center of circulation. That area was off the coast of Texas and over Gulf of Mexico.
Rainfall throughout most of the storm was estimated as falling at a rate between 5 and 15 mm (0.2 to 0.6 inches) per hour. At the U.S. Naval Laboratory in Washington, D.C., the IMERG rainfall data was overlaid on infrared imagery from NOAA’s GOES-16 satellite to provide a full extent of the storm.
What Does IMERG Do?
This near-real time rainfall estimate comes from the NASA’s IMERG, which combines observations from a fleet of satellites, in near-real time, to provide near-global estimates of precipitation every 30 minutes. By combining NASA precipitation estimates with other data sources, we can gain a greater understanding of major storms that affect our planet.
What the IMERG does is “morph” high-quality satellite observations along the direction of the steering winds to deliver information about rain at times and places where such satellite overflights did not occur. Information morphing is particularly important over the majority of the world’s surface that lacks ground-radar coverage. Basically, IMERG fills in the blanks between weather observation stations
NHC Key Messages
The National Hurricane Center issued several key messages for Beta:
STORM SURGE: The combination of a dangerous storm surge and the tide will cause normally dry areas near the coast to be flooded by rising waters moving inland from the shoreline. The water could reach the following heights above ground somewhere in the indicated areas if the peak surge occurs at the time of high tide:
Port Aransas, TX to Sabine Pass, TX including Copano Bay, Aransas Bay, San Antonio Bay, Matagorda Bay, and Galveston Bay…2-4 ft
Sabine Pass, TX to Ocean Springs, MS including Sabine Lake, Lake Calcasieu, Vermilion Bay, Lake Borgne, Lake Pontchartrain, and Lake..1-3 ft
Baffin Bay, TX to Port Aransas, TX including Corpus Christi Bay and Baffin Bay… 1-3 ft
Mouth of the Rio Grande to Baffin Bay, TX…1-2 ft
The deepest water will occur along the immediate coast in areas of onshore winds where the surge will be accompanied by large and dangerous waves. Surge-related flooding depends on the relative timing of the surge and the tidal cycle, and can vary greatly over short distances.
WIND: Tropical storm conditions are expected to begin later this morning in portions of the tropical storm warning area. Tropical storm conditions are possible within the tropical storm watch area later today.
RAINFALL: Through Friday, Beta is expected to produce rainfall accumulations of 5 to 10 inches with isolated totals of 15 inches from the middle Texas coast to southeast Louisiana. Rainfall totals of 3 to 5 inches are expected northward into the ArkLaTex region and east into the Lower Mississippi Valley through the end of the week. Flash and urban flooding is likely, as well as isolated minor river flooding.
TORNADOES: A tornado or two could occur today and tonight, near the middle to upper Texas coast or the southwestern Louisiana coast.
SURF: Swells generated by a combination of Beta and a cold front over the northern Gulf of Mexico will continue along the coasts of Louisiana and Texas during the next couple of days. These swells are likely to cause life-threatening surf and rip current conditions. Please consult products from your local weather office.
Beta’s Forecast
A decrease in forward speed and a sharp turn to the north and northeast are expected on Tuesday. On the forecast track, the center of Beta will continue to move toward the central coast of Texas today and will likely move inland by tonight. Little change in strength is forecast before Beta reaches the Texas coast. Weakening is anticipated once Beta moves inland. Beta is forecast to remain close to the coast of southeastern Texas on Tuesday and Wednesday.
NASA Researches Tropical Cyclones
Hurricanes/tropical cyclones are the most powerful weather events on Earth. NASA’s expertise in space and scientific exploration contributes to essential services provided to the American people by other federal agencies, such as hurricane weather forecasting.
For more than five decades, NASA has used the vantage point of space to understand and explore our home planet, improve lives and safeguard our future. NASA brings together technology, science, and unique global Earth observations to provide societal benefits and strengthen our nation. Advancing knowledge of our home planet contributes directly to America’s leadership in space and scientific exploration.
Sep. 21, 2020 – NASA Analyzes Soaking Capabilities of Hurricane Teddy on Bermuda Approach
Using a NASA satellite rainfall product that incorporates data from satellites and observations, NASA estimated Hurricane Teddy’s rainfall rates as it approaches Bermuda on Sept. 21. Teddy is a large hurricane and growing. It is also churning up seas all the way to the U.S. and Canadian coastlines.
On Sept. 21 at 6:30 a.m. EDT (1030 UTC), NASA’s IMERG estimated Hurricane Teddy was generating as much as 30 mm/1.18 inches of rain (dark pink) around the center of circulation. Rainfall throughout most of the rest of the storm was occurring between 5 and 15 mm (0.2 to 0.6 inches/yellow and green colors) per hour. The rainfall data was overlaid on infrared imagery from NOAA’s GOES-16 satellite. Credit: NASA/NOAA/NRL
Watches and Warnings on Sept. 21
NOAA’s National Hurricane Center posted a Tropical Storm Warning for Bermuda and a Tropical Storm Watch is in effect from Lower East Pubnico to Main-a-Dieu, Nova Scotia, Canada.
Teddy’s Status on Sept. 21
At 11 a.m. EDT (1500 UTC), the center of Hurricane Teddy was located near latitude 31.1 degrees north and longitude 62.7 degrees west. That is about 150 miles (240 km) east-southeast of Bermuda and about 935 miles (1,500 km) south of Halifax, Nova Scotia, Canada.
Teddy was moving toward the north-northeast near 14 mph (22 kph), and this motion is expected to continue today, followed by a turn toward the north overnight and north-northwest on Tuesday. Maximum sustained winds were near 90 mph (150 kph) with higher gusts. Teddy is a large hurricane. Hurricane-force winds extend outward up to 80 miles (130 km) from the center and tropical-storm-force winds extend outward up to 230 miles (370 km).
An Air Force Reserve Hurricane Hunter aircraft recently reported a minimum central pressure of 960 millibars.
Estimating Teddy’s Rainfall Rates from Space
NASA’s Integrated Multi-satellitE Retrievals for GPM or IMERG, which is a NASA satellite rainfall product, estimated on Sept. 21 at 6:30 a.m. EDT (1030 UTC), Teddy was generating as much as 30 mm (1.18 inches) of rain per hour around the center of circulation.
Rainfall throughout most of the storm was estimated as falling at a rate between 5 and 15 mm (0.2 to 0.6 inches) per hour. At the U.S. Naval Laboratory in Washington, D.C., the IMERG rainfall data was overlaid on infrared imagery from NOAA’s GOES-16 satellite to provide a full extent of the storm.
As Teddy moves north, that heavy rainfall is expected across Atlantic Canada between Tuesday and Thursday.
What Does IMERG Do?
This near-real time rainfall estimate comes from the NASA’s IMERG, which combines observations from a fleet of satellites, in near-real time, to provide near-global estimates of precipitation every 30 minutes. By combining NASA precipitation estimates with other data sources, we can gain a greater understanding of major storms that affect our planet.
What the IMERG does is “morph” high-quality satellite observations along the direction of the steering winds to deliver information about rain at times and places where such satellite overflights did not occur. Information morphing is particularly important over the majority of the world’s surface that lacks ground-radar coverage. Basically, IMERG fills in the blanks between weather observation stations
NHC Key Messages
The National Hurricane Center issued three key messages as Hurricane Teddy approaches Bermuda and grows in size:
The center of Teddy is forecast to move east of Bermuda today. Wind gusts of tropical-storm-force have been reported on the island, and tropical storm conditions could continue today.
Teddy is expected to transition to a powerful post-tropical cyclone as it moves near or over portions of Atlantic Canada late Tuesday through Thursday, where there is an increasing risk of direct impacts from wind, rain, and storm surge. A Tropical Storm Watch is in effect for portions of Nova Scotia, and heavy rainfall across Atlantic Canada is expected with Teddy between Tuesday and Thursday after it becomes a strong post-tropical cyclone.
Large swells produced by Teddy are expected to affect portions of Bermuda, the Leeward Islands, the Greater Antilles, the Bahamas, the east coast of the United States, and Atlantic Canada during the next few days. These swells will likely cause life-threatening surf and rip current conditions.
Teddy’s Forecast
“Teddy’s size will likely increase substantially during the next couple of days as it moves northward and interacts with a frontal system,” said Eric Blake, a senior hurricane specialist at NOAA’s National Hurricane Center in Miami, Florida. “Gale force winds are likely along portions of the near shore waters of the northeast U.S.”
NHC forecasters said Teddy should turn to the north-northeast as it approaches Nova Scotia on Wednesday. Teddy is expected to gain strength overnight, but weaken steadily by Wednesday and become a strong post-tropical cyclone.
NASA Researches Tropical Cyclones
Hurricanes/tropical cyclones are the most powerful weather events on Earth. NASA’s expertise in space and scientific exploration contributes to essential services provided to the American people by other federal agencies, such as hurricane weather forecasting.
For more than five decades, NASA has used the vantage point of space to understand and explore our home planet, improve lives and safeguard our future. NASA brings together technology, science, and unique global Earth observations to provide societal benefits and strengthen our nation. Advancing knowledge of our home planet contributes directly to America’s leadership in space and scientific exploration.
Sep. 21, 2020 – NASA Satellite Found Post-Tropical Storm Alpha Fizzle Over Portugal and Spain
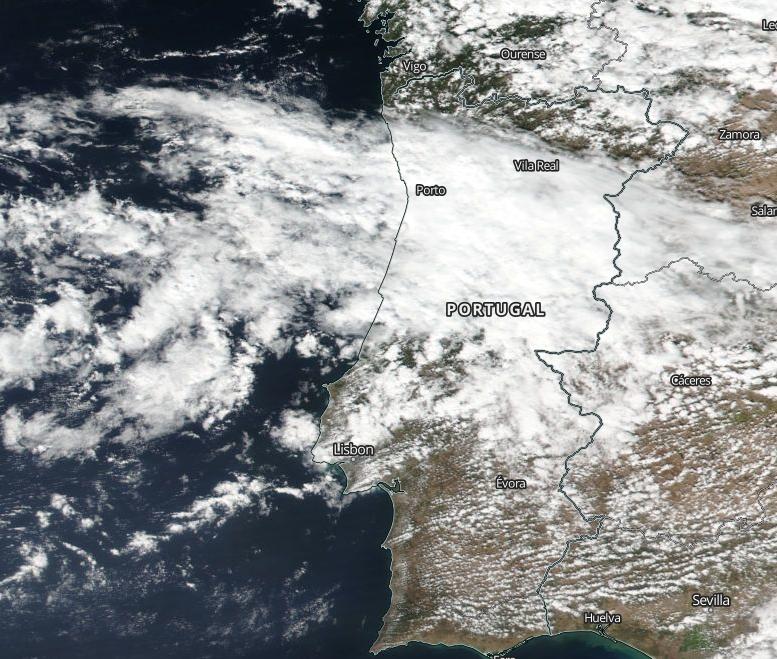
Former Subtropical Storm Alpha was a short-lived storm that formed and fizzled within 24 hours. NASA-NOAA’s Suomi NPP satellite found the remnants of former Subtropical storm Alpha spreading over Portugal and northwestern Spain.
On Sept. 19 at 9:35 a.m. EDT (1335 UTC), NASA-NOAA’s Suomi NPP satellite found the remnants of former Subtropical storm Alpha spread over Portugal and into northwestern Spain. Credit: NASA Worldview, Earth Observing System Data and Information System (EOSDIS)
Alpha formed off the coast of Portugal by 12:30 p.m. EDT (1630 UTC) on Friday, Sept. 18. Alpha made landfall in Portugal later that day around 5 p.m. EDT (2100 UTC) about 120 miles (195 km) north-northeast of Lisbon, Portugal.
On Friday, Sept. 18 at 11 p.m. EDT (0300 UTC on Sept. 19), the National Hurricane Center noted that the storm had become a post-tropical cyclone. Post-tropical is a generic term describes a cyclone that no longer possesses sufficient tropical characteristics to be considered a tropical cyclone. Post-tropical cyclones can continue carrying heavy rains and high winds. Former tropical cyclones that have become fully extratropical and remnant lows are two classes of post-tropical cyclones.
On Sept. 18 at 11 p.m. EDT (0300 UTC on Sept. 19) METEOSAT satellite imagery, radar data, and surface observations indicated that Alpha had degenerated to a post-tropical remnant low just a few miles to the southeast of Viseu, Portugal.
Less than 12 hours later on Sept. 19 at 9:35 a.m. EDT (1335 UTC), the Visible Infrared Imaging Radiometer Suite (VIIRS) instrument aboard NASA-NOAA’s Suomi NPP satellite found the remnants of former Subtropical storm Alpha spread over Portugal and into northwestern Spain.
The National Hurricane Center forecast called for the remnants to move into north central Spain later on Saturday, Sept. 19 and dissipated by Sept. 20 at 0000 UTC (Sept. 19 at 8 p.m. EDT).
Additional information on this system can be found in products from the Portuguese Institute for Sea and Atmosphere at www.ipma.pt
NASA Researches Tropical Cyclones
Hurricanes/tropical cyclones are the most powerful weather events on Earth. NASA’s expertise in space and scientific exploration contributes to essential services provided to the American people by other federal agencies, such as hurricane weather forecasting.
For more than five decades, NASA has used the vantage point of space to understand and explore our home planet, improve lives and safeguard our future. NASA brings together technology, science, and unique global Earth observations to provide societal benefits and strengthen our nation. Advancing knowledge of our home planet contributes directly to America’s leadership in space and scientific exploration.
Sep. 21, 2020 – NASA Sees Wilfred Degenerate into a Trough
Former Tropical Storm Wilfred weakened in the Central Atlantic Ocean and NASA-NOAA’s Suomi NPP satellite provided a visible image after the storm became a trough or elongated area of low pressure.
On Sept. 20, NASA-NOAA’s Suomi NPP satellite captured a visible image Wilfred as it opened up into an elongated area of low pressure in the Central North Atlantic Ocean. Credit: NASA Worldview, Earth Observing System Data and Information System (EOSDIS)
On Sunday, Sept. 20 at 11 p.m. EDT, NOAA’s National Hurricane Center issued their final advisory on Wilfred. Wilfred degenerated into a trough of low or elongated areas of low pressure. At that time, the remnants of Wilfred were located near latitude 15.9 degrees north latitude and longitude 47.4 degrees west. The remnants were moving toward the west near 17 mph (28 kph), and this general motion should continue during the next day or two.
Maximum sustained winds were near 35 mph (55 kph) and forecasters expect winds to continue decreasing over the next couple of days.
Northwesterly vertical wind shear continued to take a toll on Wilfred. Infrared satellite imagery along with scatterometer (wind) data indicated that Wilfred’s low-level circulation had become an open trough of low pressure. Therefore, Wilfred was no longer a tropical cyclone.
On Sept. 20, the Visible Infrared Imaging Radiometer Suite (VIIRS) instrument aboard NASA-NOAA’s Suomi NPP satellite captured a visible image of Wilfred as it opened up into an elongated area of low pressure in the Central North Atlantic Ocean. The remaining thunderstorm development appeared to have a linear shape. Those storms appear to be the result of the system interacting with an upper-level trough located to its northwest.
The trough should continue to move westward at a slightly slower forward speed until it weakens and dissipates within a few days.
NASA Researches Tropical Cyclones
Hurricanes/tropical cyclones are the most powerful weather events on Earth. NASA’s expertise in space and scientific exploration contributes to essential services provided to the American people by other federal agencies, such as hurricane weather forecasting.
For more than five decades, NASA has used the vantage point of space to understand and explore our home planet, improve lives and safeguard our future. NASA brings together technology, science, and unique global Earth observations to provide societal benefits and strengthen our nation. Advancing knowledge of our home planet contributes directly to America’s leadership in space and scientific exploration.