Sergio (Eastern Pacific Ocean) 2018

Oct. 12, 2018 – NASA Sees Sergio’s Rains Sweep into the U.S. Southwest

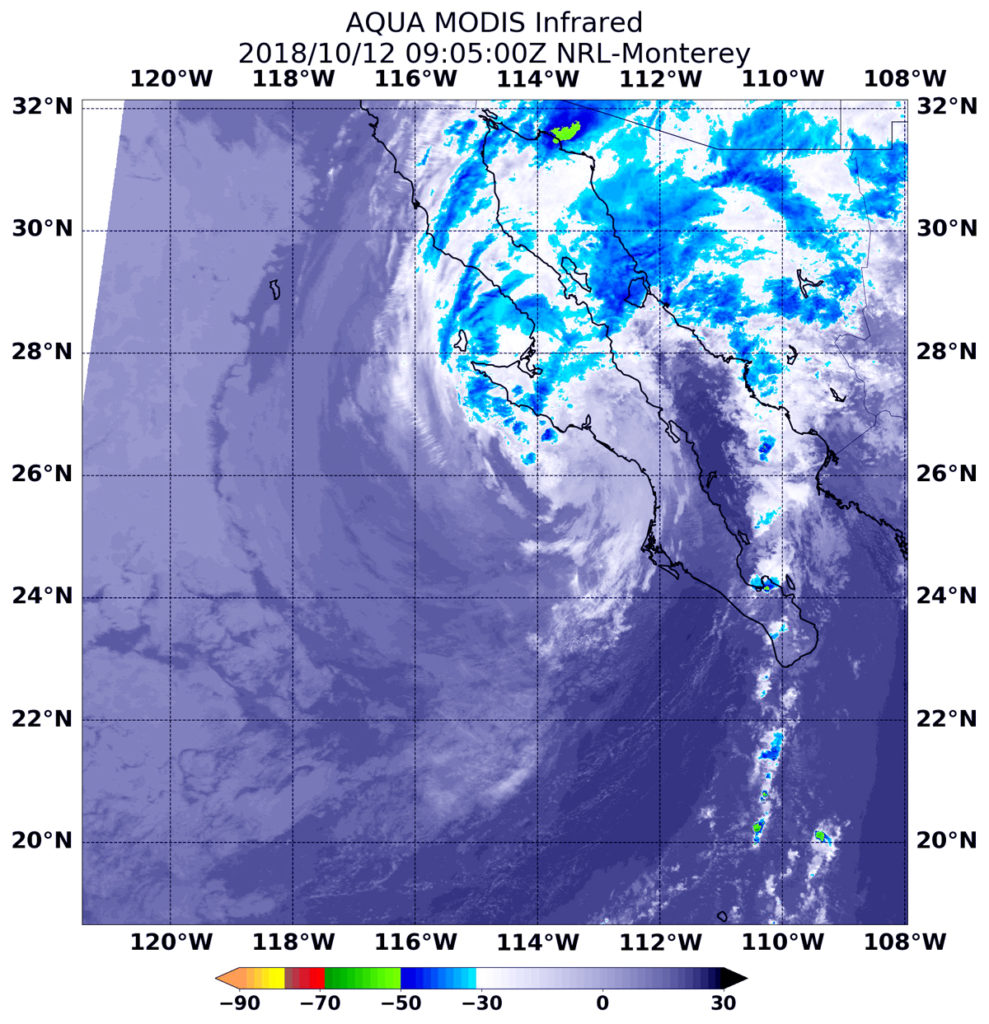
NASA’s Aqua satellite captured an infrared image of Tropical Storm Sergio’s clouds and rainfall sweeping into the southwestern U.S.
Aqua image of Sergio
At 1:55 a.m. EDT (0555 UTC) on Oct. 3, the MODIS instrument that flies aboard NASA’s Aqua satellite gathered infrared data on Hurricane Leslie. Strongest thunderstorms circled the center and were in a thick band northeast of center where cloud top temperatures were as cold as minus 63 degrees Fahrenheit (minus 53 Celsius). Credit: NASA/NRL

At 5:05 a.m. EDT (0905 UTC) on Oct. 3 the MODIS instrument that flies aboard NASA’s Aqua satellite gathered infrared data on Sergio. Although the center of circulation was over Baja California, Mexico, clouds and showers in the northeastern quadrant extended into southern Arizona.

Infrared data provides temperature information. MODIS found strongest storms with coldest cloud top temperatures as cold as minus 63 degrees Fahrenheit (minus 53 Celsius) in a small area in northwestern Mexico. NASA research has shown that cloud tops with temperatures that cold were high in the troposphere and have the ability to generate heavy rain.  A large area of storms with cloud top temperatures near minus 50 degrees Fahrenheit blanketed most of Baja California, northwestern mainland Mexico and stretched into southern Arizona.

Soon after Aqua passed overhead, Sergio entered the Sea of Cortez, located between Baja California and mainland Mexico.

At 11 a.m. EDT on Oct. 12, a Tropical Storm Warning is in effect for the west coast of the Baja California peninsula from Punta Eugenia to Cabo San Lazaro and for the east coast of the Baja California peninsula from Mulege to Bahia San Juan Bautista.

The National Hurricane Center or NHC noted the center of Tropical Storm Sergio was located near latitude 27.5 North, longitude 111.9 West. Sergio is moving toward the northeast near 24 mph (39 kph), and this general motion is expected to continue during the next day or so.  On the forecast track, the center of Sergio will move across the Sea of Cortez during the next several hours and then move over northwestern Mexico later today or tonight. Maximum sustained winds are near 40 mph (65 kph) with higher gusts.

Sergio should weaken to a tropical depression later today, and degenerate into a remnant low while moving over northwestern Mexico. Dissipation should occur on Saturday.

Despite dissipation as a tropical cyclone, though, the NHC said “moisture from Sergio will affect the United States, with total rain accumulations of 1 to 3 inches from southeast Arizona and southern New Mexico toward the southern Plains through Saturday. This rainfall could cause life-threatening flash flooding.”

For updated forecasts, visit: www.nhc.noaa.gov

By Rob Gutro
NASA’s Goddard Space Flight Center


Michael 2018

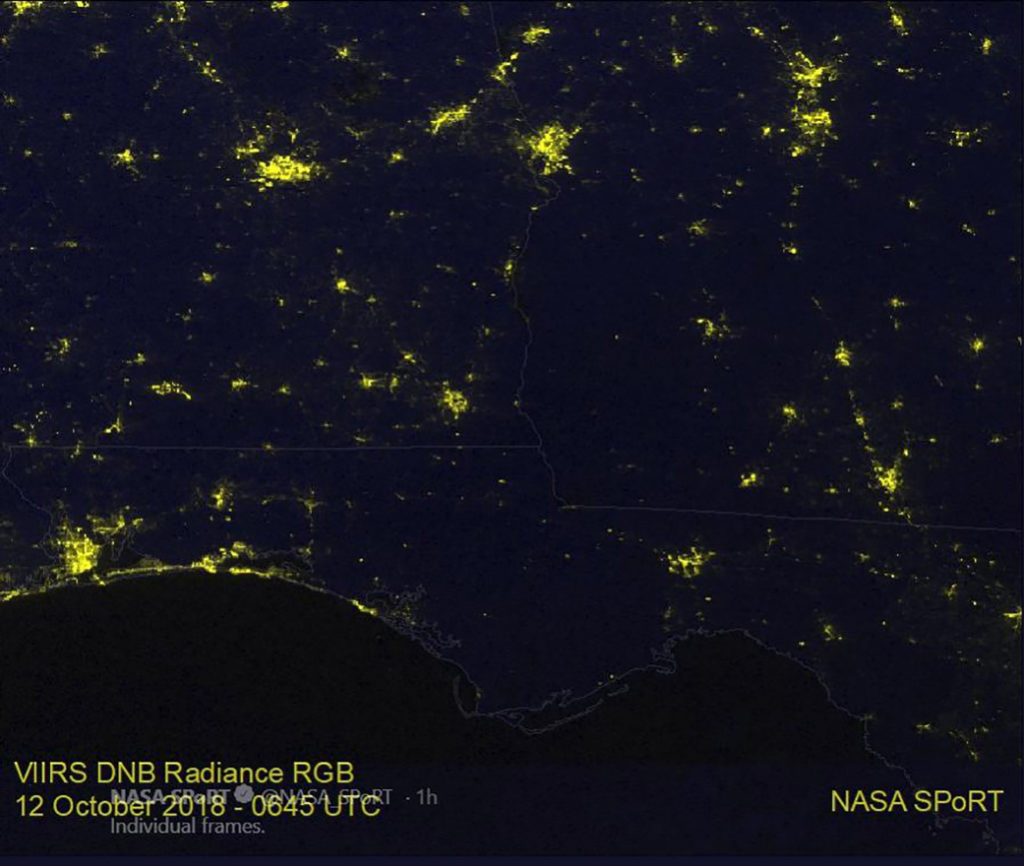
Oct. 12, 2018 #1 – Hurricane Michael’s Path of Power Outages Seen by Satellite
An area of the U.S. shows a swath of darkness after Hurricane Michael made landfall.

To view the slider of the before and after images, click this link: https://www.nasa.gov/feature/goddard/2018/hurricane-michaels-path-of-power-outages-seen-by-satellite

On Oct. 12 at 2:45 a.m. EDT (0645 UTC) the VIIRS instrument aboard NOAA’s NOAA-20 satellite captured a view of the change in night-time lights in the area of the Florida Panhandle and Georgia where Hurricane Michael traveled, knocking out power. The right image taken after Michael made land (taken on October 12) is compared to an image taken Oct. 6 at 2:58 a.m. EDT (0658 UTC) to show the difference.
For more information:  https://weather.msfc.nasa.gov/sport

Credit: NOAA/NASA MSFC, SPoRT


Luban (North Indian Ocean) 2018

Oct. 11, 2018 – NASA Finds Tropical Cyclone Luban Crawling

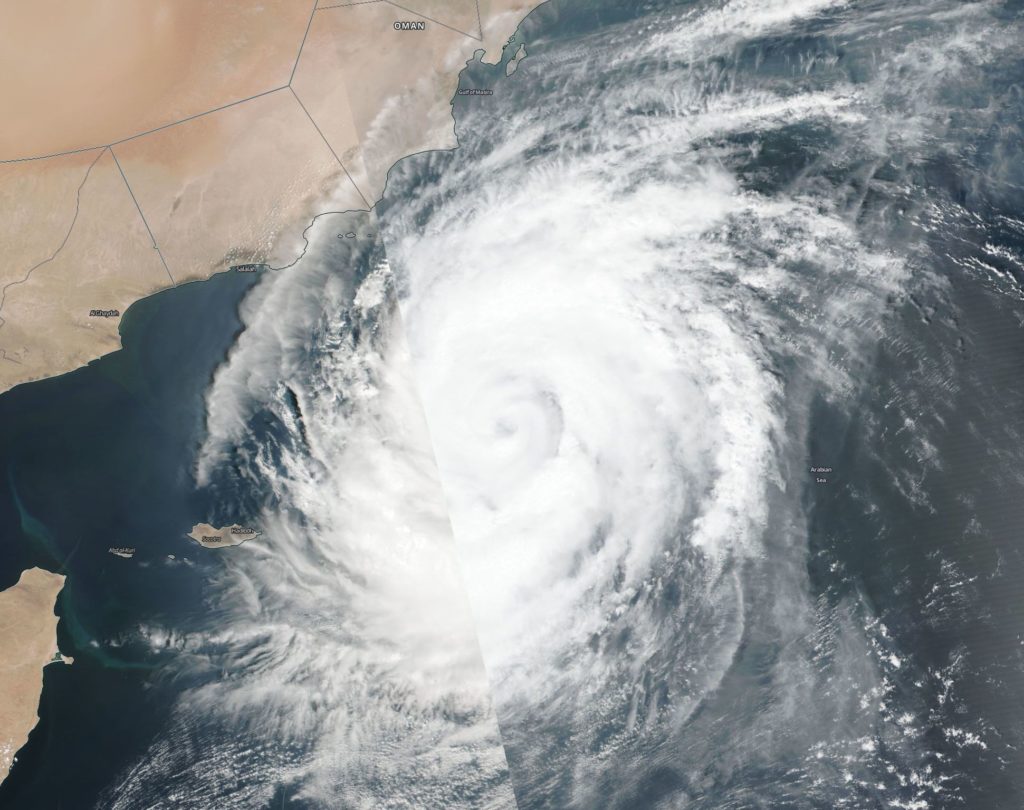
NASA-NOAA’s Suomi NPP satellite provided a visible image of Tropical Cyclone Luban as it continued to spin over the Arabian Sea and slowly head toward Oman.

Suomi NPP image of Luban
NASA-NOAA’s Suomi NPP satellite provided this visible image of Tropical Cyclone Luban early on Oct. 10 when it was over the Arabian Sea, Northern Indian Ocean. Credit: NASA Worldview, Earth Observing System Data and Information System (EOSDIS)/ NOAA

The Visible Infrared Imaging Radiometer Suite (VIIRS) instrument aboard NASA-NOAA’s Suomi NPP satellite analyzed Tropical Cyclone Luban in visible light early on Oct. 10 when it was located in the Arabian Sea, Northern Indian Ocean. Although Luban remains symmetrical, there’s a lack of strong thunderstorm development within the system. The VIIRS image showed the hint of an eye that was cloud-filled while microwave imagery more clearly showed a large and ragged eye.

On Oct. 10 at 11 p.m. EDT (Oct. 11 at 0300 UTC) the Joint Typhoon Warning Center or JTWC noted Tropical Cyclone Luban had maximum sustained winds near 65 knots (75 mph/120 kph). It was centered near 14.5 degrees north latitude and 58.7 degrees east longitude, approximately 266 nautical miles southeast of Salah, Oman, India. Luban is moving very slowly to the west.

The JTWC forecast takes Luban westward where it will encounter increasing vertical wind shear and slightly cooler sea surface temperatures which will allow for a gradual decrease in intensity. Luban is forecast to make landfall shortly before Oct. 14 in Oman as a tropical storm.

By Rob Gutro
NASA’s Goddard Space Flight Center
Titli (Northern Indian Ocean) 2018

Oct. 11, 2018 – NASA Catches Tropical Cyclone Titli Headed for Landfall in India

The Joint Typhoon Warning Center or JTWC issued the final warning on Tropical Cyclone Titli after it made landfall on the northeastern coast of India late on Oct. 10. NASA-NOAA’s Suomi NPP satellite captured an image of the large storm before landfall.

Suomi NPP image of Titli
NASA-NOAA’s Suomi NPP satellite provided this visible image of Tropical Cyclone Titli early on Oct. 10 when its eye was over the Bay of Bengal, Northern Indian Ocean. Credit: NASA Worldview, Earth Observing System Data and Information System (EOSDIS)/ NOAA

The Visible Infrared Imaging Radiometer Suite (VIIRS) instrument aboard NASA-NOAA’s Suomi NPP satellite analyzed Tropical Cyclone Titli in visible light early on Oct. 10 when its eye was over the Bay of Bengal, Northern Indian Ocean. Titli stretched from the Indian state of Andhra Pradesh northeast into West Bengal. Before and after landfall, animated enhanced infrared satellite imagery showed strong thunderstorms surrounding a defined eye.

On Oct. 10 at 11 p.m. EDT (Oct. 11 at 0300 UTC) Tropical Cyclone Titli had maximum sustained winds near 90 knots (103 mph/166 kph). It was centered near 9.1 degrees north latitude and 84.4 degrees east longitude, approximately 312 nautical miles southwest of Calcutta, India. Titli tracked west-northwestward.

Titli came ashore near Palasa in Srikakulam district of Andhra Pradesh. Heavy rainfall is forecast for the districts of Ganjam, Gajapati, Puri, Jagatsinghpur, and Kendra. The storm has taken 7 lives. Strong winds battered many parts of the state of Andhra Pradesh and neighboring Odisha.

By October 13, JTWC expect Titli to dissipate over land.

By Rob Gutro
NASA’s Goddard Space Flight Center
Sergio (Eastern Pacific Ocean) 2018

Oct. 11, 2018 – NASA Provides Takes Powerful Hurricane Sergio’s Temperature

Infrared light provides scientists with temperature data and that’s important when trying to understand the strength of storms. NASA’s Aqua satellite provided those cloud top temperatures of Category 4 Hurricane Sergio in the Eastern Pacific Ocean.

Suomi NPP image of Sergio
The AIRS instrument aboard NASA’s Aqua satellite passed over Hurricane Sergio on Oct. 3 at 5:17 a.m. EDT (0917 UTC) and analyzed the storm in infrared light. AIRS detected strongest storms (purple) around the eye where cloud top temperatures were as cold as or colder than 207 Kelvin (minus 87 degrees Fahrenheit/minus 66.1 degrees Celsius). Credit: NASA JPL, Heidar Thrastarson

The Atmospheric Infrared Sounder or AIRS instrument aboard NASA’s Aqua satellite passed over Hurricane Sergio on Oct. 3 at 5:17 a.m. EDT (0917 UTC) and analyzed the storm in infrared light. The higher the cloud tops, the colder and the stronger the storms. Infrared light as that gathered by the AIRS instrument can identify the strongest sides of a tropical cyclone.

AIRS temperature data showed Sergio had intensified that morning, with the eye becoming better defined while embedded in very cold cloud tops. AIRS detected those very cold cloud tops were as cold as or colder than 207 Kelvin (minus 87 degrees Fahrenheit/minus 66.1 degrees Celsius).  Storms with cloud top temperatures that cold have the capability to produce heavy rainfall.

At 5 a.m. EDT (0900 UTC) on Thursday, Oct. 4 the National Hurricane Center or NHC noted “Sergio’s intensity is estimated to have increased just a little more this morning, and it remains a powerful category 4 hurricane.”

The eye of Hurricane Sergio was located near latitude 14.4 degrees north, longitude 118.8 degrees west. That’s about 825 miles (1,330 km) southwest of the southern tip of Baja California, Mexico. Sergio was moving toward the northwest near 8 mph (13 km/h), and this motion is expected to continue today.  A turn toward the west-northwest and west at a slightly slower forward speed is expected Friday and Saturday.

Maximum sustained winds are near 140 mph (220 kph) with higher gusts.  Sergio is a category 4 hurricane on the Saffir-Simpson Hurricane Wind Scale.

NHC noted “Little change in strength is expected during the next day or so, but gradual weakening is forecast to begin on Friday, [Oct. 5].”

For updated forecasts on Sergio, visit: www.nhc.noaa.gov

By Rob Gutro
NASA’s Goddard Space Flight Center

Leslie (Eastern Atlantic Ocean) 2018

Oct. 11, 2018 – NASA-NOAA’s Suomi-NPP Satellite Finds Hurricane Leslie’s Ragged Eye

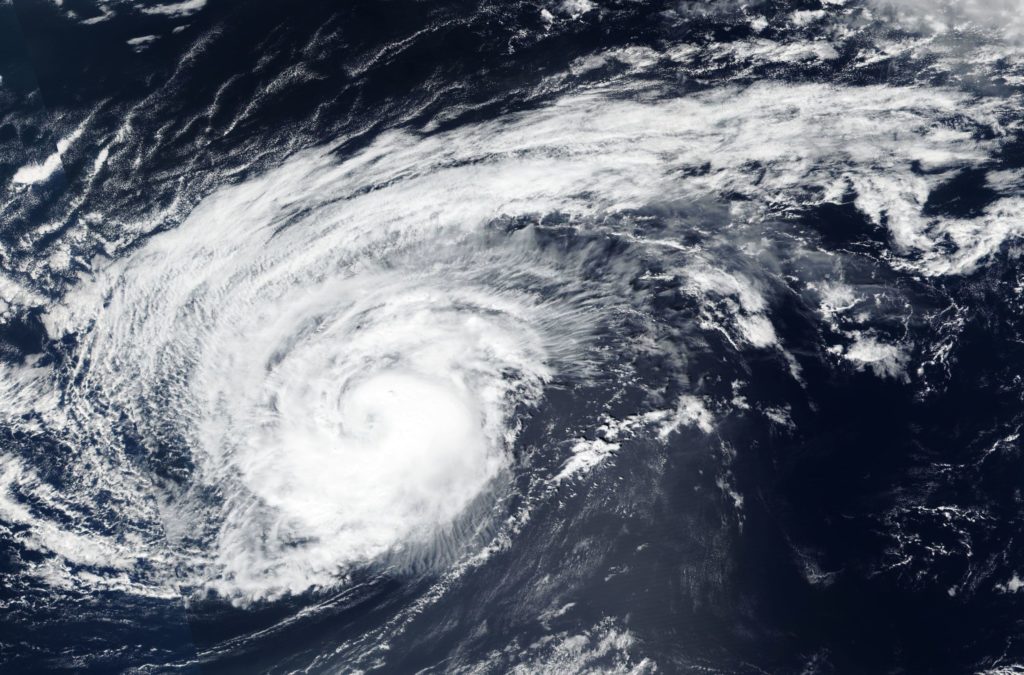
Hurricane Leslie had a ragged eye on imagery from NASA-NOAA’s Suomi-NPP satellite when it passed over the Eastern Atlantic.

Suomi NPP image of Leslie
NASA-NOAA’s Suomi NPP satellite provided a visible image of the very large Hurricane Leslie on Oct. 10 as it continued to linger in the Eastern Atlantic. Credit: NASA Worldview, Earth Observing System Data and Information System (EOSDIS)/ NOAA

On Oct. 10, the Visible Infrared Imaging Radiometer Suite (VIIRS) instrument aboard NASA-NOAA’s Suomi-NPP satellite looked at Leslie in visible light. Leslie is a large storm with a large area of powerful thunderstorms circling the ragged eye. Hurricane-force winds extend outward up to 30 miles (45 km) from the center and tropical-storm-force winds extend outward up to 240 miles (390 km).

On Oct. 11, the National Hurricane Center said that Leslie’s structure has remained steady since the night of Oct. 10. The hurricane has a ragged banding eye surrounded by a somewhat patchy central dense overcast.

At 11 a.m. EDT (1500 UTC), the center of Hurricane Leslie was located near latitude 29.1 degrees north and longitude 38.3 degrees west. That’s about 895 miles (1,440 km) southwest of the Azores Islands. The National Hurricane Center or NHC noted that Leslie is moving toward the east-northeast near 16 mph (26 kph), and this general motion with some increase in forward speed could begin by late Saturday, Oct. 13. Maximum sustained winds are near 80 mph (130 kph) with higher gusts.  Little change in strength is forecast during the next 48 hours, but weakening is expected over the weekend.

Leslie is now accelerating east-northeastward on the south side of a mid-latitude trough (elongated area of low pressure) that is moving across the North Atlantic. By 48 hours (Oct. 13) and onward, Leslie will be moving into a far more stable environment and over cooler waters, so steady weakening is anticipated.

For updated forecasts, visit: www.nhc.noaa.gov

By Rob Gutro
NASA’s Goddard Space Flight Center

Nadine (Eastern Atlantic Ocean) 2018

Oct. 11, 2018 – NASA Finds Wind Shear Weakening Tropical Storm Nadine

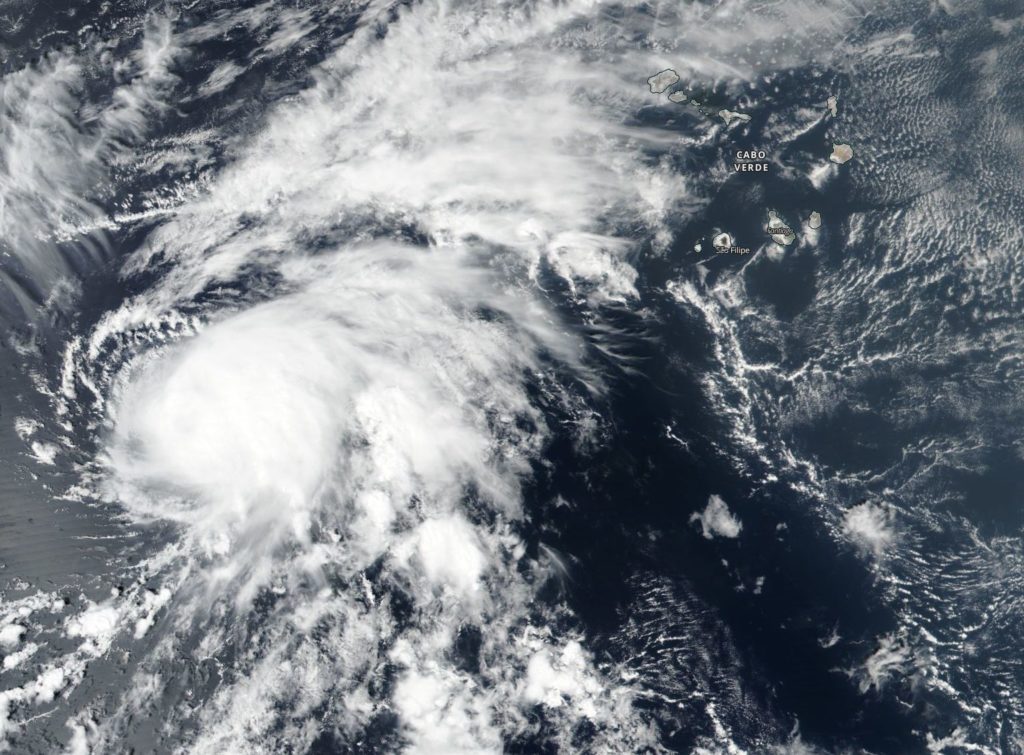
Wind shear is an adversary of tropical cyclones like Tropical Storm Nadine, and it is tearing the storm apart in the Eastern Atlantic Ocean. NASA-NOAA’s Suomi NPP satellite captured an image of Nadine as wind shear was affecting it.

Suomi NPP image of Nadine
On Oct. 10, NASA-NOAA’s Suomi NPP satellite provided this visible image of Tropical Storm Nadine in the far eastern Atlantic Ocean as it was being affected by wind shear that was weakening the storm. Credit: NASA Worldview, Earth Observing System Data and Information System (EOSDIS)/ NOAA

NASA-NOAA’s Suomi NPP satellite provided a visible image of Tropical Storm Nadine on Oct. 10 as it was being affected by wind shear. The image showed that clouds were being pushed northeast of the center. Satellite data shows that Nadine is strongly sheared and the low-level center of the tropical storm is now completely exposed, nearly 50 nautical miles to the southwest of the nearest deep convection (rising air that forms the thunderstorms that make up a tropical cyclone).

In general, wind shear is a measure of how the speed and direction of winds change with altitude. In order to understand how it affects a tropical cyclone or hurricane, think of a tropical cyclone as a vertical rotating cylinder. The different levels of rotating winds in the center of Tropical cyclones need to be stacked on top each other for the storm to strengthen. If there are outside winds pushing against the cylinder near the top, it affects the balance of the entire cylinder and that’s what happens when vertical wind shear pushes against a storm. It pushes the center and weakens (or wobbles) the rotation of the entire cylinder (storm).

At 11 a.m. EDT (1500 UTC) on Oct. 11, the National Hurricane Center reported the center of Tropical Storm Nadine was located near latitude 14.1 degrees north and longitude 34.0 degrees west. That’s about 645 miles (1,035 km) west of the southernmost Cabo Verde Islands. Nadine is moving toward the northwest near 8 mph (13 kph). A turn toward the west-northwest with a similar forward speed is expected later today, followed by a turn toward the west by the weekend. Maximum sustained winds are near 60 mph (95 kph) with higher gusts. Some weakening is forecast during the next 48 hours. Gradual weakening is expected during the next couple of days, and Nadine is forecast to degenerate into a trough of low pressure over the weekend.

The wind shear battering Nadine isn’t expected to let up over the next couple of days so forecasters at the National Hurricane Center expect steady weakening. By Oct. 14, Nadine is forecast to lose its strong uplift and thunderstorm development potential. By that time, Nadine is expected to degenerate into an elongated area of low pressure.

For updated forecasts from the NHC, visit: www.nhc.noaa.gov

By Rob Gutro
NASA’s Goddard Space Flight Center
Michael (Gulf of Mexico) 2018

Oct. 11, 2018 #1 – NASA Eyes Hurricane Michael Moving Inland

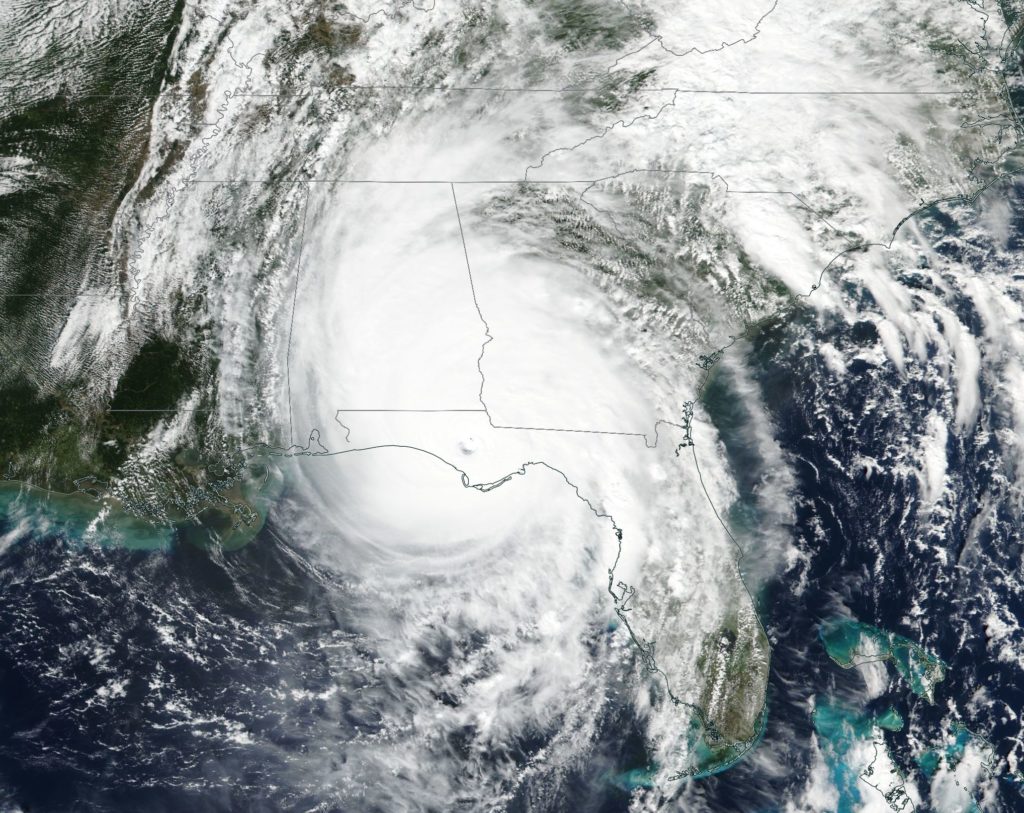
NASA’s Aqua satellite and NASA-NOAA’s Suomi NPP Satellite passed over the Florida Panhandle and captured different views of Hurricane Michael after it made landfall on Oct. 10.  Hurricane Michael is the most powerful storm on record to hit the Florida Panhandle.

A Visible View of Michael

NASA-NOAA’s Suomi NPP satellite provided this visible image of Hurricane Michael after it made landfall in the Florida panhandle on Oct. 10. The image revealed high clouds over the eye, located in the panhandle. Michael’s extent covered Alabama, the western half of Georgia and the northern half of Florida.

Suomi NPP image of Michael
NASA-NOAA’s Suomi NPP satellite provided this visible image of Hurricane Michael after it made landfall in the Florida panhandle on Oct. 10. Credit: NASA Worldview, Earth Observing System Data and Information System (EOSDIS)/ NOAA

Infrared View Shows Michael as a Powerful Rainmaker

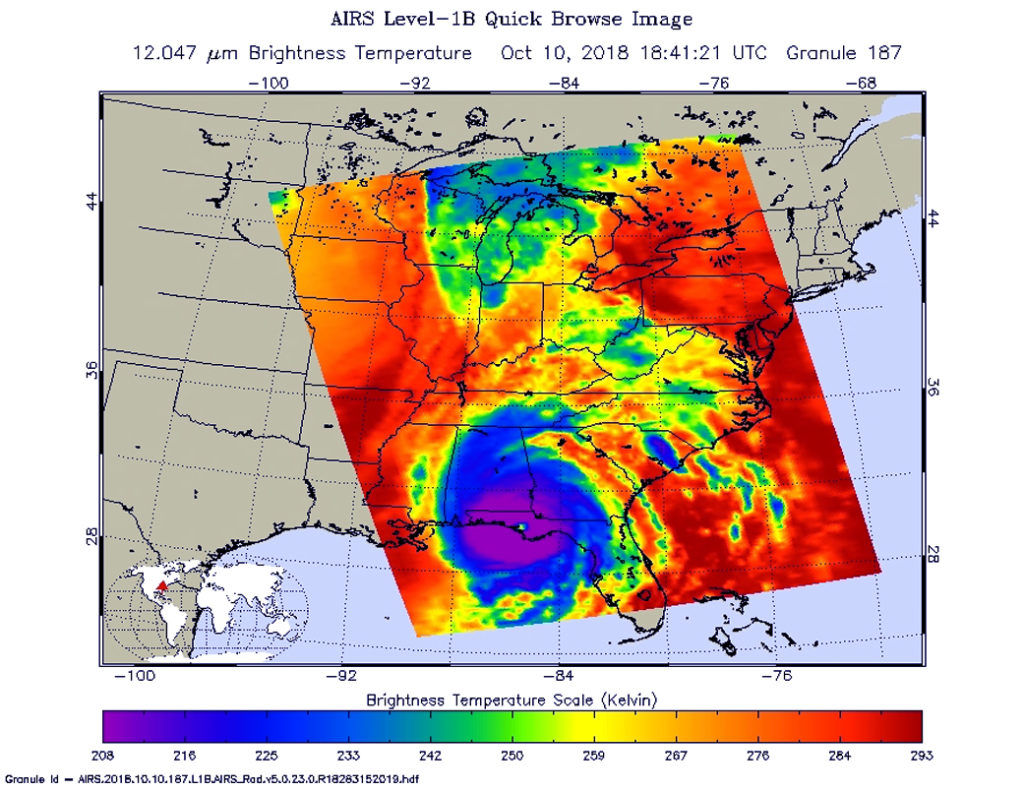
On Oct. 10 at 2:41 p.m. EDT (1841 UTC) the Atmospheric Infrared Sounder or AIRS instrument aboard NASA’s Aqua satellite provided an infrared view of Hurricane Michael after landfall. The AIRS image showed that Michael still maintained a clear eye, and was surrounded by a large symmetric area of powerful thunderstorms. Those powerful thunderstorms had cloud top temperatures near 208 kelvin (minus 85.2 degrees Fahrenheit/minus 65.1 degrees Celsius). NASA research has shown that cloud top temperatures that cold in storms indicate the storms have the capability to generate heavy rainfall.

That rainfall is a major concern. The NHC said “Michael is expected to produce total rain accumulations of 4 to 7 inches from eastern Georgia to the southern Mid-Atlantic States and 1 to 3 inches over the northern Mid-Atlantic States and coastal southern New England. Isolated maximum amounts of 9 inches are possible in North Carolina and Virginia. This rainfall could lead to life-threatening flash floods.”

AIRS image of Michael
On Oct. 10 at 2:41 p.m. EDT (1841 UTC) the AIRS instrument aboard NASA’s Aqua satellite provided an infrared view of Hurricane Michael after landfall. The AIRS image showed that Michael still maintained a clear eye, and was surrounded by a large symmetric area of powerful thunderstorms. Credit: NASA JPL, Heidar Thrastarson

Watches and Warnings in Effect

On Oct. 11, a Storm Surge Watch is in effect for Ocracoke Inlet, North Carolina to Duck, North Carolina and a Tropical Storm Warning is in effect from Altamaha Sound, Georgia to Duck, North Carolina and the Pamlico and Albemarle Sounds.

Where’s Michael on Oct. 11?

On Oct. 11 at 8 a.m. EDT, the National Hurricane Center (NHC) noted that the center of Michael moving over South Carolina and that tropical-storm-force winds were occurring over portions of southeastern Georgia and central and eastern South Carolina. Michael’s center at the time was about 40 miles (65 km) west-northwest of Columbia, South Carolina.

At 8 a.m. EDT (1200 UTC), the center of Tropical Storm Michael was located near latitude 34.1 degrees north, and longitude 81.8 degrees west.  NHC said “Michael is moving toward the northeast near 21 mph (33 kph) and this motion is expected to continue with an increase in forward speed through tonight.  A turn toward the east-northeast and an even faster forward speed are expected on Friday.  On the forecast track, the center of Michael will continue to move across central South Carolina this morning, then move across portions of central and eastern North Carolina and southeastern Virginia this afternoon and this evening, and move into the Atlantic Ocean by late tonight or early Friday.”

Maximum sustained winds are near 50 mph (85 kph) with higher gusts. Little change in strength is expected today, with the strongest winds primarily spreading northward along the coast of the Carolinas.

Where Michael is Going

NHC forecaster Jack Beven noted “There is currently a small area of tropical-storm-force winds near the center, with a second area over the Atlantic well to the southeast of the center.  Michael should continue to weaken for the next 12 hours or so as the center moves through South Carolina and into North Carolina.  After that time, the cyclone should start to intensify due to baroclinic forcing, and it is expected to become a gale- or storm-force extratropical low around the 24-hour point.”

Michael is forecast to intensify as it becomes a post-tropical low over the Atlantic late tonight or early Friday, Oct. 12.

For details on Michael’s storm surge, rainfall, winds and tornadoes, visit: www.nhc.noaa.gov

By Rob Gutro
NASA’s Goddard Space Flight Center
Titli (Northern Indian Ocean) 2018

Oct. 10, 2018 – Satellite Sees Tropical Cyclone Titli Nearing Landfall in Northeastern India

Tropical Cyclone Titli formed late on Oct. 9 and continued to strengthen as it moved through the Northern Indian Ocean toward the Indian continent. NASA-NOAA’s Suomi NPP satellite provided a visible image of the storm.

Suomi NPP image of Titli
NASA-NOAA’s Suomi NPP satellite passed over the Northern Indian Ocean and captured a visible image of Tropical Cyclone Titli near the northeastern coast of India. Credit: NASA/NOAA/NRL

Suomi NPP passed over Titli on Oct. 10 at 3:42 a.m. EDT (0742 UTC) and the VIIRS instrument provided a visible image. The VIIRS image showed Titli had quickly strengthened and developed an eye surrounded by powerful storms. The Joint Typhoon Warning Center or JTWC noted, “Satellite imagery shows the system continued to rapidly intensify as it maintained an 18 nautical mile wide ragged eye and expansive rain bands that wrapped tighter into the center.

At 11 a.m. EDT (1500 UTC) Tropical Cyclone Title was located near 17.9 degrees north latitude and 85.3 degrees east longitude. That’s about 114 nautical miles Visakhapatnam, India. Titli is moving to the north-northwest and has maximum sustained winds near 90 knots

JTWC forecasters expect that Titli will make landfall over the northeastern coast of India northeast of Visakhapatnam by the end of the day on Oct. 10. By mid-day on Oct. 11 (Eastern Daylight Time) the system is expected to recurve northeastward over land.

By Rob Gutro 
NASA’s Goddard Space Flight Center