Oct. 10, 2018 – Satellite Sees Tropical Cyclone Luban Nearing Oman
Tropical Cyclone Luban continued to move through the Arabian Sea toward the coast of Oman when the NOAA-20 satellite provided a visible image of the storm.
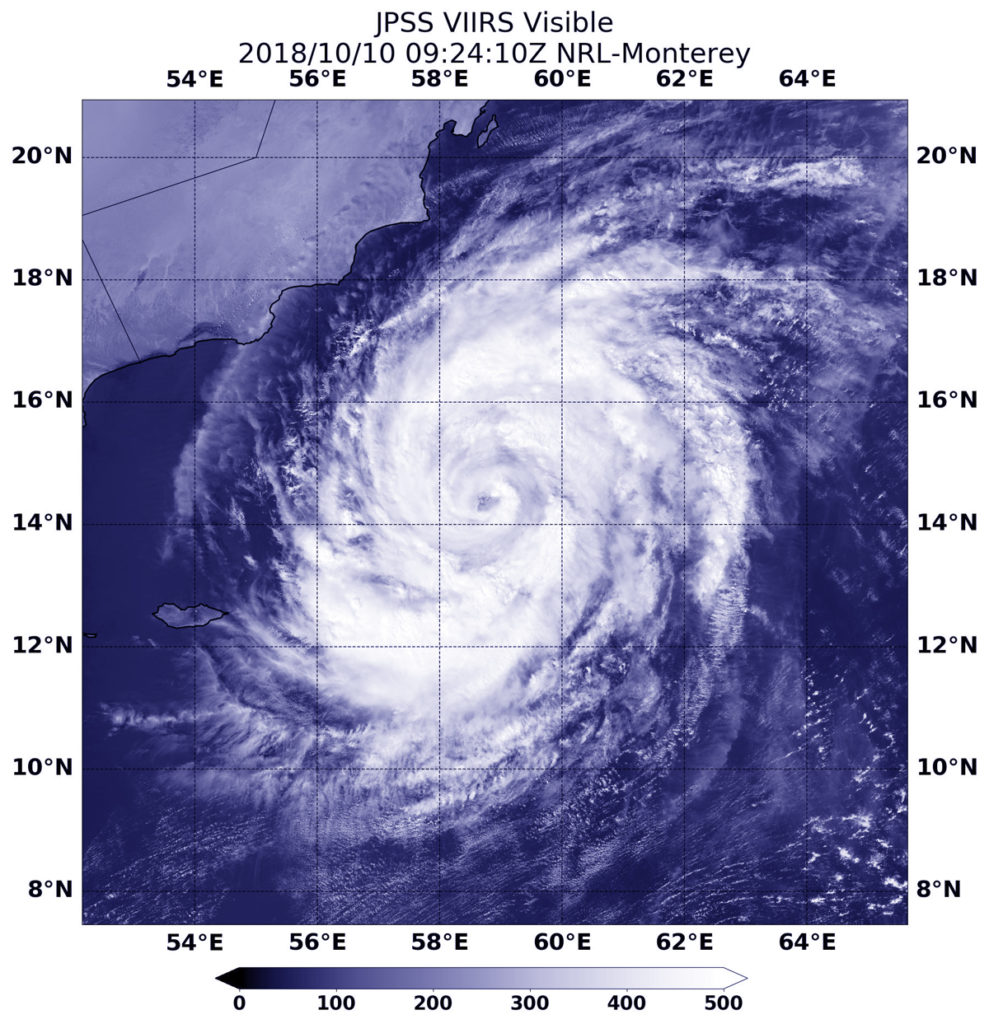
NOAA’s NOAA-20 satellite passed over the Northern Indian Ocean and captured a visible image of Tropical Cyclone Luban in the Arabian Sea, off the coast of Oman. Credit: NOAA/NRL
NOAA-20 passed over Luban on Oct. 10 at 5:24 a.m. EDT (0924 UTC) and the VIIRS instrument provided a visible image. The VIIRS instrument also flies aboard NASA-NOAA’s Suomi NPP satellite. The VIIRS image showed Luban had developed an eye that was surrounded by powerful storms. The Joint Typhoon Warning Center noted “Animated enhanced infrared satellite imagery shows the system has maintained deep central convection with spiral bands wrapped tightly toward the center.”
At 11 a.m. EDT (1500 UTC) Tropical cyclone Luban was located near 14.4 degrees north latitude and 58.5 degrees east longitude. That’s about 298 nautical miles east-southeast of Salalah, Oman. Luban is moving to the west-northwest and has maximum sustained winds near 75 knots
Luban is forecast to maintain current strength as it moves northwest, later to the west. The storm is expected to weaken before approaching the coast of Yemen. Luban is forecast to make landfall east of Mukalla, and dissipate inland.
The Global Precipitation Measurement mission or GPM core satellite provided an analysis of the rate in which rain is falling throughout the Eastern Pacific Ocean’s Tropical Storm Sergio. Sergio is close enough to Baja California now that it has triggered watches.
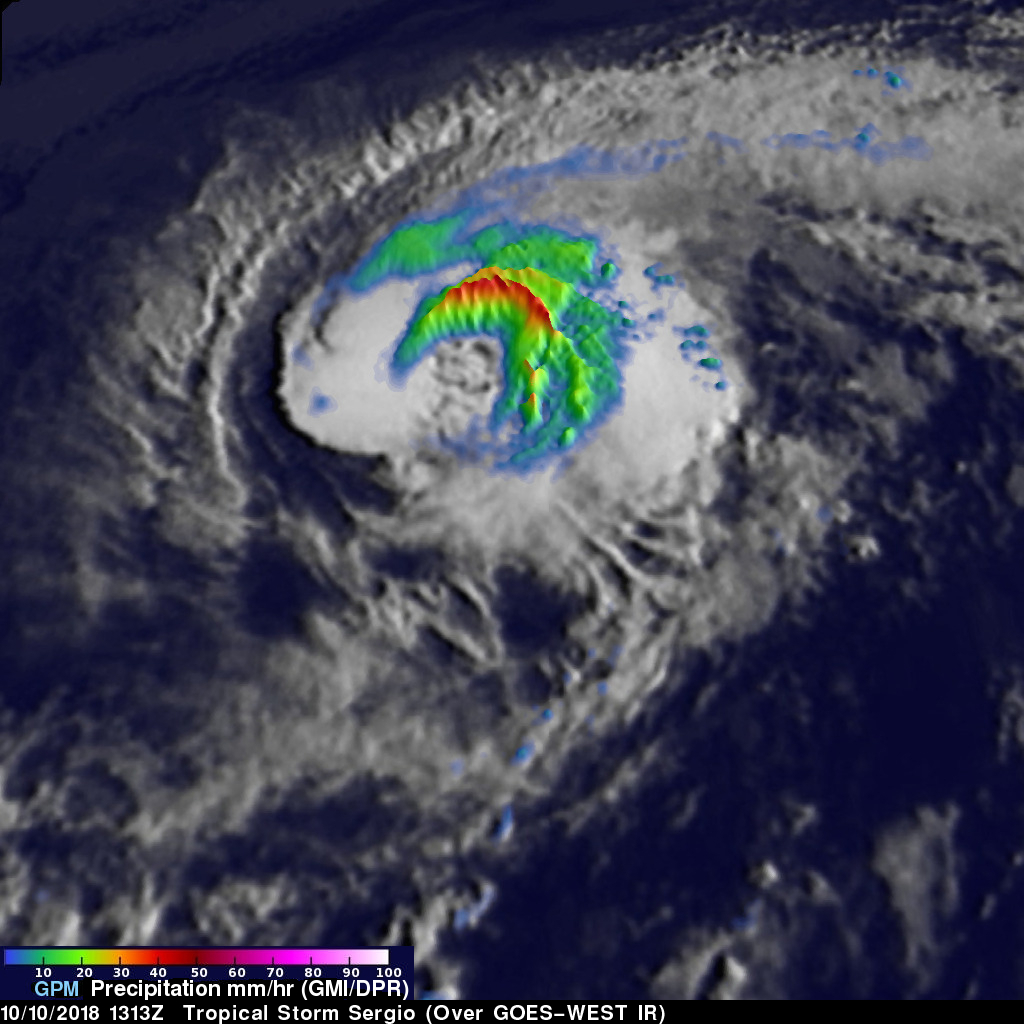
GPM measured rainfall within tropical storm Sergio on October 10, 2018 at 9:13 a.m. EDT (1313 UTC). Measurements indicated that the heaviest rainfall was north of Sergio’s eye like feature. Rain was shown to be falling at a rate of over 2.2 inches (55.9 mm) per hour in that part of the tropical storm. Credit: NASA/JAXA, Hal Pierce
A Tropical Storm Watch is in effect for the west coast of the Baja California peninsula from Punta Eugenia to Cabo San Lazaro, Mexico. A Tropical Storm Watch is also in effect for the east coast of the Baja California peninsula from Bahia San Juan Bautista to San Evaristo, Mexico. The National Hurricane Center or NHC said, “Interests elsewhere in the northern and central Baja California peninsula and northwestern Sonora should monitor the progress of Sergio. Additional watches or warnings may be required on later tonight or Thursday, Oct. 11.”
The GPM core observatory satellite’s Microwave Imager (GMI) and Dual-Frequency Precipitation Radar (DPR) instruments measured rainfall within tropical storm Sergio on October 10, 2018 at 9:13 a.m. EDT (1313 UTC). GPM’s radar only viewed storms on the eastern side of Sergio while the GMI swath included storms around the center of circulation. Measurements by GMI indicated that the heaviest rainfall was north of Sergio’s eye like feature. Rain was shown by GMI to be falling at a rate of over 2.2 inches (55.9 mm) per hour in that part of the tropical storm. GPM is a joint mission between NASA and the Japan Aerospace Exploration Agency, JAXA.
That heavy rainfall is in the forecast as Sergio begins and continues its landfall. Sergio is expected to produce total storm rainfall accumulations of 3 to 5 inches, with local amounts of 10 inches across the central portion of the Baja California peninsula and Sonora.
At 2 p.m. EDT (1800 UTC), the center of Tropical Storm Sergio was located near latitude 18.6 degrees north and longitude 123.0 degrees west. Sergio is moving toward the northeast near 13 mph (20 kph). A northeastward motion with an increase in forward speed is expected during the next few days. Maximum sustained winds remain near 65 mph (100 kph) with higher gusts. Some fluctuations in intensity are likely today, but gradual weakening is forecast during the next several days.
Sergio is being steered toward the northeast by a large mid-latitude trough or elongated area of low pressure. On the forecast track, the center of Sergio will approach the Pacific coast of Baja California Sur early Friday and then reach mainland Mexico late Friday. The National Hurricane Center (NHC) predicts that rainfall from Sergio and its remnants will produce life-threatening flash flooding and mudslides during the weekend when it passes over the mountainous terrain of northwestern Mexico, the Southern Plains, and the Ozarks.
Oct. 10, 2018 – NASA Sees Atlantic’s Leslie Become a Hurricane
NASA’s Aqua satellite captured an infrared image of Hurricane Leslie that revealed strong storms circled the center.
At 1:55 a.m. EDT (0555 UTC) on Oct. 3, the MODIS instrument that flies aboard NASA’s Aqua satellite gathered infrared data on Hurricane Leslie. Strongest thunderstorms circled the center and were in a thick band northeast of center where cloud top temperatures were as cold as minus 63 degrees Fahrenheit (minus 53 Celsius). Credit: NASA/NRL
At 1:55 a.m. EDT (0555 UTC) on Oct. 3 the MODIS instrument that flies aboard NASA’s Aqua satellite gathered infrared data on Leslie. Infrared data provides temperature information. Strongest thunderstorms were fragmented as they circled the center and were in a thick band northeast of center where MODIS found cloud top temperatures as cold as minus 63 degrees Fahrenheit (minus 53 Celsius). NASA research has shown that cloud tops with temperatures that cold were high in the troposphere and have the ability to generate heavy rain.
The National Hurricane Center or NHC noted “Deep convection surrounding the center of Leslie has become better organized overnight, with the development of a ragged eye in infrared satellite images.” A microwave image revealed a well-defined low-level eye with a ring of broken convection surrounding it.
At 5 a.m. EDT (0900 UTC), the center of Hurricane Leslie was located near latitude 29.6 degrees north and longitude 56.9 degrees west. That’s about 505 miles (810 km) east-southeast of Bermuda. Leslie is nearly stationary, and little motion is expected today. A northward motion is forecast to begin tonight, and this motion should continue through Friday night. Maximum sustained winds have increased to near 75 mph (120 kph) with higher gusts. Some additional strengthening is forecast during the next day or so.
NHC noted “The hurricane is forecast to remain within favorable environmental conditions consisting of warm water and low vertical wind shear over the next day or two. These conditions should allow for some additional strengthening.”
Oct. 10, 2018 – NASA Finds Nadine a Compact Tropical Storm
NASA’s Aqua satellite provided a visible image of Tropical Storm Nadine in the Eastern Atlantic that revealed it was a compact storm.
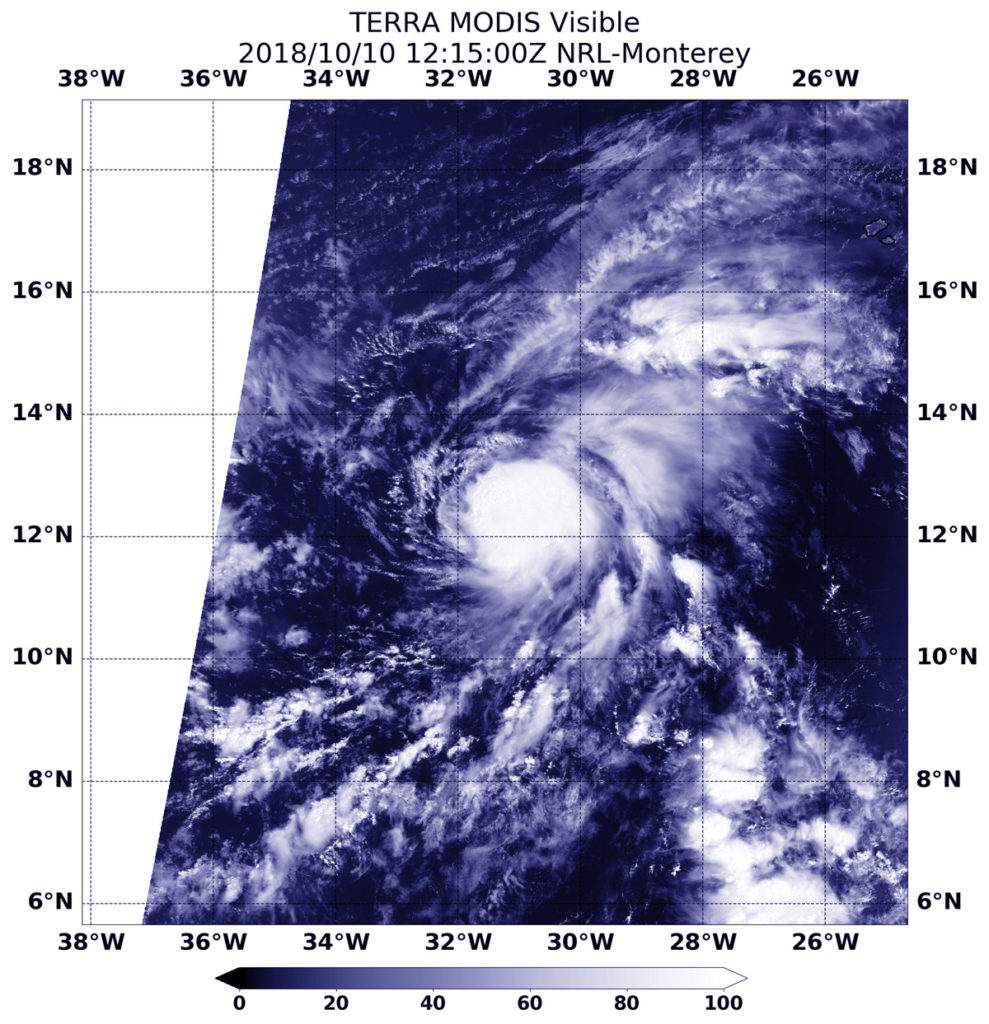
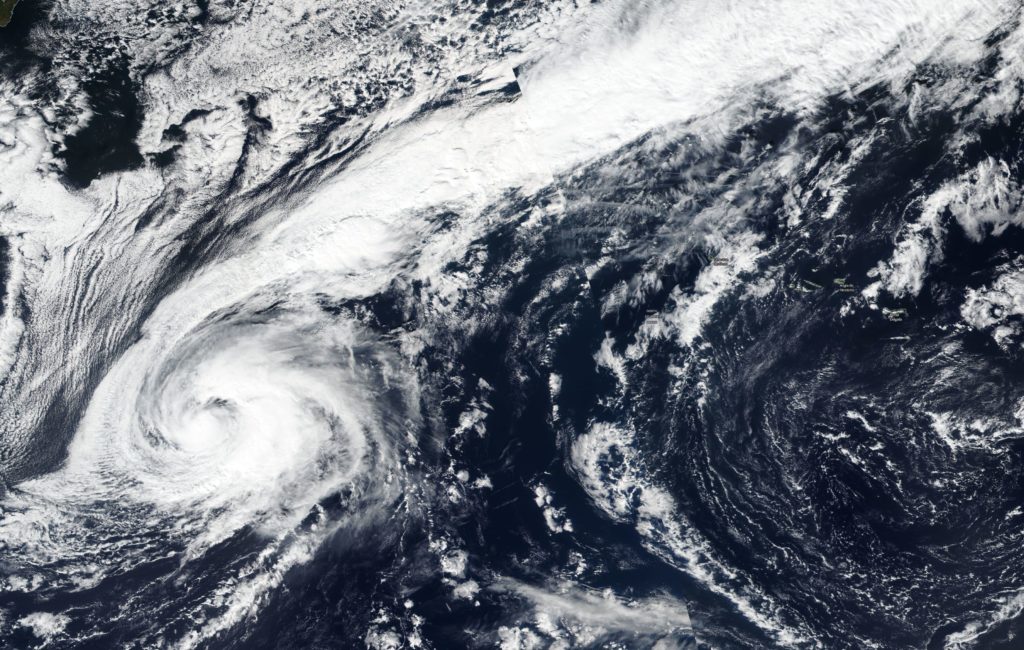
At 8:15 a.m. EDT (1215 UTC) on Oct. 10, the MODIS instrument that flies aboard NASA’s Aqua satellite revealed that Nadine is a compact tropical storm in the Eastern Atlantic Ocean. Credit: NASA/NRL
At 8:15 a.m. EDT (1215 UTC) on Oct. 10 the MODIS instrument that flies aboard NASA’s Aqua satellite obtained a visible light image of Tropical Storm Nadine that showed a small storm with clouds tightly circling the center. The National Hurricane Center or NHC noted that tropical-storm-force winds extend outward up to 80 miles (130 km) from the center. That makes the storm about 160 miles (260 km) in diameter.
At 11 a.m. EDT (1500 UTC), the center of Tropical Storm Nadine was located near latitude 12.6 degrees north and longitude 31.6 degrees west. That’s about 505 miles (815 km) west-southwest of the southernmost Cabo Verde Islands. Nadine is moving toward the northwest near 7 mph (11 kph), and a northwest to north-northwest motion is expected during the next couple of days. A turn toward the west-northwest is forecast to occur on Friday. Maximum sustained winds are near 65 mph (100 kph) with higher gusts.
Little change in strength is anticipated today, with weakening likely by tomorrow. Nadine is forecast to dissipate over the weekend.
Oct. 10, 2018 #4 – Image from International Space Station of the Eye of Hurricane Michael
A view of the eye of Hurricane Michael taken on Oct. 10, 2018 from the International Space Station currently orbiting Earth. The photo was taken by astronaut Dr. Serena M. Auñón-Chancellor, who began working with NASA as a Flight Surgeon in 2006. In 2009, she was selected as a NASA astronaut. Credit: NASA
Oct. 10, 2018 #3 – NASA Analyzes Category 4 Hurricane Michael Approaching Landfall
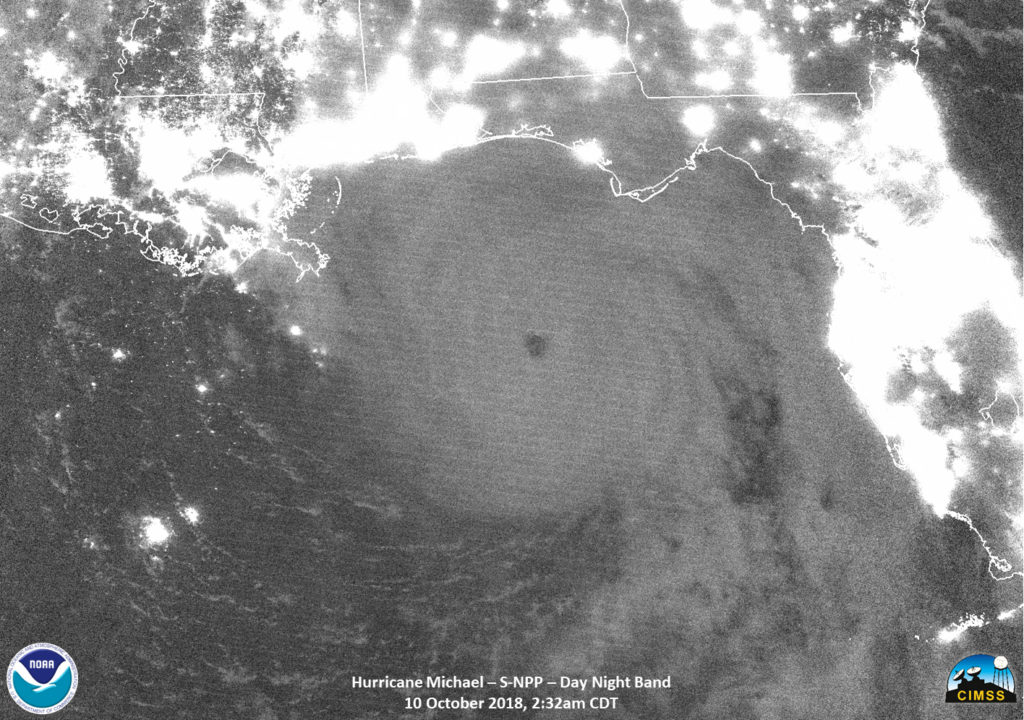
NASA-NOAA’s Suomi NPP satellite examined Hurricane Michael after it reached Category 4 status and neared the Florida Panhandle on Oct. 10. Suomi NPP provided an infrared and night-time view of the powerful storm.
NASA-NOAA’s Suomi NPP satellite obtained a night-time view of Hurricane Michael in the Gulf of Mexico on Oct. 10 at 0732 UTC (2:32 a.m. CDT). At the time, Michael was a Category 4 hurricane and the eye was so well-defined it could be seen clearly by moonlight. Lights from population centers along the Gulf coast appear white. Credit: NASA/NOAA/UW-SSEC-CIMSS, William Straka III
At 9 a.m. EDT on Oct. 10, water levels were quickly rising and winds increasing along the Florida panhandle as potentially catastrophic Michael approached.
Satellite Imagery Reveal
NASA-NOAA’s Suomi NPP satellite obtained an infrared view of Hurricane Michael in the Gulf of Mexico on Oct. 10 at 0732 UTC (2:32 a.m. CDT). At the time, Michael was a Category 4 hurricane and the eye was so well-defined it could be seen clearly by moonlight. Infrared imagery revealed strong thunderstorms and tropospheric gravity waves in the northwest and western and eastern edges of the hurricane.
National Hurricane Center forecaster Daniel Brown described Hurricane Michael in visible and infrared imagery, “Michael is an extremely impressive hurricane in visible and infrared satellite imagery this morning. The eye has continued to warm and become even more distinct, while remaining embedded within an area of very cold cloud tops.”
Many Warnings and Watches in Effect
NOAA’s National Hurricane Center has noted many warnings and watches in effect.
NASA-NOAA’s Suomi NPP satellite obtained an infrared view of Hurricane Michael in the Gulf of Mexico on Oct. 10 at 0732 UTC (2:32 a.m. CDT). At the time, Michael was a Category 4 hurricane and the image revealed strong thunderstorms and tropospheric gravity waves in the northwest and western and eastern edges of the hurricane. Credit: NASA/NOAA/UW-SSEC-CIMSS, William Straka III
A Storm Surge Warning is in effect for Okaloosa/Walton County Line, Florida to Anclote River, Florida. A Storm Surge Watch is in effect from Anclote River, Florida to Anna Maria Island Florida, including Tampa Bay. A Hurricane Warning is in effect from the Alabama/Florida border to Suwannee River, Florida. A Tropical Storm Warning is in effect from the Alabama/Florida border to the Mississippi/Alabama border and from Suwanee River Florida to Chassahowitzka, Florida and north of Fernandina Beach, Florida to Surf City, North Carolina. A Tropical Storm Watch is in effect from Chassahowitzka to Anna Maria Island, Florida, including Tampa Bay; from the Mississippi/Alabama border to the Mouth of the Pearl River; from Surf City, North Carolina to Duck, North Carolina, and for the Pamlico and Albemarle Sounds.
Status of Michael at 11 a.m. EDT on Wednesday, October 10, 2018
NOAA’s National Hurricane Center reported at 11 a.m. EDT (1500 UTC), the eye of Hurricane Michael was located near latitude 29.4 degrees north and longitude 86.0 degrees west.
Michael is moving toward the north-northeast near 14 mph (22 kph). A turn toward the northeast is expected this afternoon or tonight. A motion toward the northeast at a faster forward speed is forecast on Thursday through Friday night. On the forecast track, the core of Michael is expected to move ashore along the Florida Panhandle early this afternoon, move northeastward across the southeastern United States tonight and Thursday, and then move off the Mid-Atlantic coast away from the United States on Friday, Oct 12.
Data from NOAA and Air Force Reserve Hurricane Hunter aircraft indicate that maximum sustained winds are near 145 mph (230 kph) with higher gusts. Michael is an extremely dangerous category 4 hurricane on the Saffir-Simpson Hurricane Wind Scale. Some strengthening is still possible before landfall. After landfall, Michael should weaken as it crosses the southeastern United States. Michael is forecast to become a post-tropical cyclone on Friday, and strengthening is forecast as the system moves over the western Atlantic.
Hurricane-force winds extend outward up to 45 miles (75 km) from the center and tropical-storm-force winds extend outward up to 175 miles (280 km). A private weather station at Bald Point, Florida, recently reported a sustained wind of 54 mph (87 kph) with a gust to 61 mph (98 kph). A wind gust to 46 mph (74 kph) was recently reported inland at Tallahassee, Florida. The latest minimum central pressure based on data from the reconnaissance aircraft is 928 millibars.
Oct. 10, 2018 #2 – Hurricane Michael a Major Hurricane in the Gulf of Mexico
On Oct. 9, 2018 the 5 p.m. EDT update from the National Hurricane Center in Miami, Florida had upgraded Hurricane Michael to a Major Hurricane at Category 3 status. At that time, Michael had maximum sustained winds of 120 mph and NOAA’s GOES-East satellite provided a visible look at the hurricane. Michael has since strengthened into a Category 4 hurricane in the Gulf of Mexico. Credit: NOAA/ NASA MSFC, SPoRT
Oct. 10, 2018 #1 – Michael Heads for Florida (from the Earth Observatory)
In September, North Carolina took a direct hit from a hurricane. Now it is Florida’s turn.
What began as a tropical disturbance in the Caribbean Sea on October 2, 2018, went on to graze the Yucatan Peninsula and then strengthen into Hurricane Michael. The storm continued on its way through the Caribbean Sea and the Gulf of Mexico.
National Hurricane Center forecasters expect the storm to make landfall in the Florida Panhandle or Big Bend region around midday on October 10. This area has faced relatively few hurricanes in the past, at least for the U.S. state that sees more landfalling hurricanes than any other.
“Only eight major hurricanes on record have passed within or near the projected landfall of Michael, and only three of those (Eloise 1975, Opal 1995, and Dennis 2005) were in the past 100 years,” noted Marangelly Fuentes, a NASA atmospheric scientist who has been tracking the storm with models maintained by NASA’s Global Modeling and Assimilation Office (GMAO). “Michael’s projected intensity at landfall is currently category 3, which is worrisome because many people living in the Panhandle have little or no experience with storms this intense.”
As Michael approaches land, two key factors will help govern the intensity of the storm: ocean temperatures and wind shear, the difference in wind speeds at upper and lower parts of a storm. Warm ocean water and low wind shear are required to sustain or intensify a hurricane’s strength.
Michael managed to strengthen despite facing significant westerly shear in the Caribbean Sea on October 9, something the National Hurricane Center called “most unusual.” It then passed into an area of low shear and warm ocean water on October 10, where it continued to intensify.
The map above shows sea surface temperatures on October 8-9, 2018. Meteorologists generally agree that sea surface temperatures (SSTs) should be above 27.8°C (82°F) to sustain and intensify hurricanes (although there are some exceptions). The data for the map were compiled by Coral Reef Watch, which blends observations from the Suomi NPP, MTSAT, Meteosat, and GOES satellites and computer models. Information about the storm track and winds come from the National Hurricane Center.
The Moderate Resolution Imaging Spectroradiometer (MODIS) on NASA’s Aqua satellite acquired this natural-color image of Hurricane Michael on the afternoon of October 8, 2018.
Oct. 09, 2018 – NASA Sees the Development of Eastern Atlantic Tropical Storm Nadine
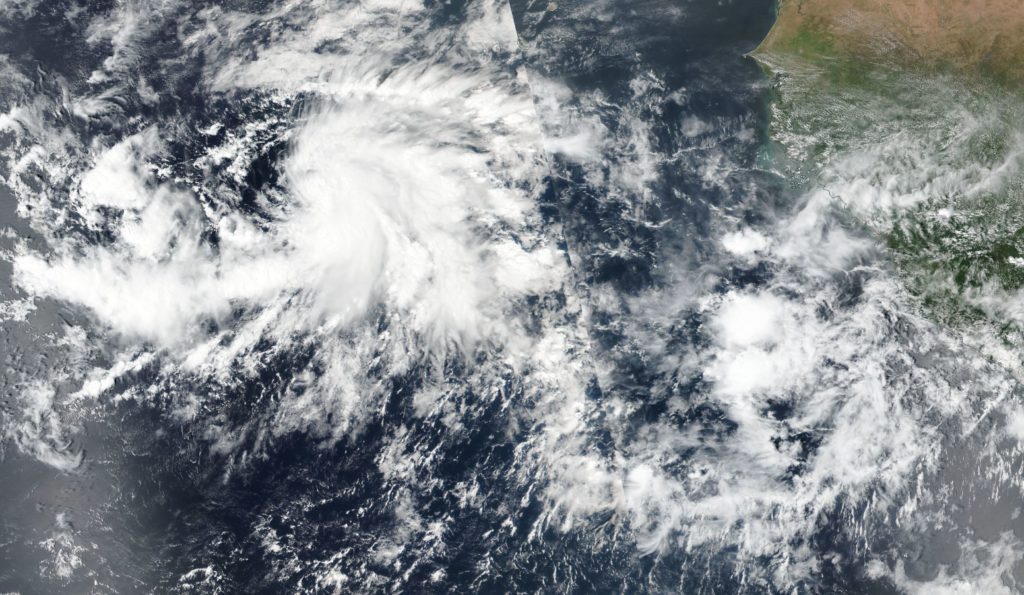
As Hurricane Michael barrels toward the U.S. states along the northwestern Gulf of Mexico, and Tropical Storm Leslie lingers in the Central Atlantic, Tropical Storm Nadine has formed off the west coast of Africa in the far eastern Atlantic. NASA-NOAA’s Suomi NPP satellite provided a visible image of the new named storm.
On Oct. 9, the VIIRS instrument aboard NASA-NOAA’s Suomi satellite provided a visible look at newly formed Tropical Storm Nadine, located off of Africa’s west coast. Credit: NASA Worldview, Earth Observing System Data and Information System (EOSDIS) / NOAA
On Oct. 9, the VIIRS instrument aboard NASA-NOAA’s Suomi satellite provided a visible look at Tropical Storm Nadine. The bulk of storms were east to south of center and wrapping into the low-level center.
NOAA’s National Hurricane Center noted st 11 a.m. EDT (1500 UTC) on Oct. 9 the center of Tropical Storm Nadine was located near latitude 10.5 North, longitude 30.0 West. That’s about 480 miles (770 km) southwest of the southernmost Cabo Verde Islands. Nadine is moving toward the west-northwest near 9 mph (15 kph), and this motion is expected to continue through tonight. A motion toward the northwest at a similar forward speed is forecast on Wednesday, Oct. 10 through Friday, Oct. 12. Maximum sustained winds have increased to near 40 mph (65 kph) with higher gusts.
The National Hurricane Center noted that additional strengthening is forecast through Wednesday, with weakening expected to begin by early Thursday. Nadine is forecast to weaken to a tropical depression on Friday.
Oct. 09, 2018 – A NASA Infrared View at Arabian Sea’s Tropical Cyclone Luban
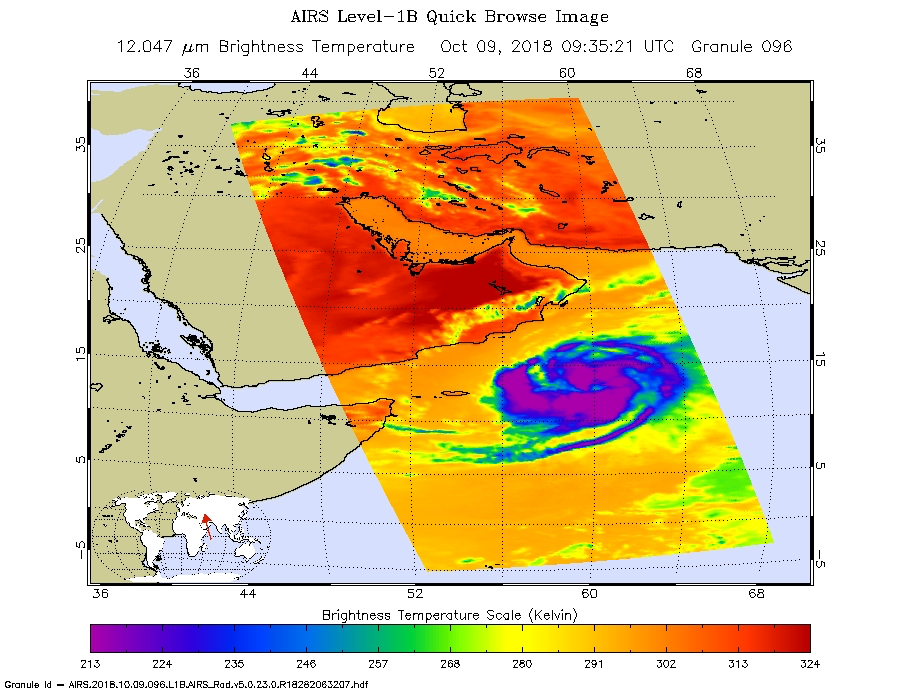
NASA’s Aqua satellite analyzed Tropical Cyclone Luban with infrared light to determine if the storm was intensifying or weakening. Luban formed on Oct. 8 in the Arabian Sea, Northern Indian Ocean and threatens Oman.
NASA’s Aqua satellite provided an infrared picture of Tropical Cyclone Luban’s cloud top temperatures from Oct. 9 at 5:35 a.m. EDT (0935 UTC). Strongest storms circled the center (purple) and appeared in thick bands of thunderstorms northeast and southwest of the center. Credit: NASA JPL, Heidar Thrastarson
The Atmospheric Infrared Sounder or AIRS instrument aboard NASA’s Aqua satellite passed over Luban on Oct. 9 at 5:35 a.m. EDT (0935 UTC). AIRS uses infrared light and infrared light provides scientists with temperature data and that’s important when trying to understand how strong storms can be. The higher the cloud tops, the colder and the stronger they are. So infrared light as that gathered by the AIRS instrument can identify the strongest areas of a tropical cyclone.
At the time Aqua passed overhead, coldest cloud top temperatures in thunderstorms appeared around the center and in thick bands of thunderstorms northeast and southwest of the center. Those temperatures were as cold as or colder than minus 63 degrees Fahrenheit (minus 53 degrees Celsius). The Joint Typhoon Warning Center noted that satellite data also shows a slowly consolidating system with weak, fragmented, but very expansive rain bands feeding into an obscured center.
At 5 a.m. EDT (0900 UTC), the center of Luban was located near latitude 13.2 degrees north and longitude 60.1 degrees east. That’s 416 nautical miles east-southeast of Salalah, Oman. Luban is moving toward the west-northwest. Maximum sustained winds were near 55 knots (63 mph/102 kph). Luban is forecast to intensify to 65 knots (74 mph) and make hurricane strength as it moves west-northwest and later west.
The storm will weaken before approaching the coasts of Oman and Yemen on Friday, Oct. 12.
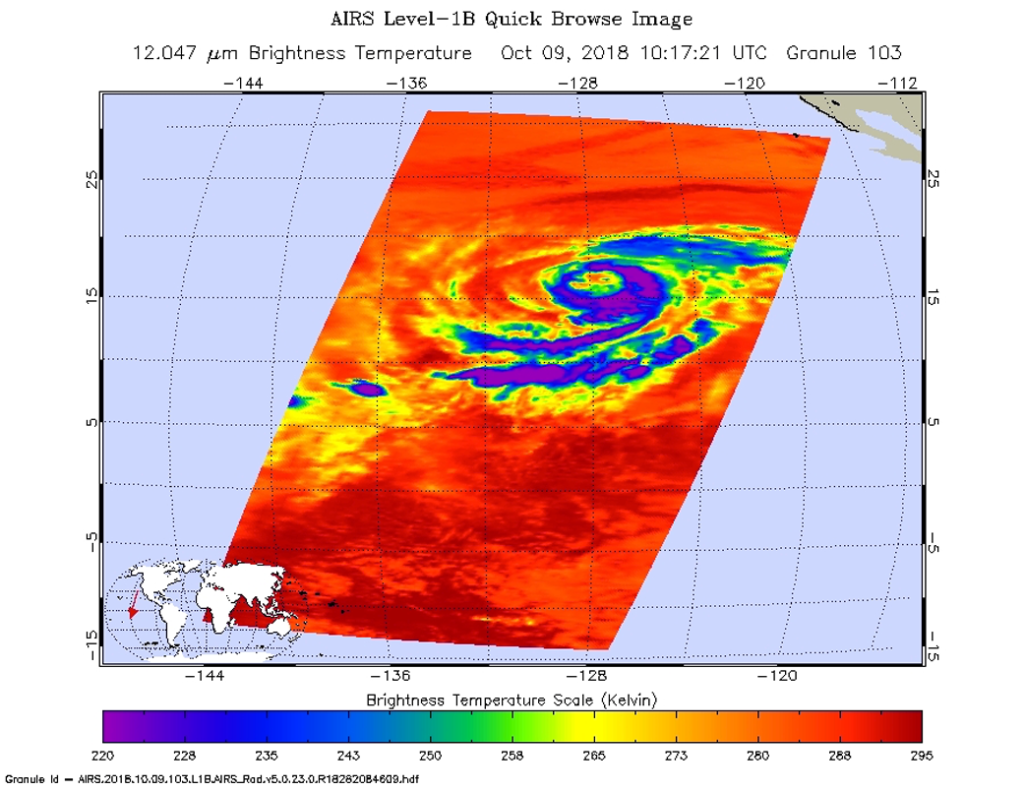
Oct. 09, 2018 – NASA Checks Out Hurricane Sergio’s Cloud Temperature
NASA’s Aqua satellite peered into Hurricane Sergio with infrared light to determine if the storm was intensifying or weakening. Infrared data showed cloud top temperatures were getting warmer on the western half of the storm, indicating the uplift of air in storms had weakened.
NASA’s Aqua satellite provided an infrared picture of Hurricane Sergio’s cloud top temperatures from Oct. 9 at 6:17 a.m. EDT (1017 UTC). Strongest storms circled the eye (purple) and appeared in fragmented bands of thunderstorms north and south of the center. Credit: NASA JPL, Heidar Thrastarson
The Atmospheric Infrared Sounder or AIRS instrument aboard NASA’s Aqua satellite passed over Hurricane Sergio on Oct. 9 at 6:17 a.m. EDT (1017 UTC). AIRS uses infrared light and infrared light provides scientists with temperature data and that’s important when trying to understand how strong storms can be. The higher the cloud tops, the colder and the stronger they are. So infrared light as that gathered by the AIRS instrument can identify the strongest areas of a tropical cyclone.
At the time Aqua passed overhead, coldest cloud top temperatures in thunderstorms circled the eye and appeared in fragmented bands of thunderstorms north and south of the center. Those temperatures were as cold as or colder than minus 63 degrees Fahrenheit (minus 53 degrees Celsius). The exception was on the western side of the storm, where cloud top temperatures were warming, meaning they were not getting as high in the atmosphere.
Despite the slow weakening the hurricane still has a large but well-defined inner-core in the low and mid-levels.
The National Hurricane Center noted at 11 a.m. EDT (1500 UTC), the center of Hurricane Sergio was located near latitude 16.6 degrees north and longitude 127.4 degrees west. That’s 1,215 miles (1,960 km) west-southwest of the southern tip of Baja California, Mexico.
Sergio is moving toward the northeast near 7 mph (11 kph). A faster northeastward motion is expected for the next several days. Maximum sustained winds have decreased to near 80 mph (130 kph) with higher gusts. Gradual weakening is anticipated during the next several days.
NHC noted that there are no coastal watches or warnings in effect, but interests in Baja California Sur should monitor the progress of Sergio.
Oct. 09, 2018 – NASA Gets Tropical Storm Leslie by the Tail
What appears to be a long tail in satellite imagery of Tropical Storm Leslie is in fact clouds associated with a nearby elongated area of low pressure, or a trough.
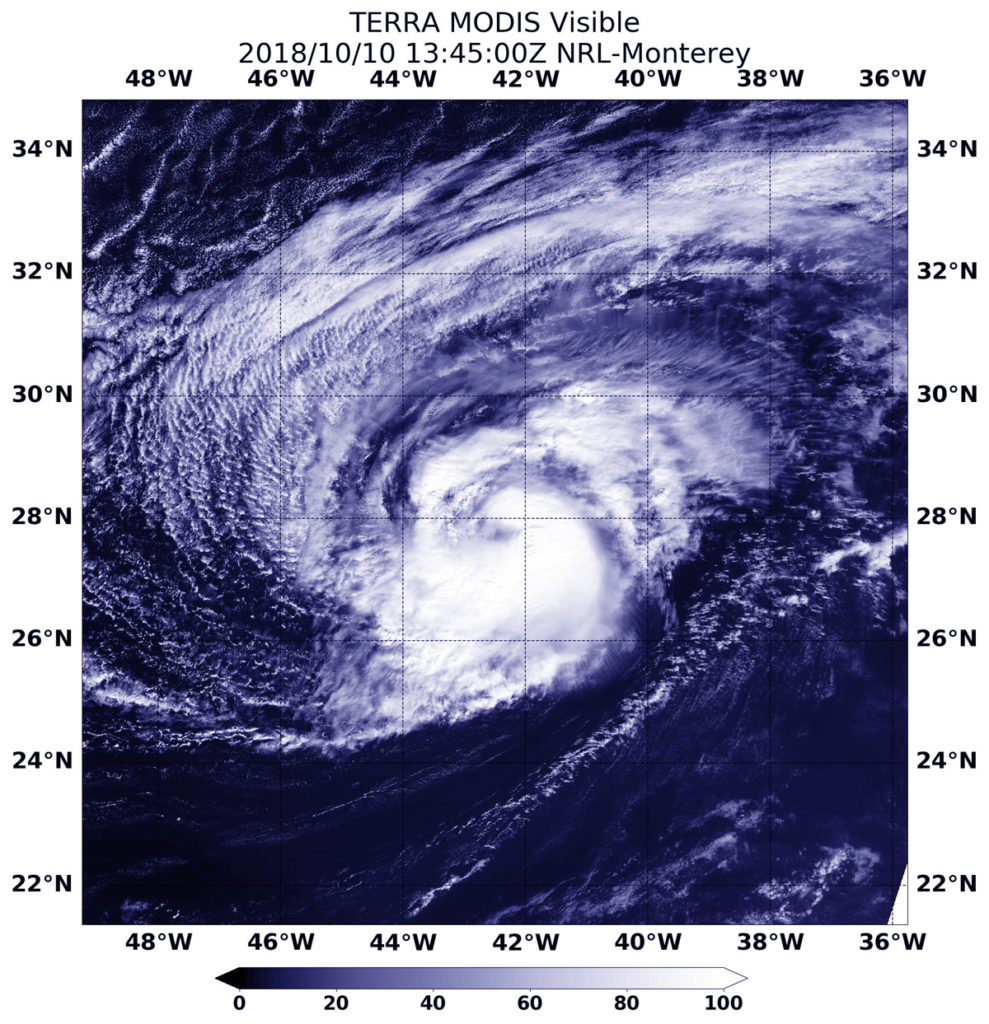
On Oct. 8, the VIIRS instrument aboard NASA-NOAA’s Suomi satellite provided a visible look at Tropical Storm Leslie that showed a developing eye and clouds associated with an elongated area of low pressure that extends over the United Kingdom. Credit: NASA Worldview, Earth Observing System Data and Information System (EOSDIS)
On Oct. 8, the VIIRS instrument aboard NASA-NOAA’s Suomi satellite provided a visible look at Tropical Storm Leslie that showed a developing eye and a long stretch of clouds associated with an elongated area of low pressure that extends over the United Kingdom.
NOAA’s National Hurricane Center noted “Although the winds have not yet increased, the surface center of the tropical storm has become more embedded within its cold cloud tops and several recent microwave overpasses indicate that the cyclone is beginning to establish an inner-core. Strengthening is therefore still expected, and Leslie is forecast to become a hurricane by tomorrow.”
At 11 a.m. EDT (1500 UTC) on Oct. 9 the center of Tropical Storm Leslie was located near latitude 31.3 degrees north and longitude 43.5 degrees west. That’s 1,045 miles (1,680 km) west-southwest of the Azores Islands. Leslie is moving toward the south-southeast near 13 mph (20 kph), and this general motion is expected to continue for the next day or so. Maximum sustained winds are near 65 mph (100 kph) with higher gusts. Some strengthening is anticipated, and Leslie is forecast to become a hurricane again on Wednesday.
The National Hurricane Center cites different forecast modeling possibilities for Leslie. It could merge with a trough or elongated area of low pressure or Leslie could remain a tropical cyclone almost indefinitely if it continues meandering over the northern Atlantic.