Ferdinand – Southern Indian Ocean

Feb. 28, 2020 – NASA Finds Dry Air Sapping Tropical Cyclone Ferdinand’s Strength  

When NASA’s Aqua satellite passed over the Southern Indian Ocean on Feb. 28, it obtained water vapor data on Tropical Cyclone Ferdinand. The water vapor data indicated the storm was being eaten away by dry air.

NASA’s Aqua satellite passed over Tropical Cyclone Ferdinand on Feb. 28 at 1:55 a.m. EST (0555 UTC) and the Moderate Resolution Imaging Spectroradiometer or MODIS instrument gathered water vapor content and temperature information. The MODIS image showed highest concentrations of water vapor and coldest cloud top temperatures had diminished in the last 24 hours, forming a compact area of strong storms around center of circulation. Microwave imagery even suggested an eye in the center.
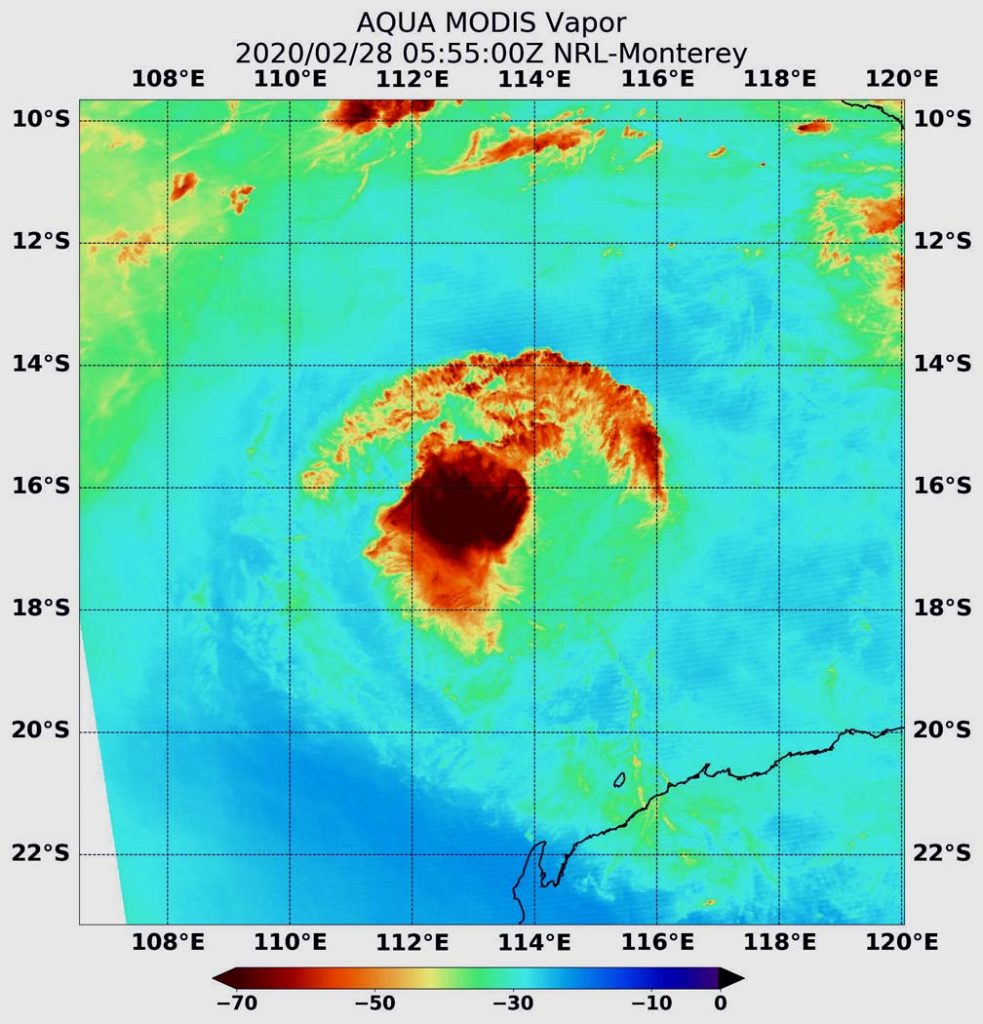
red/black blob and arc suggest a hurricane on a field of bluegreen data
On Feb. 28 at 1:55 a.m. EST (0555 UTC), NASA’s Aqua satellite passed over Tropical Cyclone Ferdinand, located in the Southern Indian Ocean and off Australia’s Pilbara coast. Aqua found highest concentrations of water vapor (brown) and coldest cloud top temperatures were shrinking around the center. Credits: NASA/NRL

The MODIS water vapor data revealed that small area of strong storms had cloud top temperatures as cold as or colder than minus 70 degrees Fahrenheit (minus 56.6 degrees Celsius). Storms with cloud top temperatures that cold have the capability to produce heavy rainfall. There was also a small fragmented band of thunderstorms northeast of the center. The imagery showed dry air moving in from west of the center quelled thunderstorm development and precipitation in the western quadrant of the storm.

Water vapor analysis of tropical cyclones tells forecasters how much potential a storm has to develop. Water vapor releases latent heat as it condenses into liquid. That liquid becomes clouds and thunderstorms that make up a tropical cyclone. Temperature is important when trying to understand how strong storms can be. The higher the cloud tops, the colder and the stronger the storms.

The Australian Bureau of Meteorology (ABM) said on Feb. 28, “Ferdinand is a small tropical cyclone located well north of the Western Australia coast.”

On Friday, February 28 at 8:00 p.m. AWST, ABM said Ferdinand had sustained winds near the center of 95 kilometers (51 knots/59 miles) per hour. Ferdinand is located near 16.2 degrees south latitude and 112.8 degrees east longitude, about 650 kilometers (404 miles) north-northwest of Onslow and 760 kilometers (472 miles) northwest of Port Hedland.

Forecasters at the ABM expect Ferdinand to move further northwest and weaken below tropical cyclone strength over the next 24 hours. The Joint Typhoon Warning Center said Ferdinand is forecast to weaken steadily due to dry air continuing to funnel into the storm, and vertical wind shear persisting. Ferdinand is forecast to dissipate by Sunday, March 1, but could dissipate earlier.

NASA’s Aqua satellite is one in a fleet of NASA satellites that provide data for hurricane research.

Tropical cyclones are the most powerful weather event on Earth. NASA’s expertise in space and scientific exploration contributes to essential services provided to the American people by other federal agencies, such as hurricane weather forecasting.

Rob Gutro
NASA’s Goddard Space Flight Center, Greenbelt, Md.

Ferdinand – Southern Indian Ocean

Feb. 27, 2020 – NASA Finds Dry Air Affecting Tropical Cyclone Ferdinand

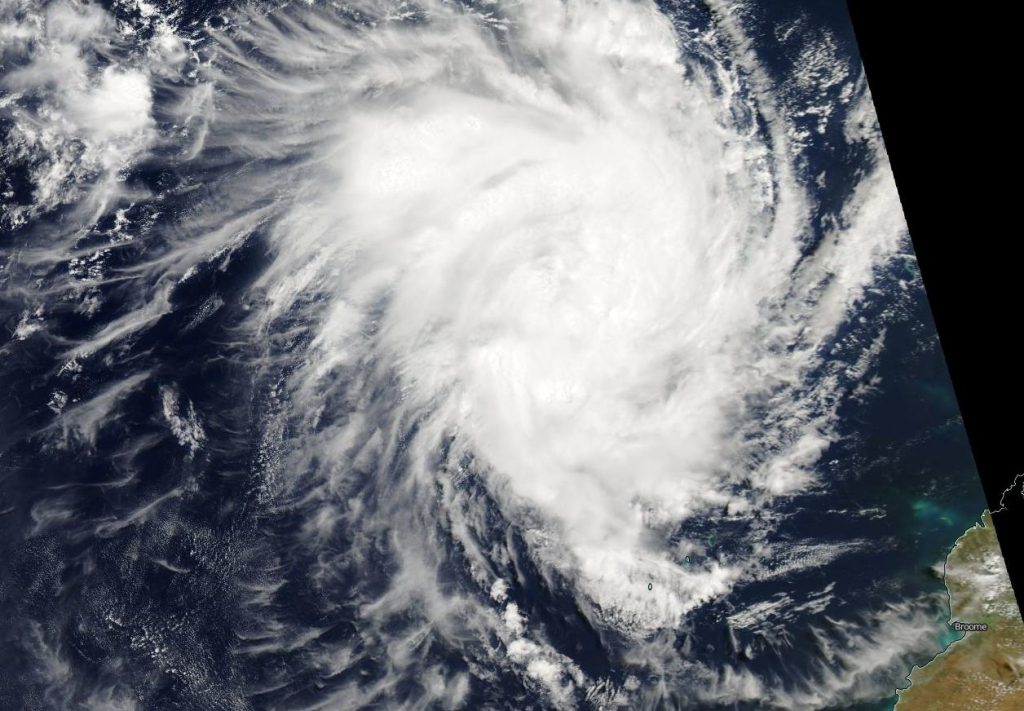
NASA’s Terra satellite revealed the bulk of Ferdinand’s strong storms were in its eastern quadrant. Dry air is moving into the storm, causing it to weaken.

On Feb. 27, the Moderate Imaging Spectroradiometer or MODIS instrument that flies aboard NASA’s Terra satellite provided a visible image of Ferdinand, located in the Southern Indian Ocean, and far off the Pilbara coast of Western Australia. Satellite imagery depicts a rapidly weakening system. A satellite image revealed a well-defined low-level circulation center with limited deep convection over the eastern quadrant of the storm.

On Feb. 27, 2020, the MODIS instrument that flies aboard NASA’s Terra satellite provided a visible image of Tropical Cyclone Ferdinand far off the Pilbara coast of Western Australia. Credit: NASA Worldview

Animated total precipitable water imagery and recent visible imagery indicate a significant amount of dry air is moving into the storm, which is the main factor in the weakening trend. Dry air inhibits development of thunderstorms, which make up tropical cyclones.

At 10 a.m. EST (1500 UTC), Ferdinand had maximum sustained winds near 55 knots (63 mph/102 kph) and continued to weaken. It was centered near 16.9 degrees south latitude and 114.0 degrees east longitude, about 324 nautical miles north of Learmonth, Australia. Ferdinand was moving to the southwest.

The Joint Typhoon Warning Center forecasts Ferdinand to continue weaken and move on a westerly track, further away from land.

NASA’s Terra satellite is one in a fleet of NASA satellites that provide data for hurricane research.

Tropical cyclones are the most powerful weather event on Earth. NASA’s expertise in space and scientific exploration contributes to essential services provided to the American people by other federal agencies, such as hurricane weather forecasting.

Rob Gutro
NASA’s Goddard Space Flight Center, Greenbelt, Md.
Ferdinand – Southern Indian Ocean

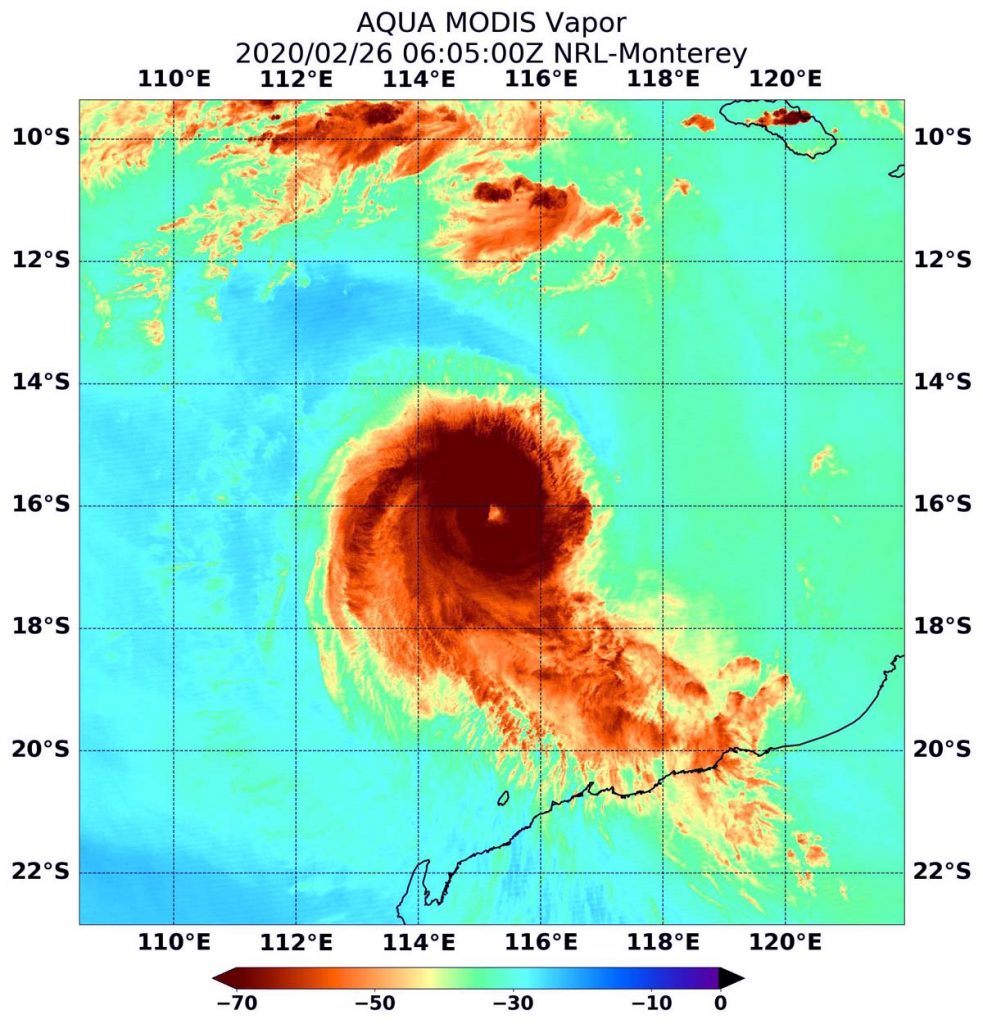
Feb. 26, 2020 – NASA Analyzes Tropical Cyclone Ferdinand’s Water Vapor Concentration 

When NASA’s Aqua satellite passed over the Southern Indian Ocean on Feb. 26, it gathered water vapor data that provided information about the intensity of Tropical Cyclone Ferdinand.

NASA’s Aqua satellite passed over Tropical Cyclone Ferdinand on Feb. 26 at 1:05 a.m. EST (0605 UTC),) and the Moderate Resolution Imaging Spectroradiometer or MODIS instrument gathered water vapor content and temperature information. The MODIS image showed highest concentrations of water vapor and coldest cloud top temperatures were around the center of circulation.

On Feb. 26 at 1:05 a.m. EST (0605 UTC), NASA’s Aqua satellite passed over Tropical Cyclone Ferdinand, located in the Southern Indian Ocean and off Australia’s Pilbara coast. Aqua found highest concentrations of water vapor (brown) and coldest cloud top temperatures were around the center. Credits: NASA/NRL

MODIS data also showed coldest cloud top temperatures were as cold as or colder than minus 70 degrees Fahrenheit (minus 56.6 degrees Celsius) in those storms. Storms with cloud top temperatures that cold have the capability to produce heavy rainfall.

Water vapor analysis of tropical cyclones tells forecasters how much potential a storm has to develop. Water vapor releases latent heat as it condenses into liquid. That liquid becomes clouds and thunderstorms that make up a tropical cyclone. Temperature is important when trying to understand how strong storms can be. The higher the cloud tops, the colder and the stronger the storms.

The Australian Bureau of Meteorology (ABM) noted that no warnings were in effect for Western Australia as Ferdinand remains far from land areas. At 8:57 p.m. WST (7:57 a.m. EST), ABM noted that Severe Tropical Cyclone Ferdinand (Category 3) was located near 16.4 degrees south latitude and 114.8 degrees east longitude, about 530 km (329 miles) north-northwest of Karratha and 620 km (385 miles) north of Exmouth and moving southwest at 7 kilometers (4 miles) per hour. ABM forecasts that Ferdinand will move slowly toward the west-southwest over the next few days and remain well north of the Western Australia mainland. On Thursday, Feb. 27, the Ferdinand is expected to begin a weakening trend and may be below tropical cyclone intensity late in the week or early weekend. No significant impacts are expected over the Western Australia mainland.

NASA’s Aqua satellite is one in a fleet of NASA satellites that provide data for hurricane research.

Tropical cyclones are the most powerful weather event on Earth. NASA’s expertise in space and scientific exploration contributes to essential services provided to the American people by other federal agencies, such as hurricane weather forecasting.

For updates from ABM, visit: http://www.bom.gov.au/

Rob Gutro
NASA’s Goddard Space Flight Center, Greenbelt, Md.

Ferdinand – Southern Indian Ocean

Feb. 25, 2020 – NASA-NOAA Satellite Gets an Eye-opening Look at Tropical Cyclone Ferdinand

Tropical Cyclone Ferdinand has strengthened and developed an eye, as confirmed in imagery from NASA-NOAA’s Suomi NPP satellite.

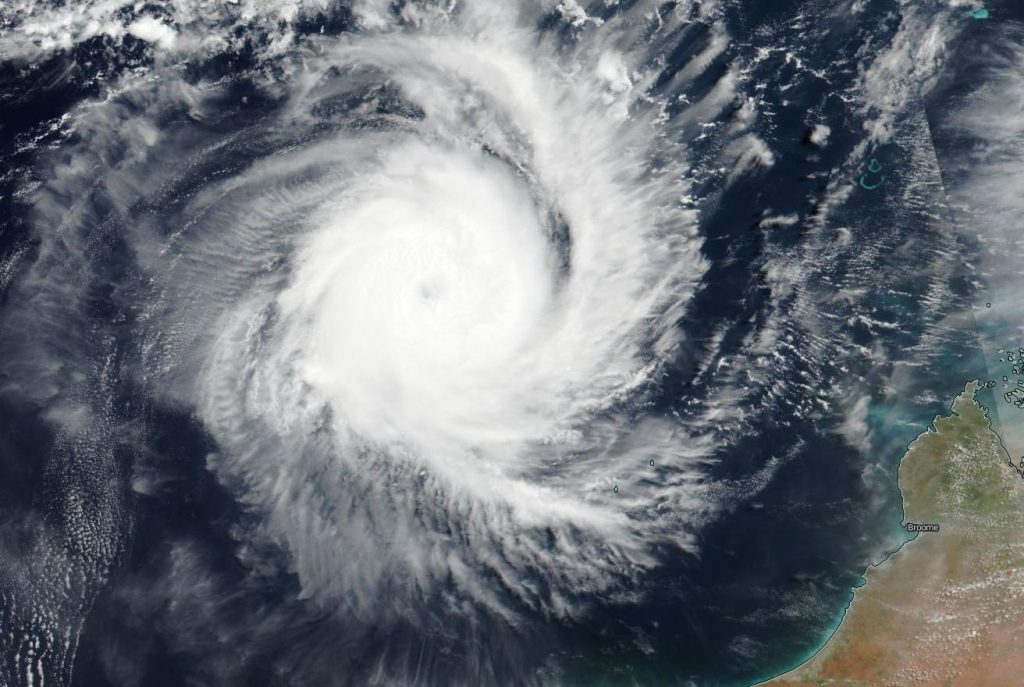
The Visible Infrared Imaging Radiometer Suite (VIIRS) instrument aboard Suomi NPP provided a visible image of Ferdinand and showed that an eye opened as the storm continued to intensify. A thick band of powerful bands of thunderstorms circled the eye.

NASA-NOAA’s Suomi NPP satellite found that Tropical Cyclone Ferdinand has developed an eye as it continued to strengthen in the Southern Indian Ocean on Feb. 25, 2020. Credit: NASA Worldview, Earth Observing System Data and Information System (EOSDIS)

On Feb. 25 at 10 a.m. EST (1500 UTC), the Joint Typhoon Warning Center of JTWC noted that Tropical cyclone Ferdinand was located near 15.8 degrees south latitude and 116.5 degrees east longitude, approximately, 413 nautical miles north-northeast of Learmonth, Western Australia. Ferdinand was moving to the southwest and maximum sustained winds had increased to 90 knots (104 mph/167 kph). That is the equivalent of a Category 2 hurricane on the Saffir-Simpson hurricane wind scale.

JTWC forecasts that Ferdinand will move southwest and strengthen slightly more before starting to weaken. The storm is then expected to curve to the northwest through the Southern Indian Ocean.

Tropical cyclones are the most powerful weather event on Earth. NASA’s expertise in space and scientific exploration contributes to essential services provided to the American people by other federal agencies, such as hurricane weather forecasting.

Rob Gutro
NASA’s Goddard Space Flight Center, Greenbelt, Md.
Ferdinand – Southern Indian Ocean

Feb. 24, 2020 – NASA Aqua Satellite Sees Tropical Storm Ferdinand Strengthening

Tropical Storm Ferdinand formed in the Southern Indian Ocean and NASA’s Aqua satellite provided forecasters with a visible image of the strengthening storm.

Ferdinand formed on Feb. 23 by 4 p.m. EST (2100 UTC) as Tropical Cyclone 20S. By Feb. 24, it had been renamed Ferdinand.

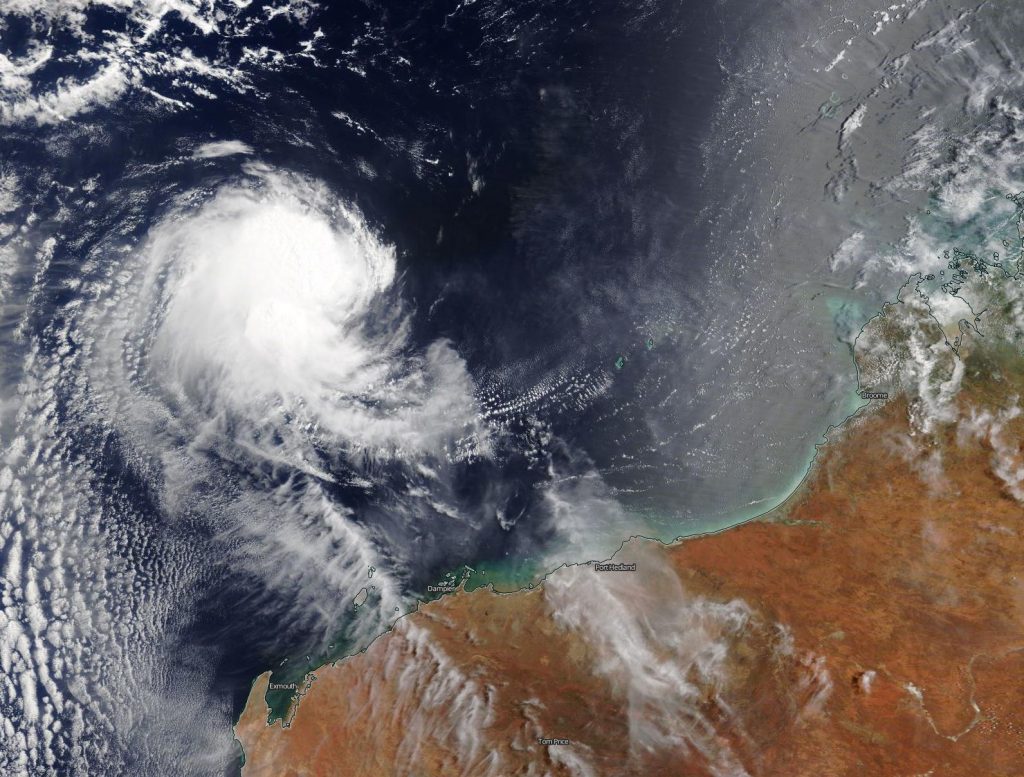
On Feb. 24, 2020, the MODIS instrument that flies aboard NASA’s Aqua satellite provided a visible image of Tropical Cyclone Ferdinand in the Southern Indian Ocean, far off the coast of Western Australia. Credit: NASA Worldview

On Feb. 24 at 4 a.m. EST (0900 UTC), the Joint Typhoon Warning Center (JTWC) noted Ferdinand had maximum sustained winds near 55 knots (63 mph/102 kph). At that time, it was located near 14.9 degrees south latitude and 117.5 degrees east longitude about 484 nautical miles north-northeast of Learmonth, Australia.

On Feb. 24 at 4 a.m., EST (0900 UTC), the Moderate Imaging Spectroradiometer or MODIS instrument that flies aboard NASA’s Aqua satellite provided a visible image of Ferdinand that showed strong bands of thunderstorms wrapping into the low-level center. In addition to the visible image, animated enhanced infrared satellite imagery revealed a rapidly consolidating system with a developing central dense overcast feature. A microwave image also revealed an eye feature.

The JTWC forecast calls for Ferdinand to move southwest and peak at 90 knots (104 mph/167 kph) on Feb. 26 before weakening. Ferdinand is not expected to affect mainland Australia as it if forecast to turn west and away from Western Australia.

NASA’s Aqua satellite is one in a fleet of NASA satellites that provide data for hurricane research.

Tropical cyclones are the most powerful weather event on Earth. NASA’s expertise in space and scientific exploration contributes to essential services provided to the American people by other federal agencies, such as hurricane weather forecasting.

Rob Gutro
NASA’s Goddard Space Flight Center, Greenbelt, Md.