Esther – South Indian Ocean

Feb. 28, 2020 – NASA Finds Ex-Esther Soaking Australia’s Kimberley Coast

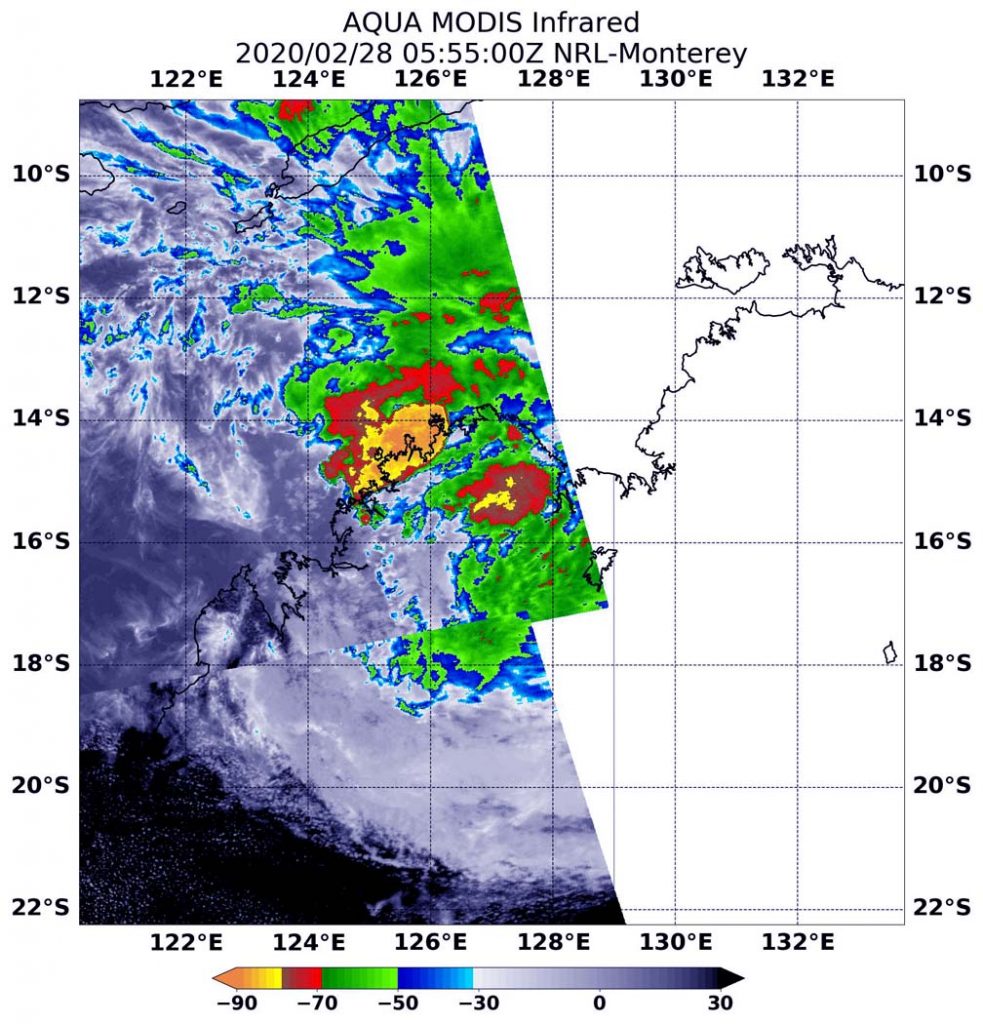
Infrared imagery from NASA’s Terra satellite showed strong storms were soaking parts of Australia’s Kimberley coast on Feb. 28.

The Australia Bureau of Meteorology (ABM) issued a Severe Weather Warning for damaging winds and heavy rainfall for people in parts of Kimberley district. Locations which may be affected include Kununurra, Wyndham, Lake Argyle, Warmun, Mitchell Plateau, Troughton Island and Mount Burnett. ABM cautioned that widespread daily rainfall totals of 50 to 150mm (~2 to 6 inches) with isolated falls 250 to 300mm (~10 to 12 inches) are possible. Ex-Tropical Cyclone Esther may cause damaging winds, averaging 35 to 45 kph (22 to 28 mph) with wind gusts potentially reaching 90 kph (56 mph).

grid with land outlines, half painted with red and green hurricane data
On Feb. 28 at 12:55 a.m. EST (0555 UTC) the MODIS instrument that flies aboard NASA’s Terra satellite found coldest cloud top temperatures (yellow) in two areas around Esther’s center of circulation. They were as cold as or colder than minus 80 degrees Fahrenheit (minus 62.2 Celsius). One area of strong storms were off the coast and over the Southern Indian Ocean. That area stretched from Kalumburu in the northeast, southwest to off the coast of Prince Regent National Park. The second area of strongest storms were over land, from Prince Regent National Park stretching east to Drysdale River National Park. Credit: NASA/NRL

A Flood Watch has also been issued for parts of the Kimberley District. For further details please refer to http://www.bom.gov.au/wa/warnings/.

Tropical cyclones are made of up hundreds of thunderstorms, and infrared data can show where the strongest storms are located. They can do that because infrared data provides temperature information, and the strongest thunderstorms that reach highest into the atmosphere have the coldest cloud top temperatures. Convection is rising air that condenses and forms the thunderstorms that make up a tropical cyclone. When it is strong, it pushes clouds higher into the troposphere (the layer of atmosphere closest to Earth’s surface). The higher you go in the troposphere, the colder the air temperature gets, so colder cloud tops indicate stronger, higher storm cloud tops.

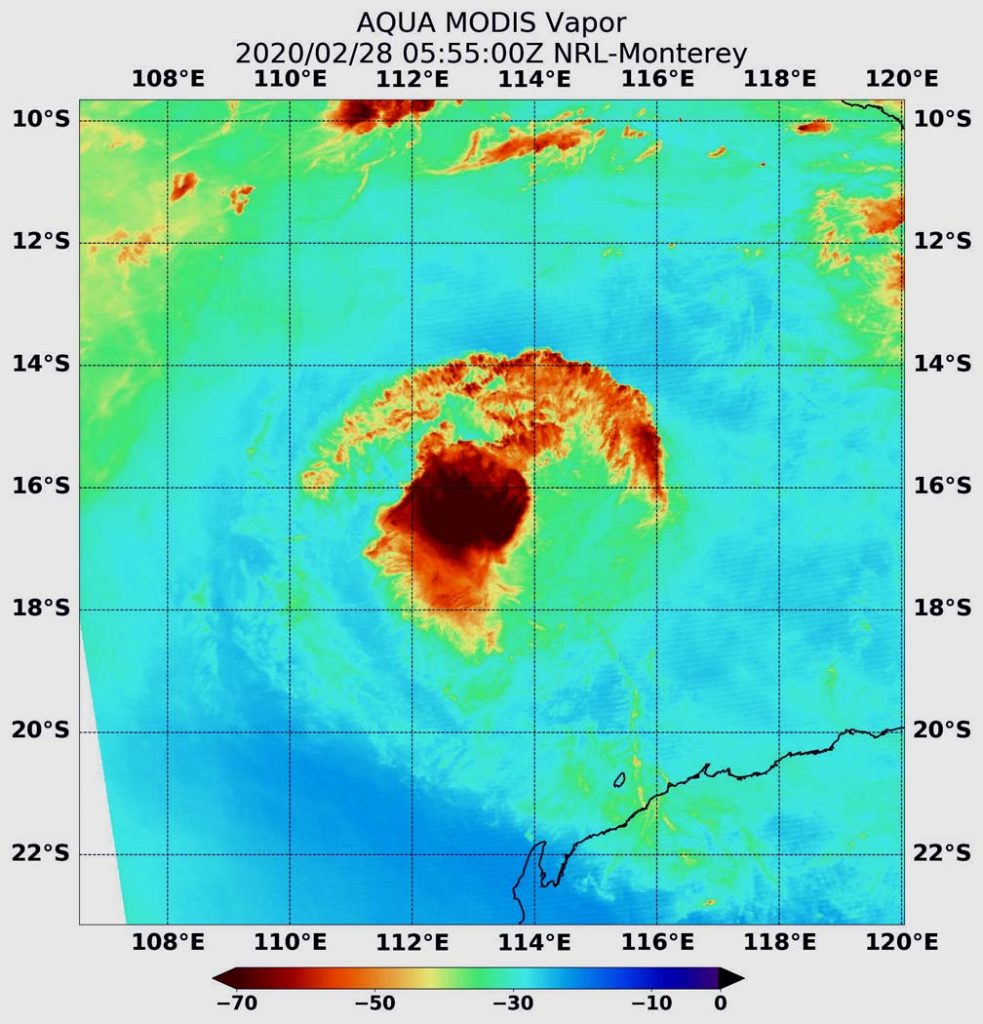
On Feb. 28 at 12:55 a.m. EST (0555 UTC) the Moderate Imaging Spectroradiometer or MODIS instrument that flies aboard NASA’s Terra satellite found coldest cloud top temperatures in two areas around Esther’s center of circulation. They were as cold as or colder than minus 80 degrees Fahrenheit (minus 62.2 Celsius). NASA research has found that cloud top temperatures that cold indicate strong storms with the potential to generate heavy rainfall.

One area of strong storms were off the coast and over the Southern Indian Ocean. That area stretched from Kalumburu in the northeast, southwest to off the coast of Prince Regent National Park. The second area of strongest storms were over land, from Prince Regent National Park stretching east to Drysdale River National Park.

At 3 a.m. EST (4 p.m. AWST) on Feb. 28, the center of Ex-Tropical Cyclone Esther was located about 78 miles (125 km) west of Wyndham. Esther was moving towards the west at about 9 miles per hour (15 kph).

Ex-Tropical Cyclone Esther is expected to continue moving in a westerly direction, through the northern Kimberley during Friday, Feb. 28.

ABM noted that the Severe Weather Warning is likely to extend further to the west and south later on Saturday, Feb. 29 as the Esther moves in a general southwesterly direction through the Kimberley.

Tropical cyclones are the most powerful weather event on Earth. NASA researches these storms to determine how they rapidly intensify, develop and behave. NASA’s expertise in space and scientific exploration contributes to essential services provided to the American people by other federal agencies, such as hurricane weather forecasting.

Rob Gutro
NASA’s Goddard Space Flight Center, Greenbelt, Md.


Ferdinand – Southern Indian Ocean

Feb. 28, 2020 – NASA Finds Dry Air Sapping Tropical Cyclone Ferdinand’s Strength  

When NASA’s Aqua satellite passed over the Southern Indian Ocean on Feb. 28, it obtained water vapor data on Tropical Cyclone Ferdinand. The water vapor data indicated the storm was being eaten away by dry air.

NASA’s Aqua satellite passed over Tropical Cyclone Ferdinand on Feb. 28 at 1:55 a.m. EST (0555 UTC) and the Moderate Resolution Imaging Spectroradiometer or MODIS instrument gathered water vapor content and temperature information. The MODIS image showed highest concentrations of water vapor and coldest cloud top temperatures had diminished in the last 24 hours, forming a compact area of strong storms around center of circulation. Microwave imagery even suggested an eye in the center.

red/black blob and arc suggest a hurricane on a field of bluegreen data
On Feb. 28 at 1:55 a.m. EST (0555 UTC), NASA’s Aqua satellite passed over Tropical Cyclone Ferdinand, located in the Southern Indian Ocean and off Australia’s Pilbara coast. Aqua found highest concentrations of water vapor (brown) and coldest cloud top temperatures were shrinking around the center. Credits: NASA/NRL

The MODIS water vapor data revealed that small area of strong storms had cloud top temperatures as cold as or colder than minus 70 degrees Fahrenheit (minus 56.6 degrees Celsius). Storms with cloud top temperatures that cold have the capability to produce heavy rainfall. There was also a small fragmented band of thunderstorms northeast of the center. The imagery showed dry air moving in from west of the center quelled thunderstorm development and precipitation in the western quadrant of the storm.

Water vapor analysis of tropical cyclones tells forecasters how much potential a storm has to develop. Water vapor releases latent heat as it condenses into liquid. That liquid becomes clouds and thunderstorms that make up a tropical cyclone. Temperature is important when trying to understand how strong storms can be. The higher the cloud tops, the colder and the stronger the storms.

The Australian Bureau of Meteorology (ABM) said on Feb. 28, “Ferdinand is a small tropical cyclone located well north of the Western Australia coast.”

On Friday, February 28 at 8:00 p.m. AWST, ABM said Ferdinand had sustained winds near the center of 95 kilometers (51 knots/59 miles) per hour. Ferdinand is located near 16.2 degrees south latitude and 112.8 degrees east longitude, about 650 kilometers (404 miles) north-northwest of Onslow and 760 kilometers (472 miles) northwest of Port Hedland.

Forecasters at the ABM expect Ferdinand to move further northwest and weaken below tropical cyclone strength over the next 24 hours. The Joint Typhoon Warning Center said Ferdinand is forecast to weaken steadily due to dry air continuing to funnel into the storm, and vertical wind shear persisting. Ferdinand is forecast to dissipate by Sunday, March 1, but could dissipate earlier.

NASA’s Aqua satellite is one in a fleet of NASA satellites that provide data for hurricane research.

Tropical cyclones are the most powerful weather event on Earth. NASA’s expertise in space and scientific exploration contributes to essential services provided to the American people by other federal agencies, such as hurricane weather forecasting.

Rob Gutro
NASA’s Goddard Space Flight Center, Greenbelt, Md.

Hagibis – Northwestern Pacific Ocean

Oct. 8, 2019 NASA-NOAA Satellite Paints a Picture of Supertyphoon Hagibis

NASA-NOAA’s Suomi NPP satellite passed over the Northwestern Pacific Ocean and used infrared light to obtain temperature information about Supertyphoon Hagibis’ cold cloud tops, painting a picture of a super-strong storm.

NASA-NOAA’s Suomi NPP satellite used infrared light to analyze the strength of storms within the structure of Hagibis. Infrared data provides temperature information, and the strongest thunderstorms that reach high into the atmosphere have the coldest cloud top temperatures. This data is helpful to forecasters because storms are not uniform around tropical cyclones and it helps pinpoint where the strongest storms are located.

hurricane surrounded in red and green swirls
NASA-NOAA’s Suomi NPP satellite passed over Supertyphoon Hagibis and the VIIRS instrument aboard captured this image of the storm on Oct. 7 at 12:15 pm. EDT (1615 UTC). Suomi NPP found strongest thunderstorms around the center had cloud top temperatures as cold as 190 Kelvin (gray) or minus 117 degrees Fahrenheit (minus 83.1 Celsius). Credit: NASA/NOAA/UWM-CIMSS, William Straka III

Just before Suomi NPP passed over Hagibis, at 1:09 p.m. EDT (1509 UTC) Super Typhoon Hagibis passed just to the south of the island of Anatahan. The Joint Typhoon Warning Center or JTWC noted at 11 a.m. EDT (1500 UTC), that Hagibis  had winds of around 140 knots, which would make it a Super Typhoon or the equivalent of a Category 5 storm.

Oct. 7 at 12:15 pm. EDT (1615 UTC) the Visible Infrared Imaging Radiometer Suite (VIIRS) instrument aboard Suomi NPP found strongest thunderstorms circling Hagibis’ center had cloud top temperatures as cold as 190 Kelvin or minus 117 degrees Fahrenheit (minus 83.1 Celsius).  NASA research has shown that cloud top temperatures that cold indicate strong storms have the potential to generate heavy rainfall.

hurricane in black and white, with red/yellow eye
NASA-NOAA’s Suomi NPP satellite passed over Supertyphoon Hagibis and the VIIRS instrument aboard captured this close up image of the storm on Oct. 7 at 12:15 pm. EDT (1615 UTC). Suomi NPP found strongest thunderstorms around the center had cloud top temperatures as cold as 190 Kelvin (gray) or minus 117 degrees Fahrenheit (minus 83.1 Celsius). Credit: NASA/NOAA/UWM-CIMSS, William Straka III

On Oct. 8 at 5 a.m. EDT (0900 UTC), a Typhoon Warning remains in effect for Alamagan and Pagan Islands in the CNMI. Damaging winds of 39 to 50 mph will continue through at least late this evening. A Tropical Storm Warning remains in effect for Agrihan Island. Tropical storm conditions, including damaging winds of 39 to 50 mph, are expected through this evening.

At 10 p.m. CHST (8 a.m. EDT or 1200 UTC) the National Weather Service office in Tiyan, Guam noted that the center of Super Typhoon Hagibis was located near Latitude 18.5 degrees North and Longitude 141.8 degrees East. Hagibis is moving northwest at 15 mph. It is expected to maintain this general course with a decrease in forward speed during the next 24 hours. Maximum sustained winds remain at 155 mph. Hagibis is forecast to maintain this intensity through Wednesday then begin a gradual weakening trend.

Typhoon force winds extend outward from the center up to 85 miles. Tropical storm force winds extend outward from the center up to 300 miles to the northeast and up to 240 miles elsewhere.

Hagibis is moving northwest. The system will turn to the north as it goes through a weakening trend on approach to Japan.

Hurricanes are the most powerful weather event on Earth. NASA’s expertise in space and scientific exploration contributes to essential services provided to the American people by other federal agencies, such as hurricane weather forecasting.

By Rob Gutro
NASA’s Goddard Space Flight Center

Hagibis – Western Pacific Ocean

Oct. 7, 2019 – NASA Examines Super Typhoon Hagibis, Warnings in Guam, Micronesia

Super typhoon Hagibis formed quickly over the weekend of Oct. 5 and 6. NASA’s Aqua satellite passed over the storm after it achieved super typhoon status on Oct. 6 found extremely cold cloud top temperatures, indicating very powerful storms with heavy rainfall potential. Warnings are in effect in Guam and throughout the Federated States of Micronesia on Oct. 7.

One of the ways NASA researches tropical cyclones is using infrared data that provides temperature information. The AIRS instrument aboard NASA’s Aqua satellite captured a look at those temperatures in Super Typhoon Hagibis and gave insight into the storm’s rainfall potential near Guam.

Purple swirl in rainbow sea
On Oct 6 at 3:53 p.m. EDT (1553 UTC) NASA’s Aqua satellite analyzed Hagibis when it was a tropical storm using the Atmospheric Infrared Sounder or AIRS instrument. AIRS found coldest cloud top temperatures as cold as or colder than (purple) minus 63 degrees Fahrenheit (minus 53 degrees Celsius) around the center and in a thick band of thunderstorms east and west of center. Credit: NASA JPL/Heidar Thrastarson

Cloud top temperatures provide information to forecasters about where the strongest storms are located within a tropical cyclone. Tropical cyclones do not always have uniform strength, and some sides have stronger sides than others. The stronger the storms, the higher they extend into the troposphere, and they have the colder cloud temperatures. NASA provides data to forecasters at NOAA’s National Hurricane Center or NHC so they can incorporate in their forecasting. Those data went into the forecasts from the National Weather Service office in Tiyan, Guam on Oct. 7.

Oct. 6 at 3:53 p.m. EDT (1553 UTC) NASA’s Aqua satellite analyzed the storm using the Atmospheric Infrared Sounder or AIRS instrument when Hagibis was a tropical storm and strengthening quickly. When Aqua passed overhead, Hagibis had maximum sustained winds near 50 knots (57 mph/93 kph).

AIRS found coldest cloud top temperatures as cold as or colder than minus 63 degrees Fahrenheit (minus 53 degrees Celsius) around Super Typhoon Hagibis’ center and in thick bands of thunderstorms west and east of center. Those cloud top temperatures continued to drop as Hagibis strengthened from a tropical storm into a typhoon.

NASA research has shown that cloud top temperatures that cold indicate strong storms that have the capability to create heavy rain.

tornado over the ocean
NASA-NOAA’s Suomi NPP satellite captured this visible image of Super typhoon Hagibis on Oct. 7 affecting both Guam and the Federated States of Micronesia. It showed a well-defined eye covered by high clouds, surrounded by powerful thunderstorms. A thick, powerful band of thunderstorms was wrapping into the low-level center from the southwest, and a large band of thunderstorms stretched around the eastern quadrant and extended far south of the storm. Credit: NASA Worldview, Earth Observing System Data and Information System (EOSDIS)

Hagibis reached super typhoon status on Oct. 7 by 5 a.m. EDT (0900 UTC). After that time, the Visible Infrared Imaging Radiometer Suite (VIIRS) instrument aboard Suomi NPP provided a visible image of Super typhoon Hagibis. It showed a well-defined eye covered by high clouds, surrounded by powerful thunderstorms. A thick, powerful band of thunderstorms was wrapping into the low-level center from the southwest, and a large band of thunderstorms stretched around the eastern quadrant and extended far south of the storm. The storm was affecting both Guam and the Federated States of Micronesia.

A Typhoon Warning remains in effect for Saipan, Tinian, Alamagan and Pagan Islands in the CNMI. Typhoon conditions, including destructive winds of 74 mph or more, will continue through Tuesday morning. A Tropical Storm Warning remains in effect for Guam, Rota and Agrihan Islands. Tropical storm conditions, including damaging winds of 39 to 73 mph, are expected through Tuesday morning. A Flash Flood Warning is in effect for Rota, Tinian and Saipan.

At 8 a.m. EDT (1200 UTC), the NWS of Guam noted the center of Super typhoon Hagibis was located by satellite near Latitude 16.1 degrees North and Longitude 146.7 degrees East. That is about 70 miles east-southeast of Anatahan and about 95 miles northeast of Saipan.

Hagibis is moving west-northwest at 15 mph and is expected to maintain this general course and speed through Tuesday. Hagibis is expected to pass over Anatahan later tonight. Maximum sustained winds remain at 150 mph. Hagibis is forecast to intensify further through Tuesday, possibly reaching peak intensity Tuesday evening, Oct. 8.

The AIRS instrument is one of six instruments flying on board NASA’s Aqua satellite, launched on May 4, 2002.

Hurricanes are the most powerful weather event on Earth. NASA’s expertise in space and scientific exploration contributes to essential services provided to the American people by other federal agencies, such as hurricane weather forecasting.

For updated forecasts, visit: https://www.weather.gov/gum/

By Rob Gutro
NASA’s Goddard Space Flight Center

Walaka (Central Pacific Ocean) 2018

Oct. 05, 2018 -NASA Finds Walaka Weakened, Now a Tropical Storm

NASA’s Aqua satellite passed over the Central Pacific Ocean and obtained infrared data on Walaka, now weakened to a tropical storm with limited thunderstorm development.

hurricane in blue with green data center
At 5:40 a.m. EDT (0940 UTC) on Oct. 5, the MODIS instrument aboard NASA’s Aqua satellite looked at Tropical Storm Walaka in infrared light. MODIS found coldest cloud tops (yellow) in a small area near the center had temperatures near minus 63 degrees Fahrenheit (minus 53 degrees Celsius). Credit: NASA/NRL

Infrared satellite data at 5:40 a.m. EDT (0940 UTC) on Oct. 5, the Moderate Resolution Imaging Spectroradiometer or MODIS instrument aboard NASA’s Aqua satellite revealed strongest storms with the coldest cloud top temperatures in a small area around Walaka’s center. MODIS found coldest cloud tops had temperatures near minus 63 degrees Fahrenheit (minus 53 degrees Celsius). NASA research has found that cloud top temperatures that cold have the capability to generate heavy rainfall.

At 5 a.m. EDT (0900 UTC) on Friday, Oct. 5, the center of Tropical Storm Walaka was located near latitude 30.6 degrees north and longitude 168.3 degrees west. Walaka is about 480 miles (770 km) north-northwest of the French Frigate Shoals. Walaka is moving toward the north-northwest near 6 mph (9 kph). A turn toward the north is expected tonight, followed by an acceleration toward the northeast Friday through Saturday. Maximum sustained winds are near 70 mph (110 kph) with higher gusts.  Some weakening is forecast during the next 48 hours.

The Central Pacific Hurricane Center or CPHC said Walaka will be over cool sea surface temperatures through the remainder of its journey across the Pacific, with vertical wind shear expected to increase substantially Friday night and Saturday, Oct. 6. Steady weakening is forecast during the next 48 hours, and Walaka is expected to become a post-tropical low by Saturday evening.

CPHC noted that ocean swells generated by Walaka will continue to affect portions of the Papahanaumokuakea Marine National Monument and the main Hawaiian Islands tonight, Oct. 5.

For updated forecasts, visit:  http://www.prh.noaa.gov/cphc

Rob Gutro
NASA’ Goddard Space Flight Center

Sergio (Eastern Pacific Ocean) 2018

Oct. 05, 2018 – NOAA’s GOES-West Night-time View of Hurricane Sergio

Hurricane Sergio continued to look impressive on satellite imagery when NOAA’s GOES-West satellite viewed the storm in infrared light.

hurricane in blue with data bar
NOAA’s GOES-West satellite provided a night-time view of powerful Hurricane Sergio on Oct. 5 at 6:01 a.m. PDT (9:01 a.m. EDT/1301 UTC) in the Eastern Pacific Ocean. Sergio had a clear eye with powerful thunderstorms circling the center.  Credit: NOAA/NRL

NOAA’s GOES-West satellite sits at a fixed position in orbit and covers the western U.S. and the Eastern and Central Pacific Ocean. GOES satellites circle the Earth in a geosynchronous orbit, which means they orbit the equatorial plane of the Earth at a speed matching the Earth’s rotation. This allows them to hover continuously over one position on the surface. NOAA’s GOES-West satellite provided a night-time view of powerful Hurricane Sergio on Oct. 5 at 6:01 a.m. PDT (9:01 a.m. EDT/1301 UTC) in the Eastern Pacific Ocean. The imagery showed that Sergio had a clear eye with powerful thunderstorms circling the center.

At 2 a.m. PDT (5 a.m. EDT/0900 UTC), the eye of Hurricane Sergio was located near latitude 16.0 degrees north and longitude 121.2 degrees west.  Sergio is moving toward the west-northwest near 8 mph (13 kph). A turn toward the west and west-southwest at a similar speed is expected during the next 24 hours.  Sergio should then turn back to the west and northwest over the weekend. Maximum sustained winds have decreased to near 120 mph (195 kph) with higher gusts. Sergio is a category 3 hurricane on the Saffir-Simpson Hurricane Wind Scale.  Additional gradual weakening is forecast during the next several days, but Sergio is expected to remain a hurricane through the middle of next week.

NOAA manages the GOES series of satellites and the NASA/NOAA GOES Project at NASA’s Goddard Space Flight Center in Greenbelt, Maryland, is responsible for building and launching the GOES satellites.

For updated forecasts, visit: www.nhc.noaa.gov

By Rob Gutro
NASA Goddard Space Flight Center