Ivo (Eastern Pacific)

Aug. 23, 2019 – GPM Finds Heavy Rain Occurring in a Weaker Tropical Storm Ivo

Tropical Storm Ivo may have weakened in the overnight hours from Aug. 22 to Aug. 23, but the Global Precipitation Measurement mission or GPM core satellite has found that the storm is still generating heavy rainfall over the Eastern Pacific Ocean.
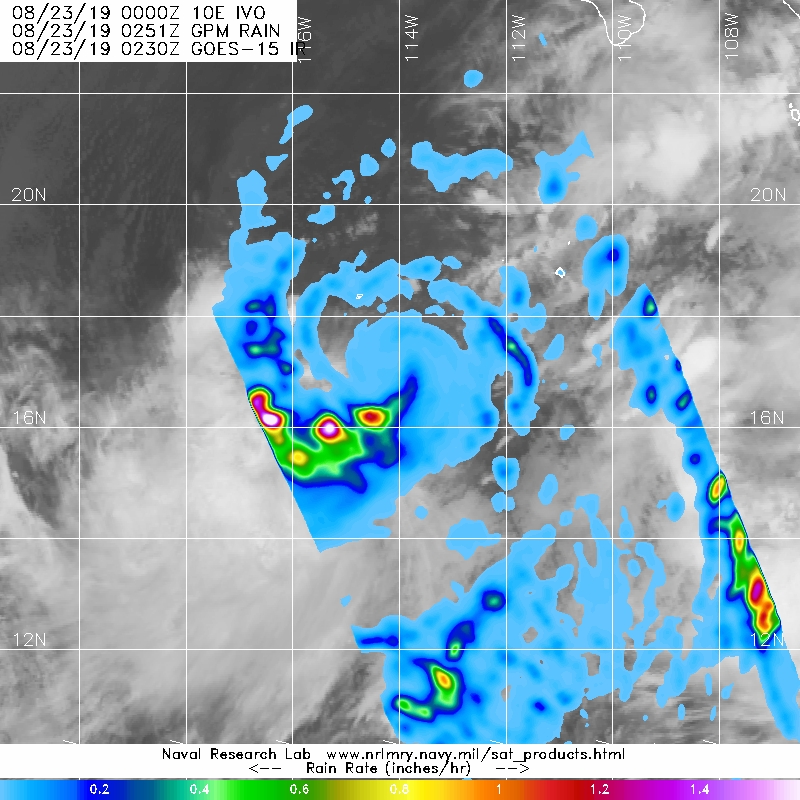
The GPM core satellite passed over Tropical Storm Ivo on Aug. 22 at 10:51 p.m. EDT (0251 UTC, Aug. 23). GPM found the heaviest rainfall (pink) around Ivo’s center of circulation falling at a rate of 25 mm (about 1 inch) per hour. Credit: NASA/JAXA/NRL

As Ivo was moving toward Mexico’s Clarion Island, the GPM satellite passed overhead and analyzed the rain rates throughout the storm on Aug. 22 at 10:51 p.m. EDT (0251 UTC, Aug. 23). GPM found the heaviest rainfall was occurring in a fragmented band of thunderstorms west of the center of circulation where it was falling at a rate of 40 mm (about 1.6 inch) per hour. GPM is a joint mission between NASA and the Japan Aerospace Exploration Agency, JAXA.

At 5 a.m. EDT (0900 UTC), the center of Tropical Storm Ivo was located near latitude 17.9 degrees n and longitude 114.5 degrees west. That puts the center about 455 miles (735 km) southwest of the southernmost tip of Baja California, Mexico. The National Hurricane Center or NHC said that Ivo is moving toward the north-northwest near 10 mph (17 kph), and this general motion is expected to continue for the next 2 to 3 days.

Maximum sustained winds are near 60 mph (95 kph) with higher gusts. The estimated minimum central pressure is 996 millibars.

NHC noted, “Little change in intensity is expected today, but Ivo should begin to weaken on Saturday [August 24].”

For updated forecasts, visit: www.nhc.noaa.gov.

Rob Gutro
NASA’s Goddard Space Flight Center, Greenbelt, Md.

Ivo (was 10E) – Eastern Pacific

Aug. 22, 2019 – NASA Satellite Finds Tropical Storm Ivo’s Center

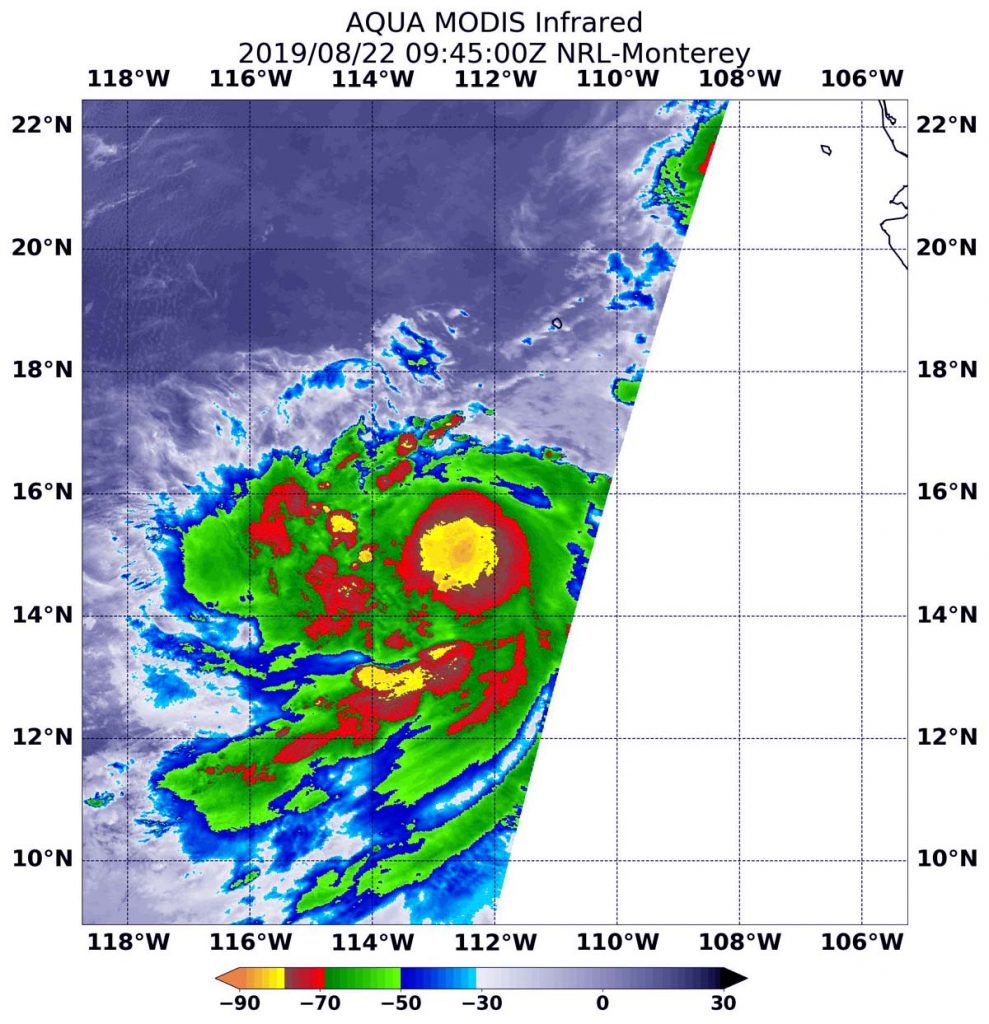
Infrared imagery from NASA’s Aqua satellite revealed the strongest thunderstorms within Tropical Storm Ivo were just north of the center of the storm’s circulation. Tropical Depression 10E strengthened into Tropical Storm Ivo by 5 p.m. EDT on August 21.

Aqua image of Ivo
On August 22 at 5:45 a.m. EDT (0945 UTC), the MODIS instrument that flies aboard NASA’s Aqua satellite showed strongest storms in Tropical Storm Ivo were just north of the center of circulation. Cloud top temperatures in the strong area were as cold as minus 80 degrees Fahrenheit (minus 62.2 Celsius). Credit: NASA/NRL

NASA’s Aqua satellite used infrared light to analyze the strength of storms. Infrared data provides temperature information, and the strongest thunderstorms that reach high into the atmosphere have the coldest cloud top temperatures. On August 22 at 5:45 a.m. EDT (0945 UTC), the Moderate Imaging Spectroradiometer or MODIS instrument that flies aboard NASA’s Aqua satellite found those strongest storms just north of the center of circulation and in a fragmented band, extending south of the center. Those areas had cloud top temperatures as cold as minus 80 degrees Fahrenheit (minus 62.2 Celsius). NASA research has shown storms with cloud top temperatures that cold indicate strong storms with the potential to generate heavy rainfall.

NOAA’s National Hurricane Center or NHC noted, “The cyclone continues to gradually improve in organization. Microwave data show that there is a small eye trying to form beneath Ivo’s small central dense overcast, and satellite intensity estimates are rising.”

At 11 a.m. EDT (1500 UTC), the center of Tropical Storm Ivo was located near latitude 15.7 degrees north and longitude 113.6 degrees west. That is about 55 miles (890 km) south-southwest of the southern tip of Baja California, Mexico. Ivo is moving toward the west near 12 mph (19 kph), and a turn to the northwest is expected by tomorrow. Ivo is anticipated to move generally north-northwestward this weekend. Maximum sustained winds have increased to near 65 mph (100 kph) with higher gusts.  The estimated minimum central pressure is 996 millibars.

NHC noted, “Further strengthening is anticipated in the short term since Ivo has a developing inner core and is over very warm waters with moderate wind shear.” Ivo could become a hurricane later tonight or tomorrow, but should begin to weaken on Saturday, August 24.

For updated forecasts, visit: https://www.nhc.noaa.gov

By Rob Gutro
NASA’s Goddard Space Flight Center

10E (Eastern Pacific Ocean)

Aug. 21, 2019 – Satellite Sees Eastern Pacific Depression 10E Form

Tropical Depression 10E has formed in the Eastern Pacific Ocean and the GOES-West satellite caught its formation far from the Baja Peninsula.

GOES image of 10E
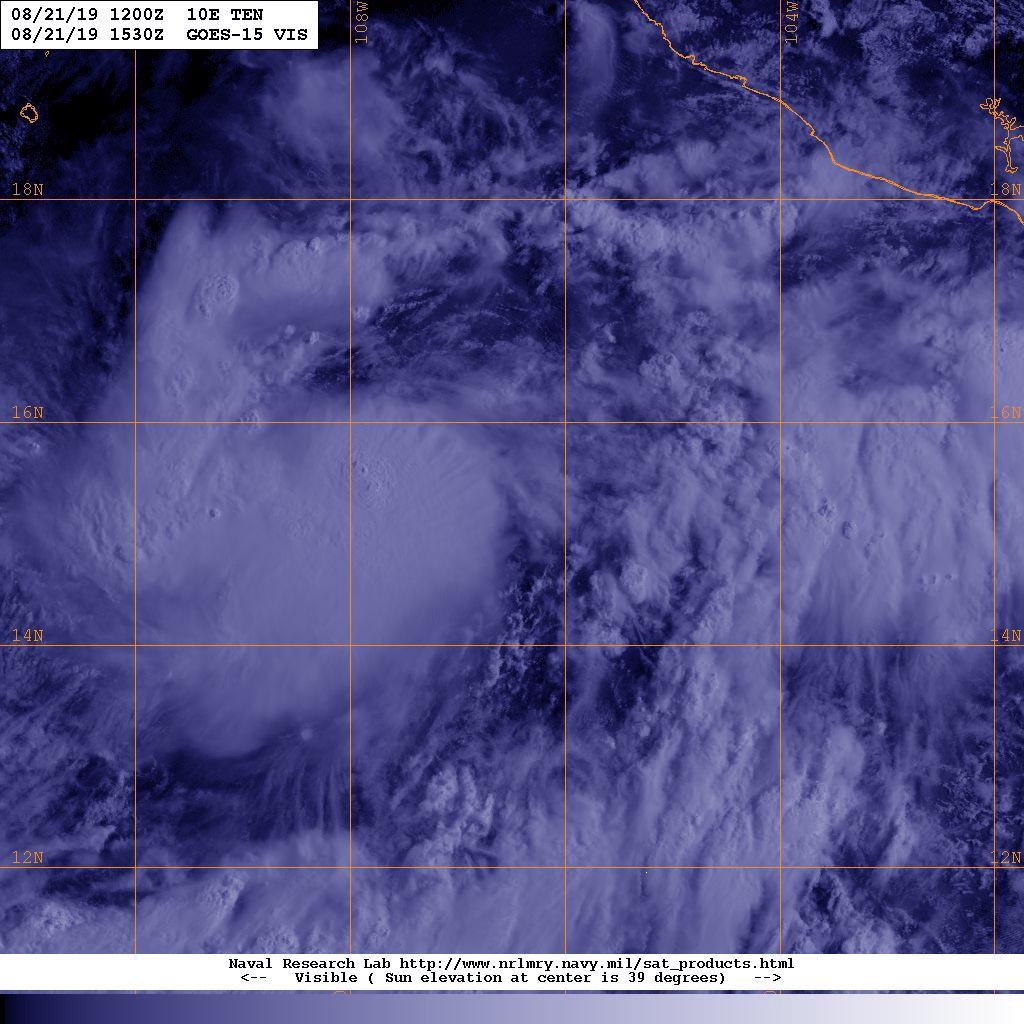
NOAA’s GOES-West satellite provided a visible image of the newly developed depression on August 21, 2019 at 11:30 a.m. EDT (1530 UTC). The system appears more organized and circular on satellite imagery. Credit: NOAA/NRL

NOAA’s GOES-West satellite provided a visible image of the newly developed depression on August 21, 2019. The system appears more organized and circular on satellite imagery. In addition, An early morning scatterometer instrument overpass that looks at winds in a system, showed a nearly closed surface low pressure area.

At 11 a.m. EDT (1500 UTC), the center of Tropical Depression Ten-E was located near latitude 15.4 degrees north and longitude 107.3 degrees west.  That’s about 545 miles (875 km) south-southeast of the southern tip of Baja California, Mexico.

NOAA’s National Hurricane Center or NHC said the depression is moving toward the west-northwest near 18 mph (30 kph). A turn to the northwest along with a decrease in forward speed is expected by Thursday, Aug. 22. Maximum sustained winds are near 35 mph (55 kph) with higher gusts. The estimated minimum central pressure is 1007 millibars.

NHC said, “Steady strengthening is forecast for the next couple of days and the depression is expected to become a tropical storm by tonight, and a hurricane by Friday.”

For updated forecasts visit: www.nhc.noaa.gov

By Rob Gutro
NASA’s Goddard Space Flight Center