Michael 2018

Oct. 15, 2018 – Hurricane Michael’s Heavy Rainfall Measured by NASA

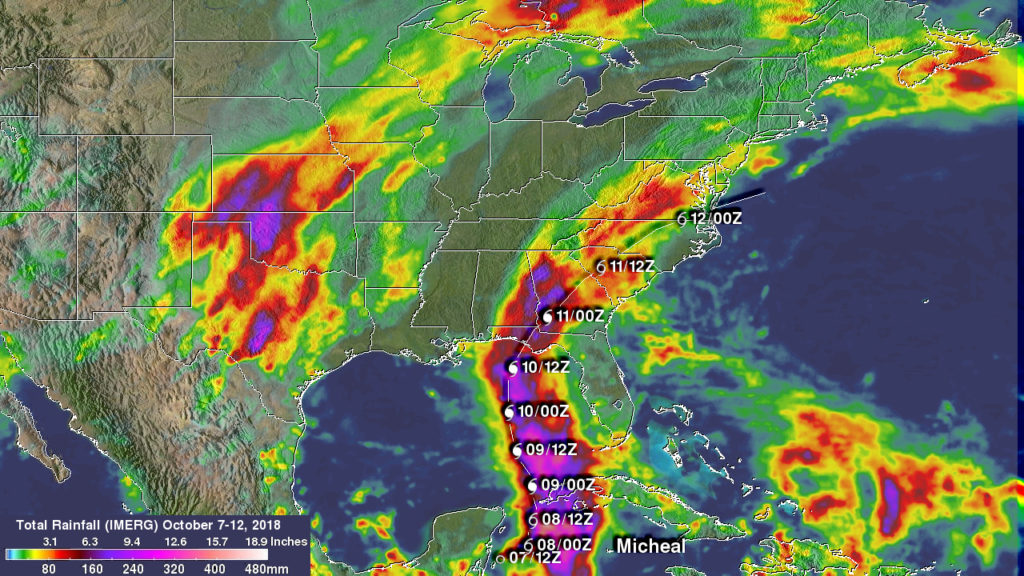
Some casualties resulted not only from Michael’s destructive winds and storm surges but also from the blinding rain that Michael produced as it battered states from Florida northeastward through Virginia. NASA used satellite data to estimate how much rainfall occurred along Hurricane Michael’s track from Oct. 7 to Oct. 12, 2018.
GPM image of Michael
Hurricane Michael frequently produced rainfall totals greater than 10 inches (254 mm) along its track. IMERG data indicated that the heaviest rainfall accumulation occurred off the Yucatan where were over 20 inches (512 mm) were estimated. Michael’s approximate 0000Z and 1200Z (8 p.m. EDT and 8 a.m. EDT) locations are shown overlaid on this analysis. Credit: NASA/JAXA, Hal Pierce

On Friday, Oct. 12, Tropical Storm Michael moved out over the Atlantic Ocean and has transitioned into a powerful extratropical storm.

A rainfall accumulation analysis created at NASA’s Goddard Space Flight Center in Greenbelt, Md. was derived from NASA’s Integrated Multi-satellitE Retrievals data (IMERG). IMERG data were used to calculate estimates of precipitation totals from a combination of space-borne passive microwave sensors, including the GMI microwave sensor on the GPM or Global Precipitation Measurement mission satellite, and geostationary infrared data. IMERG data benefits from algorithms developed by NASA’s Precipitation Measurement Missions (PMM) science team that supports GPM’s Missions. GPM is a joint mission between NASA and the Japan Aerospace Exploration Agency, JAXA.

An analysis showed IMERG rainfall accumulation estimates along Michael’s track during the period from becoming a tropical depression fourteen off the coast of the Yucatan Peninsula on Oct. 7 until it passed off the U.S. East Coast on Oct. 12. IMERG rainfall accumulation data indicated that Michael frequently produced rainfall totals greater than 10 inches (254 mm) along its track. IMERG data indicated that the heaviest rainfall accumulation occurred off the Yucatan where were over 20 inches (512 mm) were estimated.

Also of interest is the heavy rainfall that fell in less than a week with stormy weather extending from Texas to the Great Lakes.

By Harold F. Pierce
NASA Goddard Space Flight Center

Luban (Northern Indian Ocean) 2018

Oct. 15, 2018 – NASA Finds Remnants of Tropical Cyclone Luban Near Yemen/Oman Border

Tropical Cyclone Luban made landfall in northern Yemen and imagery from NASA-NOAA’s Suomi NPP satellite confirmed that the low pressure area has continued to linger near the border of Yemen and Oman.

Suomi NPP image of Luban
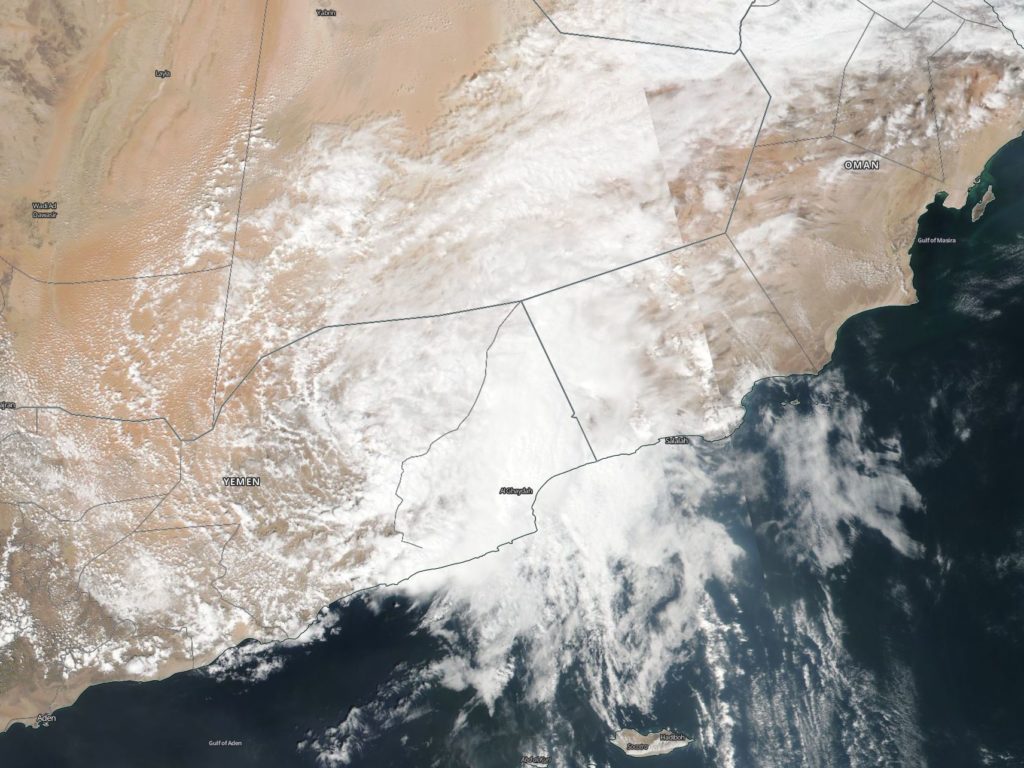
On Oct. 15, NASA-NOAA’s Suomi NPP satellite passed over the Northern Indian Ocean and captured a visible image of the remnants of Tropical Cyclone Luban along the coast of Yemen and Oman. Credit: NASA Worldview, Earth Observing System Data and Information System (EOSDIS)/NOAA

On Oct. 14, Tropical Cyclone Luban made landfall in Yemen near the border with Oman. The storm made landfall between Mukalla and Al Ghaidahnear bringing heavy rainfall and causing flooding and power outages in the eastern city of Ghaida. According to the Oman Observer, the Salalah Airport reported 11mm rainfall while other areas reported much more. Sadah received 70.8 mm of rain and Dalkhout received 89.0 mm.

On Oct. 15, NASA-NOAA’s Suomi NPP satellite passed over the Northern Indian Ocean and the Visible Infrared Imaging Radiometer Suite (VIIRS) instrument provided a visible image the remnant clouds associated with former Tropical Cyclone Luban. Luban’s clouds lingered along the border or Yemen and Oman and into the Northern Indian Ocean.

The meteorological office in Yemen reported that seas would continue to be rough on Oct. 15.

By Rob Gutro
NASA’s Goddard Space Flight Center

Leslie (Eastern Atlantic Ocean) 2018

Oct. 15, 2018 – NASA Sees Remnants of Post-Tropical Cyclone Leslie Over Spain

Post-tropical cyclone Leslie made landfall in Portugal bringing heavy rains and hurricane-force winds. On Oct. 14, NASA-NOAA’s Suomi NPP satellite spotted the remnant clouds over northern Spain.

Suomi NPP image of Leslie
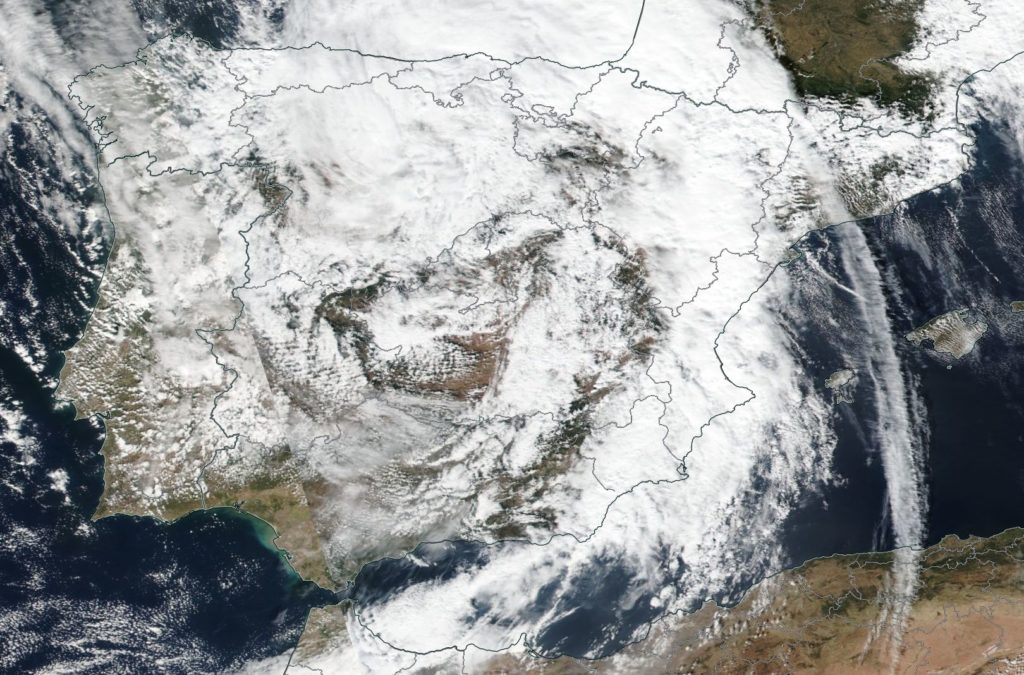
NASA-NOAA’s Suomi NPP satellite passed over Post-tropical Cyclone Leslie on Oct. 13 and the VIIRS instrument provided a visible image of the storm. The VIIRS image showed a disorganized low pressure area over the Iberian Peninsula, covering Portugal and Spain. Credit: NASA

Post-tropical cyclone Leslie made landfall at night on Oct. 13, local time. Leslie’s winds left 300,000 without power in Portugal and brought heavy rain. Lisbon, Leiria and Coimbra received the strongest winds.

Suomi NPP passed over Leslie on Oct. 13 and the Visible Infrared Imaging Radiometer Suite (VIIRS) instrument provided a visible image of the storm. The VIIRS image showed a disorganized low pressure area over the Iberian Peninsula, covering Portugal and Spain.

On Oct. 15, the remnants were bringing downpours to southern Spain and western Italy down to Sicily. The remnants continue to move east through the Mediterranean Sea.

By Rob Gutro
NASA’s Goddard Space Flight Center

Luban (Northern Indian Ocean) 2018

Oct. 12, 2018 – NASA Sees Tropical Cyclone Luban Nearing Oman

Tropical Cyclone Luban continued to track toward Oman as NASA-NOAA’s Suomi NPP satellite passed over the Northern Indian Ocean.

Suomi NPP image of Luban
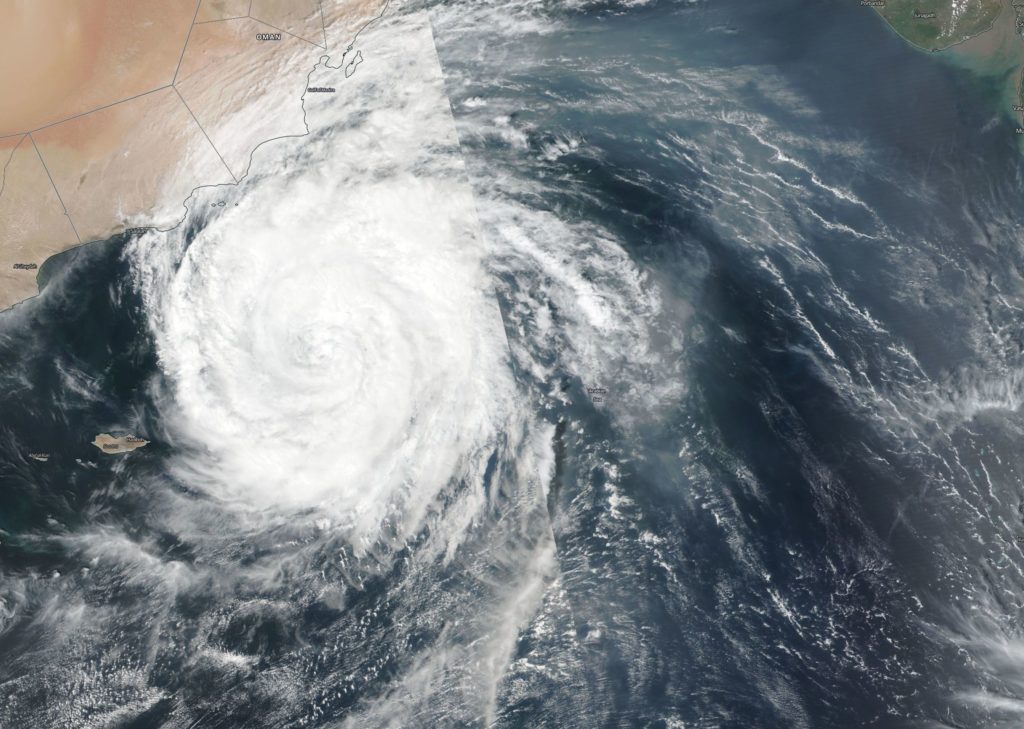
NASA-NOAA’s Suomi NPP satellite passed over the Northern Indian Ocean and captured a visible image of Tropical Cyclone Luban nearing Oman’s coast on Oct. 11. Credit: NASA Worldview, Earth Observing System Data and Information System (EOSDIS)/NOAA

Suomi NPP passed over Luban on Oct. 11 and the Visible Infrared Imaging Radiometer Suite (VIIRS) instrument provided a visible image of the storm. The VIIRS image showed Luban stretched from the Gulf of Marisa south to Socotra Island. Luban had a symmetrical shape with a cloud-filled eye, surrounded by powerful thunderstorms.

At 11 a.m. EDT (1500 UTC), the center of Tropical Cyclone Luban was located near latitude 14.6 degrees north and longitude 56.8 degrees east. Luban was moving toward the west. Maximum sustained winds are near 52 mph (45 knots/83 kph) with higher gusts.

Luban is forecast to move north of Socotra Island and make landfall in Oman between Lukalla and Salalah on Oct. 14.

By Rob Gutro 
NASA’s Goddard Space Flight Center


Leslie (Eastern Atlantic Ocean) 2018

Oct. 12, 2018 – NASA Tracking Hurricane Leslie Toward Southern Spain, Portugal

NASA-NOAA’s Suomi NPP satellite passed over the Eastern Atlantic Ocean and captured a visible image of Hurricane Leslie as it continues to travel toward southern Spain and Portugal.

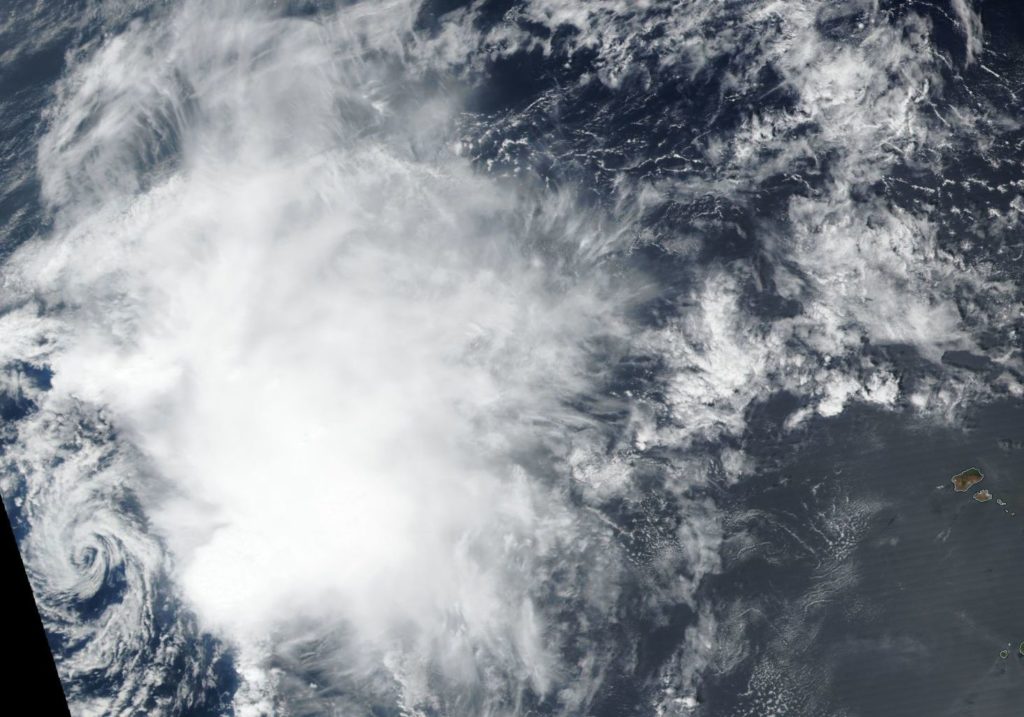
Suomi NPP image of Leslie
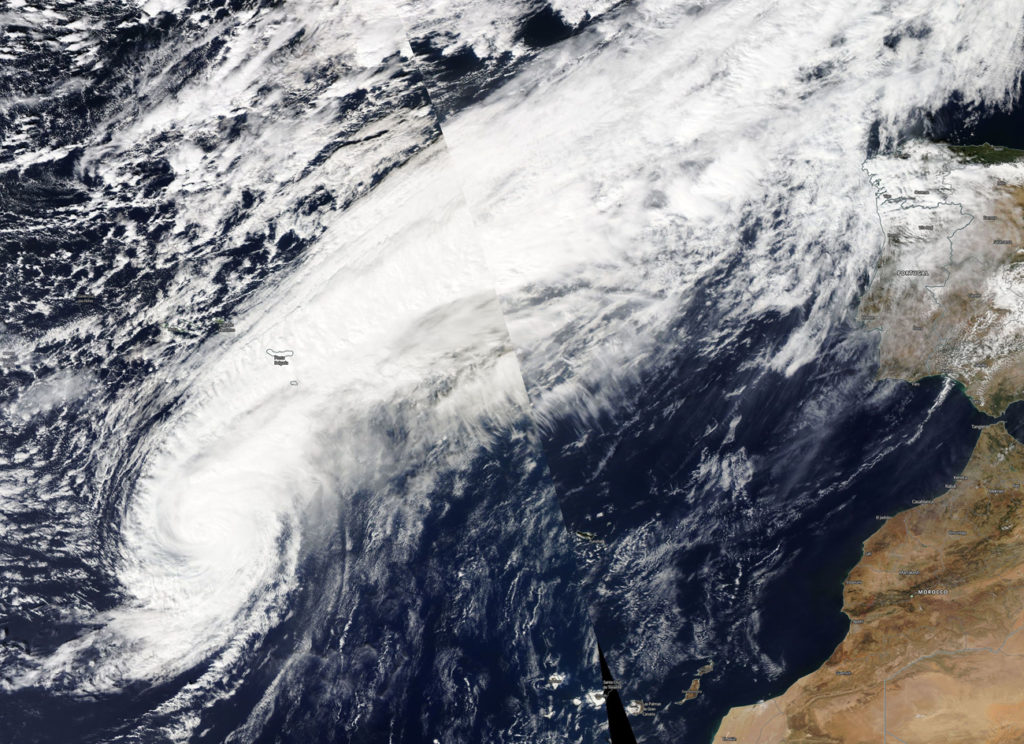
NASA-NOAA’s Suomi NPP satellite passed over the Eastern Atlantic Ocean and captured a visible image of Hurricane Leslie. Credit: NASA Worldview, Earth Observing System Data and Information System (EOSDIS)/NOAA

A Tropical Storm Warning is in effect for Madeira Island. Interests in Portugal and Spain should monitor the progress of Leslie. Leslie is expected to bring significant rain and wind impacts to portions of Portugal and Spain by Sunday

Suomi NPP passed over Leslie on Oct. 11 and the Visible Infrared Imaging Radiometer Suite (VIIRS) instrument provided a visible image of the storm. The VIIRS image showed Leslie’s cloud pattern continues to feature a central dense overcast, but with only hints of an eye in visible imagery. A large area of clouds extend northeast of Leslie’s center that are associated with an elongated area or trough of low pressure.

At 2p.m. EDT (1800 UTC), the center of Hurricane Leslie was located near latitude 33.3 degrees north and longitude 26.1 degrees west. Leslie is moving toward the east-northeast near 33 mph (54 km/h). A fast motion toward the east-northeastward is expected to continue through Saturday morning, followed by a slower eastward motion late Saturday through Monday.

Maximum sustained winds are near 85 mph (140 kph) with higher gusts. Some weakening is forecast during the next day or so, but Leslie is expected to transition into a powerful post-tropical cyclone by Saturday night, Oct. 13.

On the forecast track, the center of Leslie will pass north of Madeira Island on Saturday, and approach the southwestern portion of the Iberian Peninsula on Saturday night, and move inland over portions of the Iberian Peninsula on Sunday.

By Rob Gutro 
NASA’s Goddard Space Flight Center


Nadine (Eastern Atlantic Ocean) 2018

Oct. 12, 2018 – Satellite Finds Wind Shear Battering Tropical Storm Nadine

Tropical Storm Nadine continues to be battered by vertical wind shear, winds that can tear a tropical cyclone apart.  NASA-NOAA’s Suomi NPP satellite captured a visible image that showed the bulk of Nadine’s clouds were pushed northeast of the center.

Suomi NPP image of Nadine
NASA-NOAA’s Suomi NPP satellite passed over the Eastern Atlantic Ocean and captured a visible image of Tropical Storm Nadine. Nadine appeared devoid of rainfall except in the northeastern quadrant. Clouds around the center appeared as a wispy swirl. Credit: NASA Worldview, Earth Observing System Data and Information System (EOSDIS)/NOAA

Suomi NPP passed over Nadine on Oct. 11 and the Visible Infrared Imaging Radiometer Suite (VIIRS) instrument provided a visible image of the storm. The VIIRS image showed that Nadine appeared devoid of rainfall except in the northeastern quadrant. Southwesterly wind shear had pushed the bulk of clouds and showers east of its center. Clouds around the center appeared as a wispy swirl.

In general, wind shear is a measure of how the speed and direction of winds change with altitude. Tropical cyclones are like rotating cylinders of winds. Each level needs to be stacked on top each other vertically in order for the storm to maintain strength or intensify. Wind shear occurs when winds at different levels of the atmosphere push against the rotating cylinder of winds, weakening the rotation by pushing it apart at different levels.

At 11 a.m. EDT (1500 UTC), the center of Tropical Storm Nadine was located near latitude 16.0 degrees north and longitude 36.2 degrees west. Nadine is moving toward the west-northwest near 8 mph (13 kph). A west-northwestward to westward motion with an increase in forward speed is expected through the weekend. Maximum sustained winds have decreased to near 45 mph (75 kph) with higher gusts. Weakening is forecast during the next couple of days, and Nadine is expected to dissipate by Sunday.

By Rob Gutro 
NASA’s Goddard Space Flight Center

Michael 2018

Oct.  12, 2018 #2 – NASA Tracks Post-Tropical Cyclone Michael’s Heavy Rains to Northeastern U.S.

NASA satellite imagery showed that although Michael’s center was off-shore of the Delmarva Peninsula and over the western Atlantic Ocean, rain from its western quadrant was affecting the northeastern U.S.

Aqua image of Michael
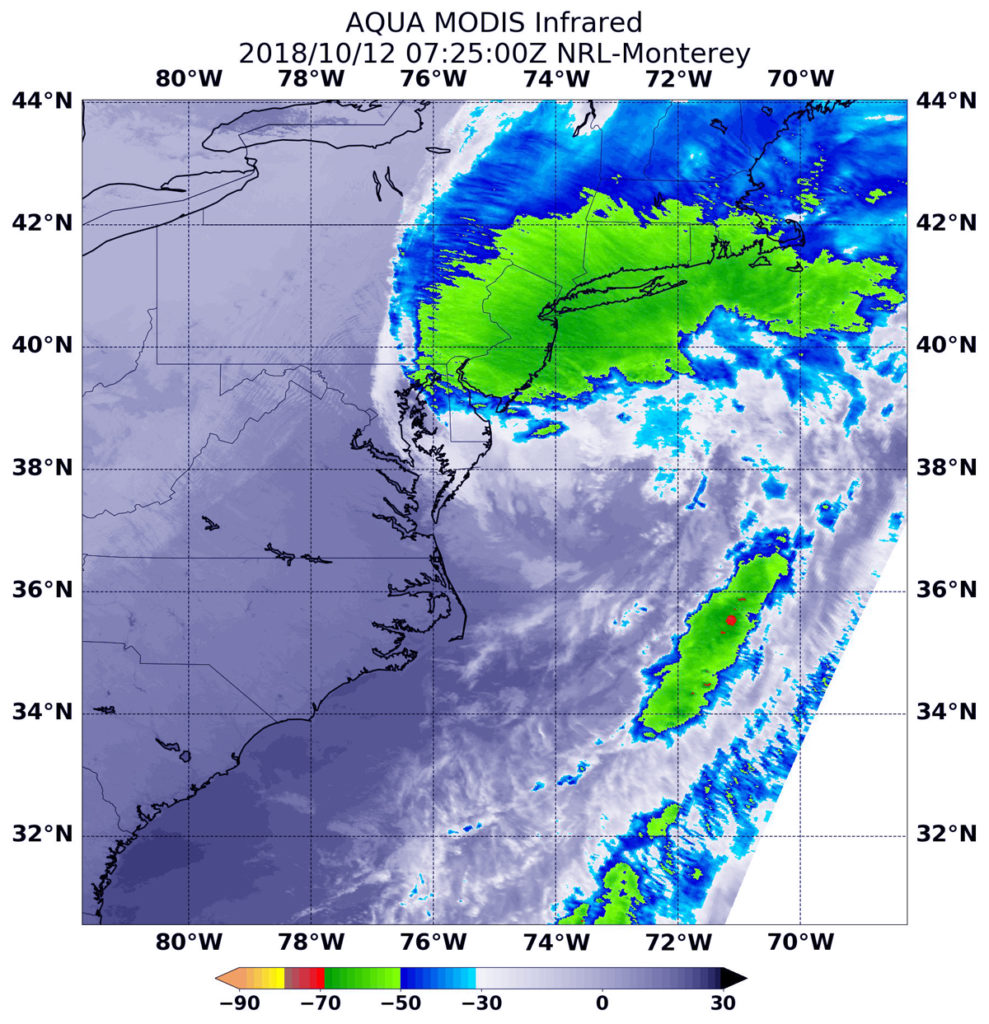
At 3:25 a.m. EDT (0725 UTC) on Oct. 12, the MODIS instrument that flies aboard NASA’s Aqua satellite gathered infrared data on Post-Tropical Cyclone Michael. Strongest thunderstorms appeared over eastern Pennsylvania, New Jersey, southeastern New York, Connecticut, Rhode Island and Massachusetts. In those areas, storms had cloud top temperatures as cold as minus 63 degrees Fahrenheit (minus 53 Celsius). Credit: NASA/NRL

At 3:25 a.m. EDT (0725 UTC) on Oct. 12, the MODIS instrument that flies aboard NASA’s Aqua satellite gathered infrared data on Post-Tropical Cyclone Michael. Infrared data provides temperature information. Strongest thunderstorms appeared over eastern Pennsylvania, New Jersey, southeastern New York, Connecticut, Rhode Island and Massachusetts. In those areas, storms had cloud top temperatures as cold as minus 63 degrees Fahrenheit (minus 53 Celsius). NASA research has shown that cloud tops with temperatures that cold were high in the troposphere and have the ability to generate heavy rain.

All coastal tropical cyclone warnings and watches are discontinued. There are no coastal watches or warnings in effect.

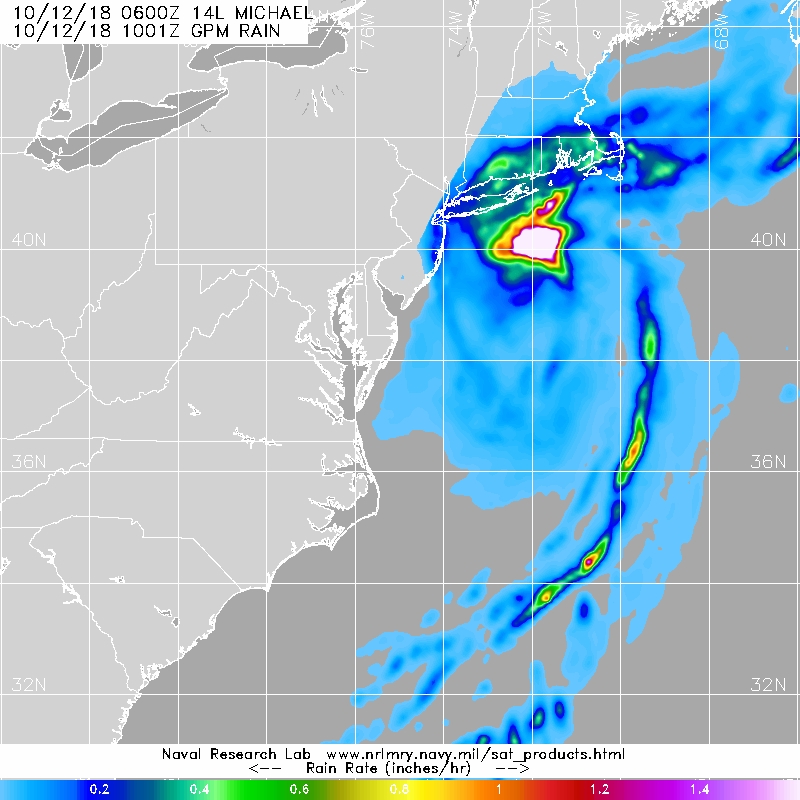
The Global Precipitation Measurement mission or GPM core satellite provided an analysis of the rate in which rain is falling throughout Post-Tropical Cyclone Michael. The GPM core satellite measured rainfall within Post-Tropical Storm Michael on Oct. 12. GPM found the heaviest rainfall was north of Michael’s center, falling at a rate of over 1.6 inches (40 mm) per hour south of Long Island, New York.

GPM image of Michael
The GPM core satellite measured rainfall within Post-Tropical Storm Michael on Oct. 12. GPM found the heaviest rainfall was north of Michael’s center, falling at a rate of over 1.6 inches (40 mm) per hour (pink) just south of Long Island, New York. Credit: NASA/JAXA/NRL

The National Hurricane Center or NHC noted at 5 a.m. EDT (0900 UTC), the center of Post-Tropical Cyclone Michael was located near latitude 38.0 degrees north and longitude 73.1 degrees west. Michael’s center was about 185 miles (300 km) east-northeast of Norfolk, Virginia. The post-tropical cyclone is moving toward the east-northeast near 29 mph (46 kph), and this motion is expected to continue with an increase in forward speed during the next couple of days.  On the forecast track, the center of Michael will move away from the United States today and move rapidly across the open Atlantic Ocean tonight through Sunday. Maximum sustained winds have increased near 65 mph (100 kph) with higher gusts.  Some additional strengthening is expected today and tonight as the post-tropical cyclone moves across the Atlantic.

NHC expects Michael to cross the North Atlantic Ocean and head toward Europe over the next two days.

For updated forecasts on Michael visit: www.nhc.noaa.gov

By Rob Gutro
NASA’s Goddard Space Flight Center


Sergio (Eastern Pacific Ocean) 2018

Oct. 12, 2018 – NASA Sees Sergio’s Rains Sweep into the U.S. Southwest

NASA’s Aqua satellite captured an infrared image of Tropical Storm Sergio’s clouds and rainfall sweeping into the southwestern U.S.

Aqua image of Sergio
At 1:55 a.m. EDT (0555 UTC) on Oct. 3, the MODIS instrument that flies aboard NASA’s Aqua satellite gathered infrared data on Hurricane Leslie. Strongest thunderstorms circled the center and were in a thick band northeast of center where cloud top temperatures were as cold as minus 63 degrees Fahrenheit (minus 53 Celsius). Credit: NASA/NRL

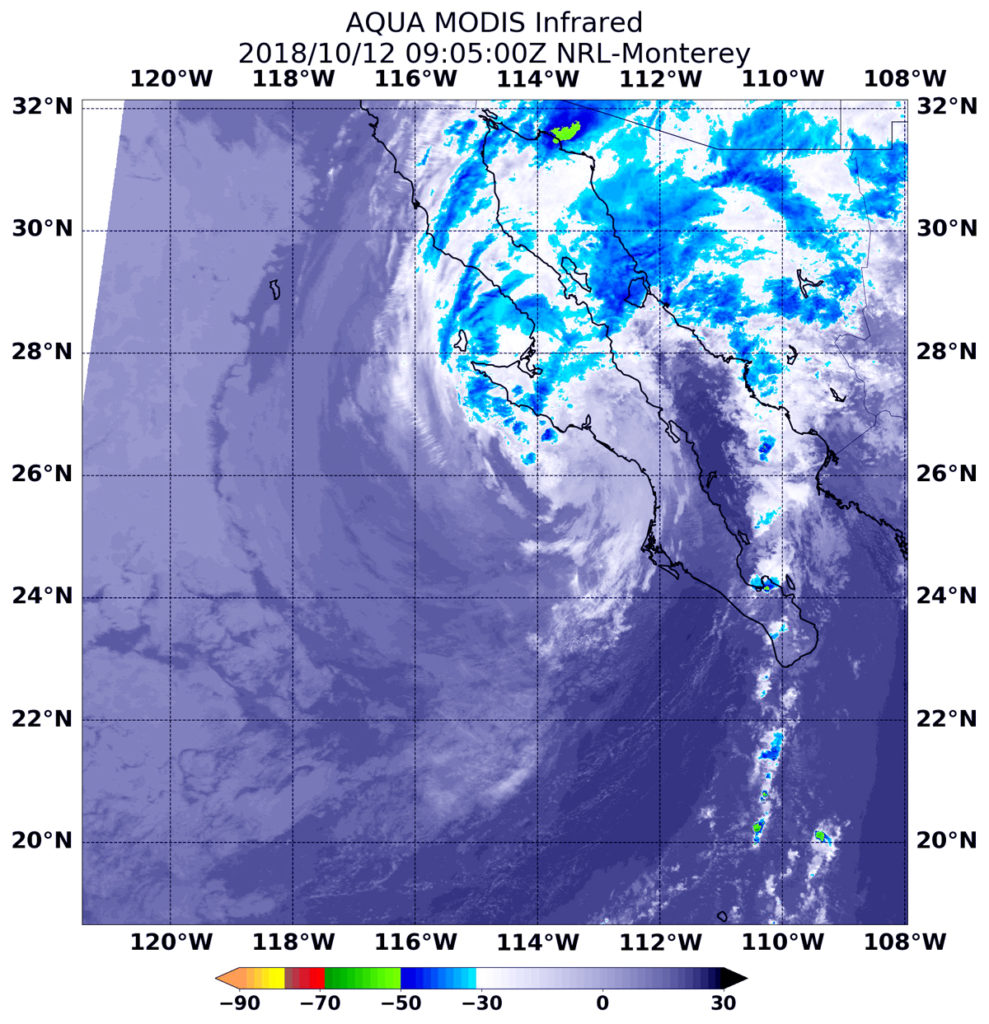
At 5:05 a.m. EDT (0905 UTC) on Oct. 3 the MODIS instrument that flies aboard NASA’s Aqua satellite gathered infrared data on Sergio. Although the center of circulation was over Baja California, Mexico, clouds and showers in the northeastern quadrant extended into southern Arizona.

Infrared data provides temperature information. MODIS found strongest storms with coldest cloud top temperatures as cold as minus 63 degrees Fahrenheit (minus 53 Celsius) in a small area in northwestern Mexico. NASA research has shown that cloud tops with temperatures that cold were high in the troposphere and have the ability to generate heavy rain.  A large area of storms with cloud top temperatures near minus 50 degrees Fahrenheit blanketed most of Baja California, northwestern mainland Mexico and stretched into southern Arizona.

Soon after Aqua passed overhead, Sergio entered the Sea of Cortez, located between Baja California and mainland Mexico.

At 11 a.m. EDT on Oct. 12, a Tropical Storm Warning is in effect for the west coast of the Baja California peninsula from Punta Eugenia to Cabo San Lazaro and for the east coast of the Baja California peninsula from Mulege to Bahia San Juan Bautista.

The National Hurricane Center or NHC noted the center of Tropical Storm Sergio was located near latitude 27.5 North, longitude 111.9 West. Sergio is moving toward the northeast near 24 mph (39 kph), and this general motion is expected to continue during the next day or so.  On the forecast track, the center of Sergio will move across the Sea of Cortez during the next several hours and then move over northwestern Mexico later today or tonight. Maximum sustained winds are near 40 mph (65 kph) with higher gusts.

Sergio should weaken to a tropical depression later today, and degenerate into a remnant low while moving over northwestern Mexico. Dissipation should occur on Saturday.

Despite dissipation as a tropical cyclone, though, the NHC said “moisture from Sergio will affect the United States, with total rain accumulations of 1 to 3 inches from southeast Arizona and southern New Mexico toward the southern Plains through Saturday. This rainfall could cause life-threatening flash flooding.”

For updated forecasts, visit: www.nhc.noaa.gov

By Rob Gutro
NASA’s Goddard Space Flight Center


Michael 2018

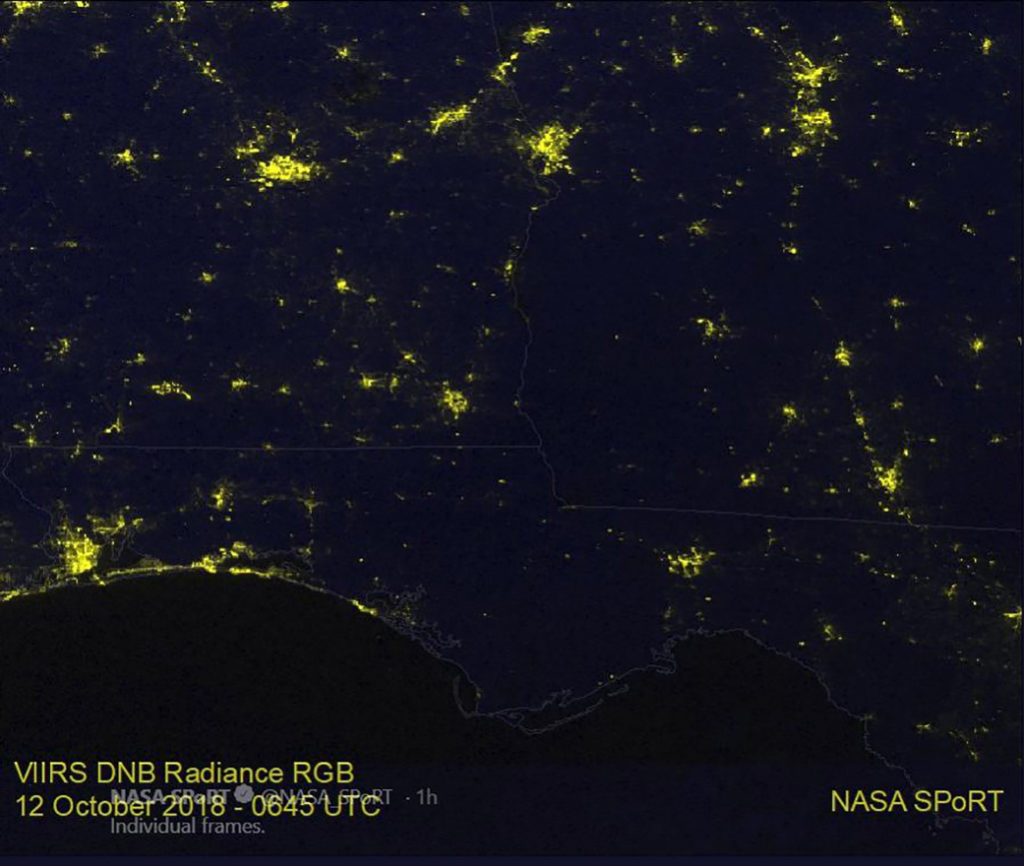
Oct. 12, 2018 #1 – Hurricane Michael’s Path of Power Outages Seen by Satellite
An area of the U.S. shows a swath of darkness after Hurricane Michael made landfall.

To view the slider of the before and after images, click this link: https://www.nasa.gov/feature/goddard/2018/hurricane-michaels-path-of-power-outages-seen-by-satellite

On Oct. 12 at 2:45 a.m. EDT (0645 UTC) the VIIRS instrument aboard NOAA’s NOAA-20 satellite captured a view of the change in night-time lights in the area of the Florida Panhandle and Georgia where Hurricane Michael traveled, knocking out power. The right image taken after Michael made land (taken on October 12) is compared to an image taken Oct. 6 at 2:58 a.m. EDT (0658 UTC) to show the difference.
For more information:  https://weather.msfc.nasa.gov/sport

Credit: NOAA/NASA MSFC, SPoRT