Savannah (Southern Indian Ocean)

Mar. 19, 2019 – NASA’s Terra Satellite Finds Wind Shear Weakening Savannah

NASA’s Terra satellite passed over the Southern Indian Ocean captured an image of Tropical Cyclone Savannah that showed wind shear was taking a toll on the storm.
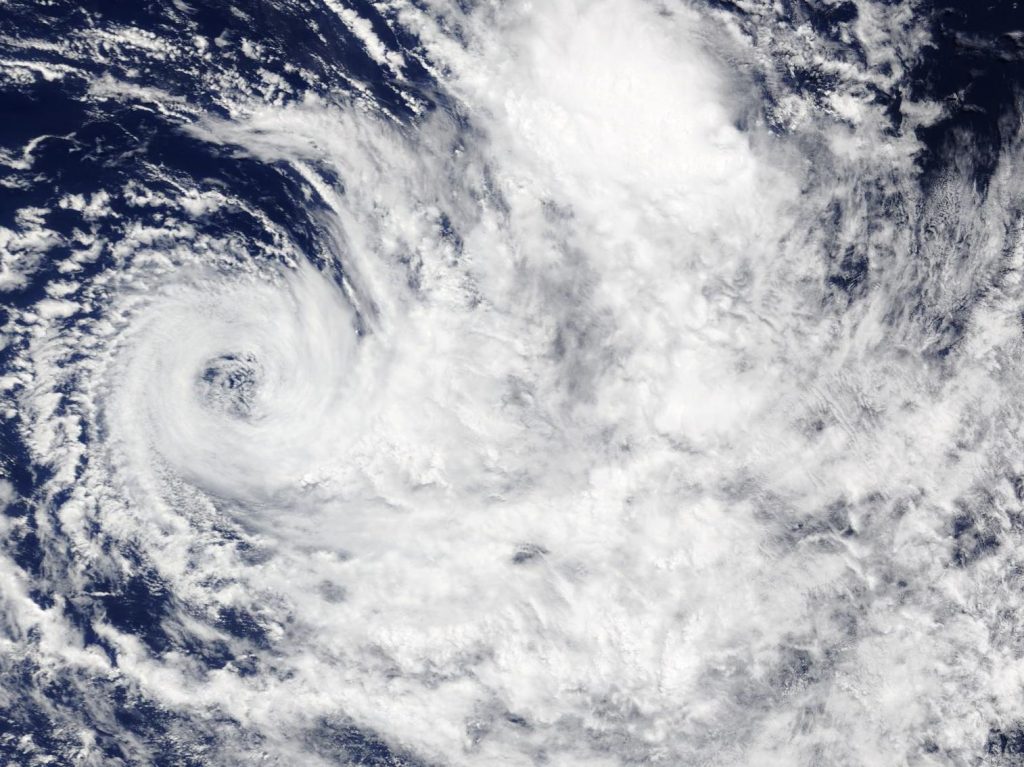
Terra image of Savannah
On March 19, NASA’s Terra satellite captured a visible image of Tropical Cyclone Savannah being affected by wind shear in the Southern Indian Ocean.
Credit: NASA Worldview, Earth Observing System Data and Information System (EOSDIS)

On March 19 the Moderate Resolution Imaging Spectroradiometer or MODIS instrument aboard NASA’s Terra satellite provided a visible image of Tropical Cyclone Savannah. Satellite imagery showed a ring of thunderstorms around the center of circulation, but the bulk of clouds had been pushed to the east and south of the center. Savannah was being affected by northwesterly vertical wind shear.

In general, wind shear is a measure of how the speed and direction of winds change with altitude. Wind shear can tear a tropical cyclone apart or weaken it. Moderate winds from the northwest are pushing against Savannah and blowing the bulk of clouds to the southeast of the center.

At 5 a.m. EDT (0900 UTC) the center of Savannah was located near latitude 18.2 degrees south and longitude 87.5 degrees east. That’s about 1,019 nautical miles southeast of Diego Garcia. Savannah was moving to the west. Maximum sustained winds were near 40 knots (46 mph/74 kph).

The Joint Typhoon Warning Center forecast calls for Savannah to continue weakening. Savannah is expected to maintain its west southwesterly trajectory until dissipation, over the next two days.

By Rob Gutro
NASA’s Goddard Space Flight Center

Trevor (Southwestern Pacific Ocean)

Mar. 19, 2019 – NASA Tracks Tropical Cyclone Trevor Approaching Australia’s Cape York Peninsula

Tropical Cyclone Trevor appeared to have a cloud-filled eye in visible imagery from NASA-NOAA’s Suomi NPP satellite.

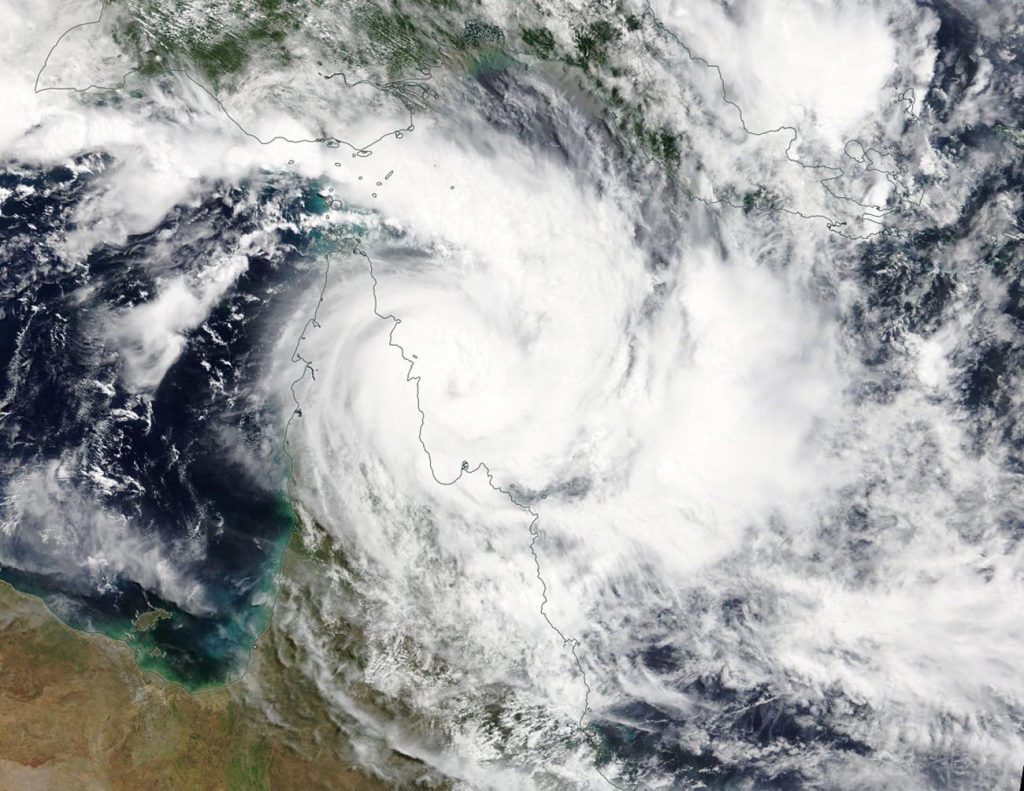
Terra image of Trevor
On March 19 the VIIRS instrument aboard NASA-NOAA’s Suomi NPP satellite captured a visible image of Tropical Cyclone Trevor in the Southern Pacific Ocean as it was approaching the Cape York Peninsula of Queensland, Australia. Credit: NASA Worldview, Earth Observing System Data and Information System (EOSDIS)

On March 19, 2019 the Visible Infrared Imaging Radiometer Suite (VIIRS) instrument aboard NASA-NOAA’s Suomi NPP satellite captured visible image of Tropical Cyclone Trevor as it continued moving west through the Coral Sea, Southern Pacific Ocean, and toward a landfall in Queensland, Australia’s Cape York Peninsula. VIIRS imagery showed powerful thunderstorms wrapping into the low-level center. At the time of the image, Trevor’s western quadrant was already over the Peninsula, and the eye appeared covered by high clouds.

After the Suomi NPP image, Trevor crossed the coast in the evening (local time) and remains slow moving just south of Lockhart River.

On March 18 (EDT), the Australian Bureau of Meteorology or ABM posted a warning from Orford Ness to Cape Melville, including Lockhart River and Coen, and Pormpuraaw to Cape York, including Weipa and Aurukun.

At 8:51 a.m. EDT (10:51 p.m. AEST local time, Australia), the ABM noted that maximum sustained winds near the center were 130 kilometers per hour (80 mph). Trevor’s center was located near 12.9 degrees south and 143.3 degrees east, about 15 kilometers (8 miles) south of Lockhart River and 160 kilometers (9 miles) east southeast of Weipa. Trevor was moving to the west.

ABM said “The cyclone will weaken as it crosses the northern Peninsula tonight and Wednesday, but is expected to remain a category 1 cyclone until it enters the Gulf of Carpentaria later on Wednesday. It is expected to re-intensify rapidly once it enters the Gulf of Carpentaria and track towards the Northern Territory.”

For updated forecasts from ABM, visit: http://www.bom.gov.au/cyclone/index.shtml

By Rob Gutro
NASA’s Goddard Space Flight Center

03W (Northwestern Pacific Ocean)

Mar. 18, 2019 – NASA-NOAA Satellite Catches Last Burst of Energy in Tropical Depression 03W

Tropical Depression 03W has dissipated in the Northwestern Pacific Ocean, but not without one last show of strength on infrared satellite imagery.

Suomi NPP image of 03W
On March 18 at 1:30 a.m. EDT (0530 UTC), the VIIRS instrument aboard NASA-NOAA’s Suomi NPP satellite looked at Tropical Depression 03W in infrared light. VIIRS found coldest cloud top temperatures off-center as cold as or colder than minus 80 degrees (yellow) Fahrenheit (minus 62.2 degrees Celsius). Credit: NASA/NRL

NASA-NOAA’s Suomi NPP satellite provided an infrared look at Tropical Depression 03W that revealed a burst of strong storms pushing high into the troposphere. 03W’s circulation center was also displaced from the bulk of clouds and precipitation. That’s an indication that vertical wind shear is affecting the storm.

What is Vertical Wind Shear?

In general, wind shear is a measure of how the speed and direction of winds change with altitude. In order to understand how it affects a tropical cyclone or hurricane, think of a tropical cyclone as a series of vertically stacked tires, all rotating. As you go up from the ground, each tire represents the rotation of the storm’s center at a higher level in the atmosphere. The different levels of rotating winds in the center of tropical cyclones need to be stacked on top each other to strengthen. If there are winds higher up that push some of the tires askew near the top, it affects the balance and rotation of the tires below. That’s what happens when vertical wind shear pushes against a storm. It pushes the center and weakens (or wobbles) the rotation of all of the tires.

The Satellite Data Reveal

On March 18 at 1:30 a.m. EDT (0530 UTC), the Visible Infrared Imaging Radiometer Suite (VIIRS) instrument aboard NASA-NOAA’s Suomi NPP satellite analyzed Tropical Storm Depression 03W off-center were as cold as or colder than minus 80 degrees Fahrenheit (minus 62.2 degrees Celsius). NASA research has found that cloud top temperatures as cold as or colder than the 70F/56.6C threshold have the capability to generate heavy rainfall.

The final warning for 03W was issued by the Joint Typhoon Warning Center or JTWC on March 18 at 0900 UTC (5 a.m. EDT). At that time, Tropical depression 03W, also known in the Philippines as Chedeng, was located near 6.6 degrees north latitude and 128.5 degrees east longitude. That’s about 170 nautical miles east of Davao, Philippines. Maximum sustained winds were down to 20 knots (23 mph/37 kph) in the remnant low pressure area.

The remnant low pressure area was moving to the west and are expected to move toward Mindanao, Philippines.

By Rob Gutro
NASA’s Goddard Space Flight Center

03W (Northwest Pacific Ocean)

Mar. 15, 2019 – NASA Sees Development of Tropical Depression 03W Near Yap

Visible imagery from NASA’s Terra satellite revealed 03W that formed near the island of Yap in the Northwestern Pacific Ocean.

Terra image of 03W
On March 15, the MODIS instrument aboard NASA’s Terra satellite provided a visible image of 03W in the Northwestern Pacific Ocean. The image showed an elongated storm. Credit: NASA Worldview, Earth Observing System Data and Information System (EOSDIS)

Yap State is one of the four states of the Federated States of Micronesia. The other three states include Kosrae State, Pohnpei State, and Chuuk State.

A tropical storm watch remains in effect for Yap and Ngulu in Yap State and Kayangel in the Republic of Palau.

On March 15, the Moderate Resolution Imaging Spectroradiometer or MODIS instrument aboard NASA’s Terra satellite provided a visible image of 03W in the Northwestern Pacific Ocean. The image showed an elongated storm.

At 2 p.m. EDT (1800 UTC) on March 15 (4 a.m. CHST on March 16 local time) the National Weather Service (NWS), Guam, noted that the center of Tropical Depression 03W was located near Latitude 7.9 degrees North and Longitude 140.9 degrees East. That’s about 130 miles south of Fais and about 220 miles east-southeast of Yap. 03W is moving west at 8 mph and is expected to maintain this general course and speed through the weekend, passing close to Koror on Sunday. Maximum sustained winds remain at 30 mph.

NWS noted “damaging winds are currently not expected at yap. However…the strongest winds are on the north side and 03w is expected to pass south of Yap…meaning that Yap will receive these strong winds as the center of 03w passes by. Small craft should return to port and any small loose objects should be brought indoors.”

03W is forecast to intensify slightly later today but keep below tropical storm force. 03W is forecast to weaken Sunday night, March 17. It is expected to dissipate near Mindanao, Philippines.

For updated forecasts from the National Weather Service, Guam, visit: https://www.weather.gov/gum/Cyclones

By Rob Gutro
NASA’s Goddard Space Flight Center

Savannah (Southern Indian Ocean)

Mar. 15, 2019 – Satellite Sees Tropical Cyclone Savannah Moving Away from Indonesia

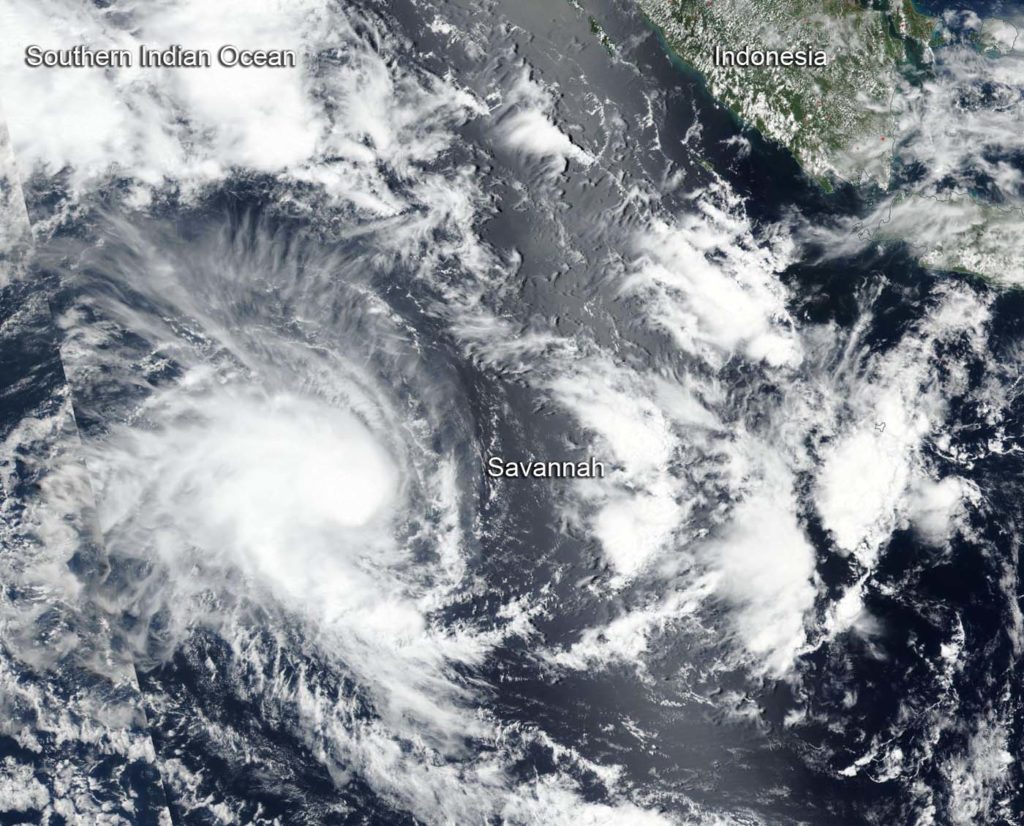
Tropical Cyclone Savannah continued to move in southerly direction in the Southern Indian Ocean, and move away from Indonesia. NASA-NOAA’s Suomi NPP satellite provided a visible image of the storm. Savannah is no threat to land areas.

Suomi NPP Image of Savannah
NASA-NOAA’s Suomi NPP satellite passed over the Southern Indian Ocean and captured a visible image of Tropical Cyclone Savannah on March 15, as it continued to move away from Indonesia. Credit: NASA Worldview, Earth Observing System Data and Information System (EOSDIS).

Savannah formed on March 14 as Tropical Cyclone 19S and once it strengthened into a tropical storm it was renamed.

Suomi NPP passed over Savannah on March 15 and the Visible Infrared Imaging Radiometer Suite (VIIRS) instrument provided a visible image of the storm. The VIIRS image showed a rounded area of storms around the low-level center of circulation with a band of thunderstorms feeding into the center, extending to the southeast. The Joint Typhoon Warning Center (JTWC) noted “animated enhanced infrared satellite imagery depicts a consolidating system with a central dense overcast feature persisting over the low-level circulation center.” A microwave image showed tightly-curved bands of thunderstorms wrapping around an eye feature, indicating the storm was strengthening.

Savannah is forecast to move towards the southwest over the coming days, continuing on its path away from Indonesia. At 11 a.m. EDT (1500 UTC), Savannah was near 14.4 degrees south longitude and 98.4 degrees east latitude, about 185 nautical miles southwest of Cocos Island. Maximum sustained winds were near 55 knots (63 mph/102 kph).

Forecasters at the Joint Typhoon Warning Center noted that Savannah will move southwest, later turning west-southwest, while intensifying to 80 knots after three days. The storm will then start to weaken.

By Rob Gutro 
NASA’s Goddard Space Flight Center

Idai (Southern Indian Ocean)

Mar. 15, 2019 – NASA Tracks Tropical Cyclone Idai Over Mozambique

Visible imagery from NASA’s Terra satellite showed Tropical Cyclone continued to move in a westerly direction after making landfall in Mozambique.

Terra image of Idai
On March 15 the MODIS instrument aboard NASA’s Terra satellite provided a visible image of Tropical Cyclone Idai after it made landfall in Mozambique. Credit: NASA Worldview, Earth Observing System Data and Information System (EOSDIS)

On March 15, the Moderate Resolution Imaging Spectroradiometer or MODIS instrument aboard NASA’s Terra satellite provided a visible image of Idai. The imagery showed the storm centered over central Mozambique and its western quadrant had already spread into Zimbabwe. Even over land, the system still showed a ragged eye on microwave satellite imagery.

At 0300 UTC on March 15 (11 p.m. EDT on March 14), the Joint Typhoon Warning Center or JTWC issued the final warning on Idai. At the time, Idai was over land and had maximum sustained winds near 90 knots (103.6 mph/166.7 kph). It was centered near 19.6 degrees north latitude and 34.8 degrees east longitude.

Idai is expected to affect parts of the Mozambique provinces of Zambézia, Sofala, Manica, Tete and Inhambane. Moderate to strong rains accompanied by severe thunderstorms and gusty winds are expected in the north of the provinces of Niassa, Cabo Delgado and northern Tete.

JTWC has forecast Idai to rapidly weaken as it tracks across central Mozambique and into northern Zimbabwe.

For the latest advisory from the Mozambique National Meteorology Institute (INAM), visit: http://www.inam.gov.mz/index.php/pt/novo-sistema

By Rob Gutro
NASA’s Goddard Space Flight Center

Idai (Southern Indian Ocean)

Mar. 14, 2019 – NASA Catches Tropical Cyclone Idai Making Landfall in Mozambique

Tropical Cyclone Idai was approaching landfall in Mozambique when NASA’s Aqua satellite provided an infrared look at the cloud top temperatures to determine the strongest parts of the storm.

Aqua image of Idai
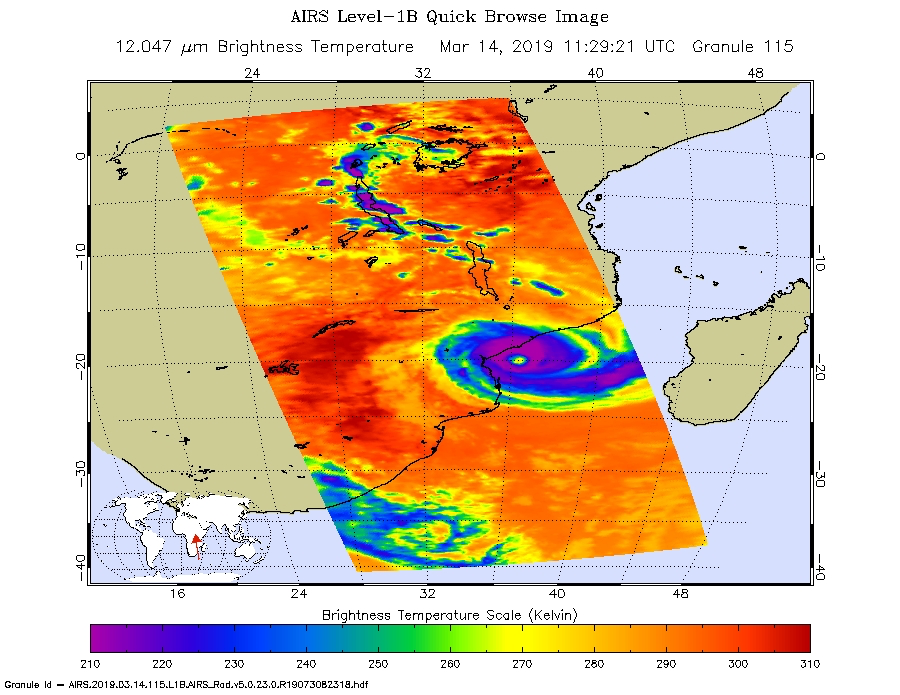
On the March 14, the AIRS instrument aboard NASA’s Aqua satellite analyzed cloud top temperatures of Tropical Cyclone Idai in infrared light. AIRS found cloud top temperatures of strongest thunderstorms were as cold as or colder than minus 63 degrees Fahrenheit (minus 53 degrees Celsius) around the eye. Credit: NASA JPL/Heidar Thrastarson

On March 14, warnings were in effect in Mozambique as Idai nears landfall. Idai will affect (parts of) the Mozambique provinces of Zambézia, Sofala, Manica and Inhambane with very strong winds (190 to 210 kilometers per hour), accompanied by very heavy rains (more than 150 mm in 24 hours) and severe thunderstorms. INAM also foresees the continuation of moderate to strong rains (30 to 50 mm / 24h), accompanied by severe thunderstorms and gusty winds north of the provinces of Niassa and Cabo Delgado.

On March 14 at 7:29 a.m. EDT (1129 UTC) the Atmospheric Infrared Sounder or AIRS instrument aboard NASA’s Aqua satellite analyzed cloud top temperatures of Tropical Cyclone Idai in infrared light. AIRS found cloud top temperatures were as cold as or colder than minus 63 degrees Fahrenheit (minus 53 degrees Celsius) circling the eye. Cloud top temperatures that cold indicate strong storms that have the capability to create heavy rain.

On March 14 at 11 a.m. EDT (1500 UTC), the center of Tropical Cyclone Idai was located near latitude 19.9 degrees south and longitude 36.3 degrees east. That puts the center of Idai about 258 nautical miles west-northwest of Europa Island. Idai’s western quadrant was already pummeling Mozambique. Maximum sustained winds were near 100 knots (115 mph/185 kph).  The Joint Typhoon Warning Center expects that Idai will maintain current intensity until landfall occurs near Beira, Mozambique within 24 hours.

For the latest advisory from the Mozambique National Meteorology Institute (INAM), visit: http://www.inam.gov.mz/index.php/pt/novo-sistema

By Rob Gutro
NASA’s Goddard Space Flight Center

Idai (Southern Indian Ocean)

Mar. 13, 2019 – NASA Infrared Imagery Reveals Powerful Tropical Cyclone Idai at Mozambique’s Coast

NASA’s Terra satellite captured an infrared image of Tropical Cyclone Idai approaching the coast of Mozambique. The infrared data provided cloud top temperatures that indicated powerful thunderstorms circled Idai’s center.

Terra image of Idai
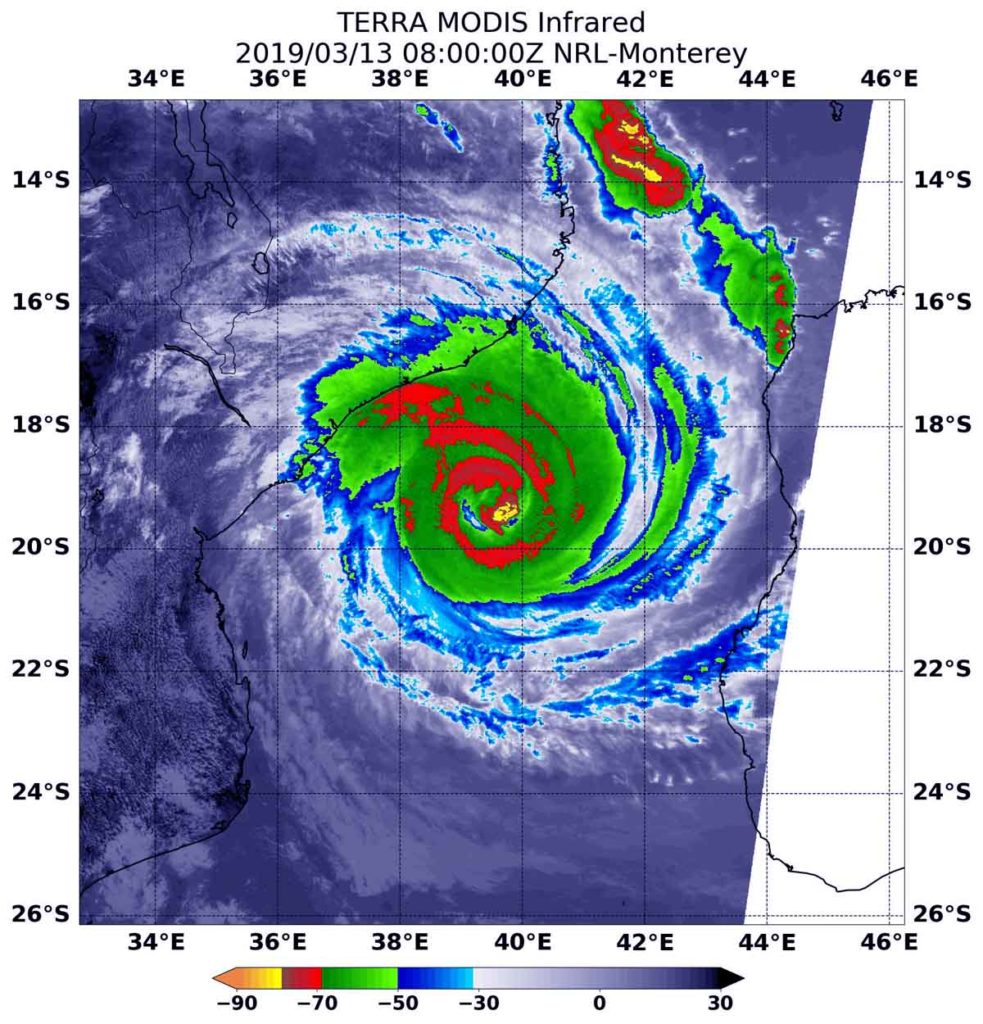
At 4 a.m. EDT (0800 UTC) on Oct. 3, the MODIS instrument that flies aboard NASA’s Terra satellite gathered infrared data on Tropical Cyclone Idai. Strongest thunderstorms circled the center where cloud top temperatures were as cold as minus 70 degrees Fahrenheit (minus 56.6 Celsius) and appeared in red. Credit: NASA/NRL

At 4 a.m. EDT (0800 UTC) on March 13 the Moderate Resolution Imaging Spectroradiometer or MODIS instrument that flies aboard NASA’s Terra satellite gathered infrared data on Idai. Infrared data provides temperature information. Strongest thunderstorms circled Idai’s center and contained cloud top temperatures as cold as minus 70 degrees Fahrenheit (minus 56.6 Celsius). NASA research has shown that cloud tops with temperatures that cold were high in the troposphere and have the ability to generate heavy rain.

MODIS infrared imagery also indicated Idai’s eye is about 20 nautical miles wide in diameter, although it was covered by high clouds.

At 11 a.m. EDT (1500 UTC), Idai’s center was located near latitude 19.5 degrees south and longitude 38.7 degrees east. That’s about 175 nautical miles north-northwest of Europa Island. Idai was moving to the west. Maximum sustained winds were near 103.6 mph (90 knots/166.7 kph) with higher gusts.

On March 13, the Mozambique National Meteorology Institute (INAM) noted that Idai is causing very heavy rains of more than 100 millimeters (4 inches) in 24 hours over the Mozambique Channel.

Idai is forecast to make landfall just north of Biera, Mozambique between March 14 at 1200 UTC and March 15 at 0000 UTC (on March 14 between 8 a.m. to 8 p.m. EDT). Beira is the fourth largest city in the country and is located in the Sofala Province, central region of the country. Heavy rains, thunderstorms and hurricane-force winds are expected as Idai comes ashore.

For the latest advisory from the Mozambique National Meteorology Institute (INAM), visit: http://www.inam.gov.mz/index.php/pt/novo-sistema

By Rob Gutro
NASA’s Goddard Space Flight Center

Idai (Southern Indian Ocean)

Mar. 12, 2019 – Tropical Cyclone Idai Seen in Mozambique Channel by NASA’s Terra Satellite

NASA’s Terra satellite passed over the Southern Indian Ocean and caught a visible image of Tropical Cyclone Idai in the Mozambique Channel. The channel is located between the country of Mozambique on the African mainland and the island nation of Madagascar.

Terra image of Idai
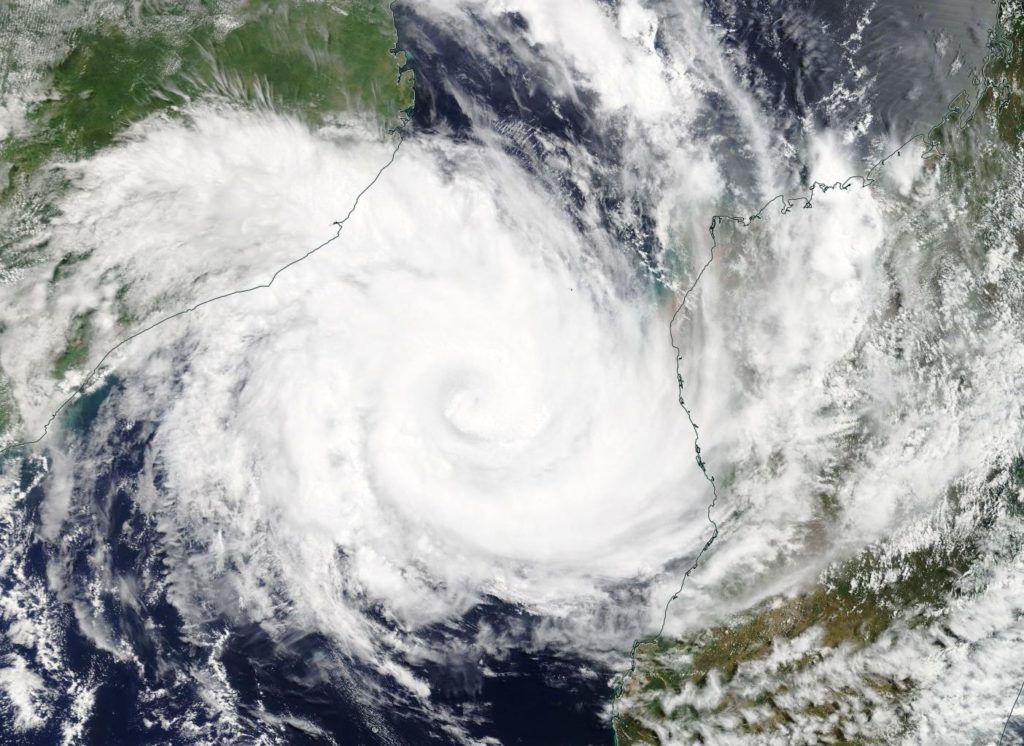
On March 12 NASA’s Terra satellite captured a visible image of Tropical Cyclone Idai in the Mozambique Channel of the Southern Indian Ocean. Idai was located between Mozambique (left) and Madagascar (right). Credit: NASA Worldview, Earth Observing System Data and Information System (EOSDIS)

On March 12 the Moderate Resolution Imaging Spectroradiometer or MODIS instrument aboard NASA’s Terra satellite provided a visible image of Tropical Cyclone Idai. Satellite imagery showed Idai maintained a well-defined eye, although still obscured by high clouds. Idai appeared to be almost directly between Mozambique and Madagascar. Both countries have advisories in effect on March 12.

At 5 a.m. EDT (0900 UTC) the center of Idai was located near latitude 17.7 degrees south and longitude 42.5 degrees east. That’s about 253 nautical miles north-northeast of Europa Island. Idai was moving to the southwest. Maximum sustained winds were near 90 knots (103.6 mph/166.7 kph).

The Joint Typhoon Warning Center forecast calls for Idai to re-intensify as it moves southwest, peaking at 100 knots (115 mph/185 kph) before making landfall near Beira, Mozambique after 3 days.

For advisories from the Mozambique National Meteorological Institute (in Portuguese), visit: http://www.inam.gov.mz/index.php/pt/novo-sistema

By Rob Gutro
NASA’s Goddard Space Flight Center

Idai (Southern Indian Ocean)

Mar. 11, 2019 – NASA’s Aqua Satellite Finds Tropical Cyclone Idai in Mozambique Channel

Visible imagery from NASA’s Aqua satellite revealed the center of Tropical Cyclone Idai in the Mozambique Channel.

Aqua image of Idai
On March 11, 2019, the MODIS instrument aboard NASA’s Aqua satellite captured a visible light image of Tropical Cyclone Idai in the Mozambique Channel, Southern Indian Ocean. Mozambique is located (left) on the African mainland and Madagascar (right) is the island nation. Credit: NASA Worldview, Earth Observing System Data and Information System (EOSDIS)

The Mozambique Channel is the body of water in the Southern Indian Ocean that flows between Mozambique on the African mainland and the island nation of Madagascar.

Tropical Cyclone Idai developed on March 9 around 4 a.m. EST (0900 UTC). It developed from the low pressure area designated System 98S. When it strengthened into a depression, it was renamed Tropical Cyclone 18S. After strengthening into a tropical storm on March 10, it was renamed Idai.

On March 11, 2019, the Moderate Resolution Imaging Spectroradiometer or MODIS instrument aboard NASA’s Aqua satellite captured a visible image of Tropical Cyclone Idai. Bands of powerful thunderstorms were wrapping around an eye obscured by high clouds. The eye appears to be about 17 nautical-miles wide. At the time of the image, west-central Mozambique was being affected by the eastern quadrant of this powerful storm.

On Monday, March 11, 2019 at 11 a.m. EDT (1500 UTC), Idai was located near 17.6 degrees south latitude and 42.6 degrees east longitude. That’s about 307 miles north-northeast of Europa Island. Idai was moving to the southwest and had maximum sustained winds 105 knots (121 mph/194.5 kph). It was generating maximum wave heights near 27 feet (8.2 meters).

The Joint Typhoon Warning Center expects Idai to intensify further as it moves west. Idai’s sustained winds are expected to peak at a Category 4 hurricane strength (on the Saffir-Simpson hurricane wind scale) with 125 knots (144 mph/231.5 kph) before making landfall near Beira, Mozambique after March 15.

By Rob Gutro
NASA’s Goddard Space Flight Center