Erin (was TD6) – Atlantic Ocean

Aug. 28, 2019 – NASA Finds Wind Shear Affecting Tropical Depression Erin

Visible and infrared imagery from NASA’s Terra satellite revealed that strong wind shear was adversely affecting Tropical Depression Erin, located about 200 miles off the Carolina coast.

Terra image of Erin
On Aug. 27, the MODIS instrument aboard NASA’s Terra satellite provided a visible image of Tropical Depression Erin that showed the storm was being affected by vertical wind shear. Credit: NASA Worldview, Earth Observing System Data and Information System (EOSDIS)

On Aug. 27, the Moderate Resolution Imaging Spectroradiometer or MODIS instrument aboard NASA’s Terra satellite provided a visible image of Tropical Depression Erin. In the image, Erin appeared as a swirl of clouds around its center with most of its clouds and thunderstorms pushed southeast of center. Strong northwesterly vertical wind shear was pushing at the storm.

Despite fighting wind shear on Aug. 27, Tropical Depression 6 strengthened into a tropical storm by 11 p.m. EDT, and was renamed Erin.

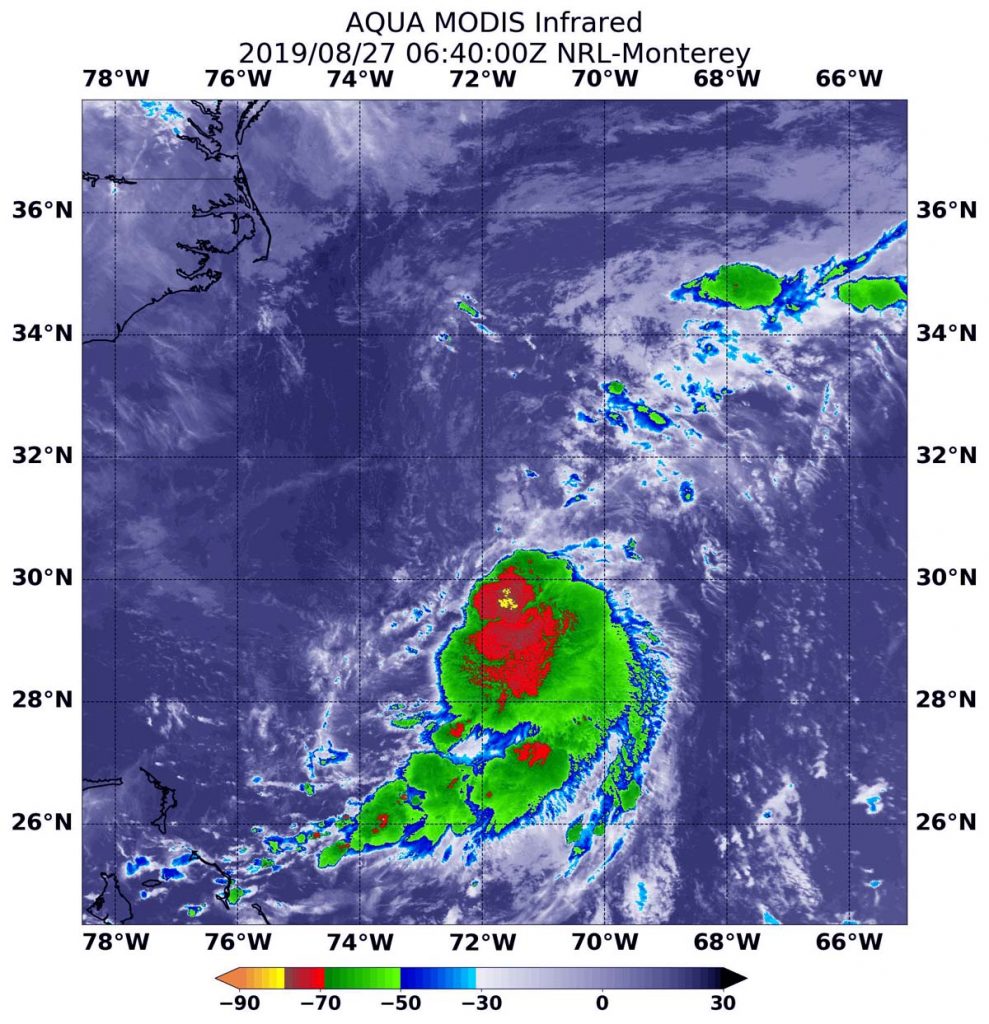
Infrared imagery from NASA’s Aqua satellite confirmed that wind shear was still affecting Tropical Storm Erin on Wednesday, August 28 at 3:25 a.m. EDT (0725 UTC). Infrared imagery reveals temperature data, and showed the only strong storms in the tropical storm were being pushed to the southeast. Strongest storms were as cold as minus 70 degrees Fahrenheit (minus 56.6 degrees Celsius).

Aqua image of Erin
Infrared imagery from NASA’s Aqua satellite confirmed that wind shear was still affecting Erin on Aug.28 at 3:25 a.m. EDT (0725 UTC). Infrared imagery reveals temperature data, and showed the only strong storms (red) in the tropical depression were pushed to the southeast. Strongest storms were as cold as minus 70 degrees Fahrenheit (minus 56.6 degrees Celsius). Credit: NASA/NRL

In general, wind shear is a measure of how the speed and direction of winds change with altitude. Tropical cyclones are like rotating cylinders of winds. Each level needs to be stacked on top each other vertically in order for the storm to maintain strength or intensify. Wind shear occurs when winds at different levels of the atmosphere push against the rotating cylinder of winds, weakening the rotation by pushing it apart at different levels.

By 11 a.m. EDT (1500 UTC), Tropical Storm Erin had weakened back to a depression. At that time, the center of Tropical Depression Erin was located near latitude 33.6 degrees north and longitude 72.8 degrees west. That places the center of Erin about 190 miles (305 km) southeast of Cape Hatteras, North Carolina. The bulk of clouds and precipitation, however, are south of the center. However, because Erin is so far from the coast, there are no coastal watches or warnings in effect.

The depression is moving toward the north-northwest near 13 mph (20 kph). Maximum sustained winds are near 35 mph (55 km/h) with higher gusts. The estimated minimum central pressure is 1006 millibars.

The cyclone is expected to turn northward later today and then north-northeastward early Thursday morning with an increase in forward speed.

NHC forecaster Daniel Brown noted in the Aug. 28 discussion, “The northwesterly shear that has been affecting Erin is forecast to decrease somewhat later today and tonight, but given the current structure of the system, little overall change in intensity is anticipated during that time. If convection does not re-develop closer to the center later today, Erin could become post-tropical.”

For updated forecasts, visit: www.nhc.noaa.gov

By Rob Gutro
NASA’s Goddard Space Flight Center

Dorian (Atlantic Ocean)

Aug. 28, 2019 – Update #1 – NASA Finds Heavy Rain Potential in Tropical Storm Dorian

NASA’s Aqua satellite provided forecasters at the National Hurricane Center with visible imagery and infrared data on Tropical Storm Dorian as it continued its western track into the Eastern Caribbean Sea. Infrared data provided an indication of the storm’s heavy rain making potential.

Aqua image of Dorian
On Aug. 27 at 1:35 p.m. EDT (1735 UTC) the MODIS instrument aboard NASA’s Aqua provided a visible look at Tropical Storm Dorian as it moved over the Leeward Islands. Credit: NASA Worldview, Earth Observing System Data and Information System (EOSDIS)

Watches and Warnings

On Wednesday, August 28, 2019, the National Hurricane Center or NHC noted that a Hurricane Watch is in effect for Puerto Rico, Vieques, Culebra, and the U.S. Virgin Islands. A Tropical Storm Warning is in effect for Puerto Rico, Vieques, Culebra, the U.S. Virgin Islands and the British Virgin Islands. A Tropical Storm Watch is in effect for the Dominican Republic from Isla Saona to Samana.

Infrared Temperatures Indicate Strong Storms

Cloud top temperatures provide information to forecasters about where the strongest storms are located within a tropical cyclone. The stronger the storms, the higher they extend into the troposphere, and the colder the cloud top temperatures. NASA’s Aqua satellite analyzed Tropical Storm Dorian’s cloud tops to get that information. AIRS found that some areas in Dorian were being affected by dry air, which was sapping the development of thunderstorms.

Aqua image of Dorian
On Aug. 27 at 1:35 p.m. EDT (1735 UTC), the AIRS instrument aboard NASA’s Aqua satellite analyzed cloud top temperatures of Tropical Storm Dorian in infrared light. AIRS found coldest cloud top temperatures (purple) of strongest thunderstorms were as cold as or colder than minus 63 degrees Fahrenheit (minus 53 degrees Celsius). Credit: NASA JPL/Heidar Thrastarson

The NHC noted that 10-mile wide eye feature developed in Martinique and Guadeloupe radar data between 11 a.m. and 12 p.m. EDT (1500-1600 UTC) around the time Aqua passed over Dorian, and then again between 1 p.m. and 2 p.m. EDT (1700-1800 UTC) around the time the Aqua satellite passed overhead.

NASA’s Aqua satellite analyzed the storm on Aug. 27 at 1:35 p.m. EDT (1735 UTC) using the Atmospheric Infrared Sounder or AIRS instrument. AIRS found coldest cloud top temperatures as cold as or colder than minus 63 degrees Fahrenheit (minus 53 degrees Celsius) around the center and in a thick band of thunderstorms east of the center. NASA research has indicated that cloud top temperatures that cold indicate strong storms that have the capability to create heavy rain.

Heavy Rainfall Expected

NHC forecasters said that Dorian is expected to produce the following rainfall accumulations:

  • Western Leeward Islands from Guadeloupe to St. Kitts to Anguilla…1 to 4 inches
  • Southern and Eastern Puerto Rico and the U.S. and British Virgin Islands…4 to 6 inches, isolated 10 inches
  • Northwestern Puerto Rico…1 to 4 inches
  • Haiti and Dominican Republic…1 to 3 inches
  • Southern Bahamas…1 to 4 inches
  • Northern Bahamas…3 to 6 inches
  • Florida Peninsula…4 to 8 inches, isolated 10 inches

This rainfall may cause life-threatening flash floods.

Dorian’s Status at 8 a.m. EDT on August 28, 2019

At 8 a.m. EDT (1200 UTC), the center of Tropical Storm Dorian was located near latitude 17.1 North, longitude 64.1 West.

Dorian is moving toward the northwest near 13 mph (20 kph), and this general motion is expected to continue during the next few days.  Maximum sustained winds are near 60 mph (95 kph) with higher gusts. Tropical-storm-force winds extend outward up to 60 miles (95 km) from the center. NHC forecasters said some strengthening is expected today, and Dorian is forecast to be near hurricane strength when it approaches the Virgin Islands and Puerto Rico. An Air Force reconnaissance plane just reported an estimated minimum central pressure of 1003 millibars.

Tropical storm conditions are expected and hurricane conditions are possible in Puerto Rico, Vieques, Culebra, and the U.S. Virgin Islands today. Swells are expected to increase later this morning across the U.S. and British Virgin Islands and along the southern coasts of Puerto Rico and Hispaniola, and they could cause life-threatening surf and rip current conditions.

On the forecast track, the center of Dorian will pass over or near the U.S. and British Virgin Islands and Puerto Rico later today, Aug. 28. Dorian is then forecast to move to the east of the Turks and Caicos and the southeastern Bahamas on Thursday, and near or to the east of the central and northwestern Bahamas on Friday and Saturday.

For updated forecasts, visit: www.nhc.noaa.gov

By Rob Gutro
NASA’s Goddard Space Flight Center  

Podul (was 13W) – Northwestern Pacific Ocean

Aug. 27, 2019 – NASA-NOAA Satellite Tracks Tropical Depression Podul Across Philippines

Tropical Depression 13W, now named Podul, was crossing the Philippines from east to west as NASA-NOAA’s Suomi NPP satellite provided a visible image of the storm.

Suomi NPP image of Podul
On August 27, 2019, NASA-NOAA’s Suomi NPP satellite passed over the South China Sea and captured a visible image of Tropical Storm Podul. Credit: NASA Worldview, Earth Observing System Data and Information System (EOSDIS).

Podul’s trek across the country triggered many Philippines warnings on August 27, 2019. Tropical cyclone wind signal #2 is in effect over the following Luzon provinces:  Isabela, Aurora, Quirino, Nueva Vizcaya, Ifugao, Mountain Province, Ifugao, Benguet, Ilocos Sur, La Union and Pangasinan. Tropical cyclone wind signal #1 is in effect over the following Luzon provinces: Cagayan, Apayao, Abra, Kalinga, Ilocos Norte, Nueva Ecija, Tarlac, Zambales, Bataan, Pampanga, Bulacan, Metro Manila, Rizal, northern portion of Quezon including Polillo Island and Alabat Island, Cavite, Laguna, Camarines Norte, northeastern portion of Camarines Sur and Catanduanes.

The Visible Infrared Imaging Radiometer Suite (VIIRS) instrument aboard Suomi NPP provided a visible image of the storm on August 27, 2019. The VIIRS image showed the storm blanketed the country from north to south. The bulk of the clouds were located over the northern and central Philippines.

At 11 a.m. EDT (1500 UTC), Podul, known locally in the Philippines as “Jenny,” was located near 16.0 degrees north latitude and 123.2 degrees east longitude. That puts the center of circulation about 153 nautical miles northeast of Manila, Philippines. It was moving to the west-northwest and had maximum sustained winds near 30 knots (34.5 mph/55.5. kph).

The Joint Typhoon Warning Center said that Podul will move west across the Philippines, before turning northwest towards Hainan Island, China. The system is expected to make final landfall in Vietnam after five days.

By Rob Gutro 
NASA’s Goddard Space Flight Center

TD6 – Atlantic Ocean

Aug. 27, 2019 – NASA Finds Tropical Depression Battling Wind Shear off the Carolina Coast

Newly formed Tropical Depression 6 in the Atlantic Ocean may have just formed, but it did so under adverse atmospheric conditions. The depression is battling wind shear and it’s apparent on imagery from NASA’s Aqua satellite.

Aqua image of TD6
On August 27 at 2:40 a.m. EDT (0640 UTC) the MODIS instrument that flies aboard NASA’s Aqua satellite showed a very small area of strongest storms (yellow) in Tropical Depression 6’s center where cloud top temperatures were as cold as minus 80 degrees Fahrenheit (minus 62.2 Celsius). Credit: NASA/NRL

Wind shear is a measure of how the speed and direction of winds change with altitude. When outside winds batter a tropical cyclone, it affects its circulation. A less circular storm tends to slow down in its spin and weaken.

Tropical Depression 6 or TD6 formed around 5 p.m. EDT on August 26 and has since been moving slowly while remaining a few hundred miles off the coast of the Carolinas.

On August 27 at 2:40 a.m. EDT (0640 UTC), the Moderate Imaging Spectroradiometer or MODIS instrument that flies aboard NASA’s Aqua satellite used infrared light to analyze the strength of storms within the depression. Tropical cyclones are made of up hundreds of thunderstorms, and infrared data can show where the strongest storms are located. They can do that because infrared data provides temperature information, and the strongest thunderstorms that reach highest into the atmosphere have the coldest cloud top temperatures.

MODIS found those strongest storms had cloud top temperatures as cold as minus 80 degrees Fahrenheit (minus 62.2 Celsius). NASA research has found that cloud top temperatures that cold indicate strong storms with the potential to generate heavy rainfall. Those strongest storms were in a small area around the center of circulation. Less strong storms were pushed to the south by northerly wind shear.

The NHC or National Hurricane Center noted in their Discussion on Aug. 27 at 11 a.m. EDT “The depression, however, continues to be sheared with the low-level center to the north of the convection. The northwesterly shear currently affecting the depression is expected to continue, and only a small increase in intensity is anticipated in the next couple of days.”

NHC noted at 11 a.m. EDT (1500 UTC), the center of Tropical Depression Six was located near latitude 31.2 degrees north and longitude 71.2 degrees west. That’s about 385 miles (615 km) west of Bermuda and about 370 miles (600 km) southeast of Cape Hatteras, North Carolina.

The depression has been drifting northward near 2 mph (4 kph), and little motion is anticipated today. Maximum sustained winds are near 35 mph (55 km/h) with higher gusts. Some strengthening is expected, and the cyclone is forecast to become a tropical storm later tonight or on Wednesday.

NHC forecasters expect TD6 should begin to move generally northward and then northeastward on Wednesday over the open Atlantic.

For updated forecasts, visit: https://www.nhc.noaa.gov

By Rob Gutro
NASA’s Goddard Space Flight Center

Dorian – Atlantic Ocean

Aug. 27, 2019 – NASA Analyzes Tropical Storm Dorian Day and Night

Tropical Storm Dorian was approaching the Leeward Islands when NASA-NOAA’s Suomi NPP satellite passed overhead from space and snapped a visible image of the storm. When Suomi NPP came by again the satellite provided a night-time image from early morning on Aug. 27.

Daytime image of Dorian
NASA-NOAA’s Suomi NPP satellite passed over the western North Atlantic Ocean and captured a visible image of Tropical Storm Dorian approaching the Leeward Islands on Aug. 26, 2019. Credit: NASA Worldview, Earth Observing System Data and Information System (EOSDIS).

The Leeward Islands are a group of islands in the eastern Caribbean Sea, where the sea meets the western Atlantic Ocean. The Leewards extend from the Virgin Islands east of Puerto Rico, southeast to Guadeloupe and its dependencies.

The Visible Infrared Imaging Radiometer Suite (VIIRS) instrument aboard Suomi NPP provided a visible image of the storm on August 26, 2019. The VIIRS image showed the storm had taken on somewhat of a comma shape. That shape and the storm’s thunderstorm pattern changed over the course of the day because dry air moved into mid-level areas of the storm, suppressing thunderstorm development. A tropical cyclone is made up of hundreds of thunderstorms, so when development is inhibited, it affects the storm’s strength and sometimes the shape of the storm, depending on the direction from which the dry air comes.

By 5 p.m. EDT on Aug. 26, the National Hurricane Center said, “Although the inner-core convection has decreased recently, a recent burst of strong convection (rising air that forms thunderstorms) with cloud tops colder than minus 80 degrees Celsius [indicating powerful thunderstorms with the potential to generate heavy rainfall] has redeveloped just north of the low-level center.”

NIghttime image of Dorian
At 1:06 a.m. EDT (0506 UTC) on Aug. 27, the Suomi NPP satellite passed over Dorian again, and viewed the storm at night and obtained high resolution infrared-band imagery. The nighttime image showed that Dorian appeared to be relatively compact in size with a few overshooting cloud tops and some tropospheric convective gravity waves. Credit: NASA/NOAA/UWM-SSEC-CIMSS/William Straka III

At 1:06 a.m. EDT (0506 UTC) on Aug. 27, the Suomi NPP satellite passed over Dorian again, and viewed the storm at night and obtained high-resolution infrared-band imagery. The nighttime image showed that Dorian appeared to be relatively compact in size with a few overshooting cloud tops and some tropospheric convective gravity waves.

The nighttime image was created by William Straka III, a researcher at the University of Wisconsin – Madison, Space Science and Engineering Center (SSEC Cooperative Institute for Meteorological Satellite Studies (CIMSS). “The Waning Crescent moon, with 12 percent illumination didn’t show many features,” Straka said. “Even with airglow present, though one could see the city lights peeking through the clouds and a lone ship on the southern edge of the storm.”

By August 27, Dorian moved across St. Lucia and into the eastern Caribbean Sea bringing tropical-storm-force winds with it. NHC said the Caribbean composite radar data show that Dorian remains a very compact system and that it still lacks a well-defined inner core.

The National Hurricane Center or NHC posted many watches and warnings on Aug. 27. A Hurricane Watch is in effect for Puerto Rico, the Dominican Republic from Isla Saona to Samana. A Tropical Storm Warning is in effect for Martinique, St. Vincent and the Grenadines and Puerto Rico. A Tropical Storm Watch is in effect for Dominica, Grenada and its dependencies, Saba and St. Eustatius, Dominican Republic from Isla Saona to Punta Palenque, and the Dominican Republic from Samana to Puerto Plata.

At 8 a.m. EDT (1200 UTC) on Tuesday, Aug. 27, NOAA’s National Hurricane Center or NHC noted the center of Tropical Storm Dorian was located by surface observations and Martinique radar data near latitude degrees 14.0 North and longitude 61.2 West. That puts the storm’s center just 15 miles (25 km) west-northwest of St. Lucia.

Dorian is moving toward the west-northwest near 13 mph (20 kph), and this motion is expected to continue through tonight, followed by a turn toward the northwest on Wednesday.

Maximum sustained winds are near 50 mph (85 kph) with higher gusts. Slow strengthening is forecast during the next 48 hours, and Dorian is forecast to be near hurricane strength when it moves close to Puerto Rico and eastern Hispaniola.

NHC said, “On the forecast track, the center of Dorian will move across the eastern and northeastern Caribbean Sea during the next few days, passing near or south of Puerto Rico on Wednesday [Aug. 28], move near or over eastern Hispaniola Wednesday night, and move north of Hispaniola on Thursday [Aug. 29].“

For updated forecasts, visit: www.nhc.noaa.gov

By Rob Gutro
NASA’s Goddard Space Flight Center

13W – Northwestern Pacific Ocean

Aug. 26, 2019 – NASA’s Terra Satellite Finds Some Power in Tropical Depression 13W

Infrared imagery from NASA’s Terra satellite revealed Tropical Depression 13W contained some powerful thunderstorms pushing high into the troposphere as it was moving west in the Philippine Sea toward the Philippines.

Terra image of 13W
On August 26 at 9:15 a.m. EDT (1315 UTC), the MODIS instrument that flies aboard NASA’s Terra satellite found strongest storms (yellow) had cloud top temperatures as cold as minus 80 degrees Fahrenheit (minus 62.2 Celsius). Credit: NASA/NRL

Tropical Depression 13W has already triggered warnings in the Philippines because it is located just east of the country. Philippines warnings include Tropical cyclone wind signal #1 over the following Luzon provinces: Cagayan, Isabela, Quirino, Nueva Vizcaya, Apayao, Abra, Kalinga, Mountain Province, Ifugao, Benguet, Aurora, Nueva Ecija, eastern portion of Pangasinan, northern portion of Quezon including Polillo Island and Catanduanes.

NASA’s Terra satellite used infrared light to analyze the strength of storms and found the most powerful thunderstorms stretching north over the center from west to east. Infrared data provides temperature information, and the strongest thunderstorms that reach high into the atmosphere have the coldest cloud top temperatures.

On August 26 at 9:15 a.m. EDT (1315 UTC), the Moderate Imaging Spectroradiometer or MODIS instrument that flies aboard NASA’s Terra satellite found those strongest storms had cloud top temperatures as cold as minus 80 degrees Fahrenheit (minus 62.2 Celsius). Cloud top temperatures that cold indicate strong storms with the potential to generate heavy rainfall.

At 11 a.m. EDT (1500 UTC), the center of Tropical Depression 13W was located near latitude 13.9 degrees north latitude and 128.5 degrees east longitude. That is about 498 nautical miles east of Manila, Philippines. 13W was moving toward the west and toward the Philippines. Maximum sustained winds are near 52 mph (45 knots/83 kph) with higher gusts.

The Joint Typhoon Warning Center expects 13W will move west across the Philippines, before turning northwest towards Hainan Island, China. The system will make final landfall in Vietnam after five days.

By Rob Gutro
NASA’s Goddard Space Flight Center

Dorian – Atlantic Ocean

Aug. 26, 2019 – NASA-NOAA Satellite Finds Heavy Rainmaking Ability in Tropical Storm Dorian

NASA-NOAA’s Suomi NPP satellite passed over Tropical Storm Dorian as it triggered warnings and watches for the  islands of the Eastern Caribbean Sea.

Suomi NPP image of Dorian
NASA-NOAA’s Suomi NPP satellite passed over Tropical Storm Dorian in the western North Atlantic Ocean and the VIIRS instrument aboard captured this image of the storm on Aug. 26 at 1:54 a.m. EDT (0554 UTC). Coldest (red) cloud top temperatures were as cold as minus 70 degrees Fahrenheit (minus 56.6 Celsius). Credit: NASA/NRL

On Monday, August 26, 2019, a Tropical Storm Warning is in effect for Barbados, Martinique, St. Lucia, St. Vincent and the Grenadines. A Tropical Storm Watch is in effect for Dominica, Grenada and its dependencies, Saba and St. Eustatius. A Hurricane Watch is in effect for St. Lucia.

Dorian formed as a tropical depression on Saturday, Aug. 24 about 805 miles (1,300 km) east-southeast of Barbados. By 5 p.m. EDT that day, the depression strengthened into a tropical storm and was named Dorian.

NASA-NOAA’s Suomi NPP satellite passed over Tropical Storm Dorian in the western North Atlantic Ocean on Aug. 26 at 1:54 a.m. EDT (0554 UTC). The Visible Infrared Imaging Radiometer Suite (VIIRS) instrument aboard Suomi NPP provided an infrared image of the storm. Infrared imagery reveals cloud top temperatures, and the higher the cloud top, the colder it is, and the stronger the storm. Coldest cloud top temperatures were as cold as minus 70 degrees Fahrenheit (minus 56.6 Celsius) and found around the center of circulation, southwest of the center and in fragmented bands of thunderstorms north of the center. Storms with cloud tops that cold have been found to generate heavy rainfall.

Dorian is a small tropical cyclone. Tropical-storm-force winds only extend outward up to 45 miles (75 km) from the center.

Those areas of strong storms with heavy rainfall potential play into the forecast. NOAA’s National Hurricane Center or NHC said that Dorian is expected to produce total rain accumulations of 3 to 8 inches in the Windward Islands from Martinique south to St. Vincent, including Barbados.  Isolated maximum totals of 10 inches are possible across the northern Windward Islands.  Rainfall totals of 1 to 3 inches are expected from the Grenadines, south to Grenada and across Dominica.

Satellite microwave imagery has shown a persistent low-level eye-like feature along with an intermittent mid-level eyewall forming that quickly erodes because of dry air entering the storm in the mid-levels of the atmosphere.

At 11 a.m. EDT (1500 UTC) on Monday, August 26, the center of Tropical Storm Dorian was located near latitude 12.3 degrees north and longitude 57.7 degrees west. The center of Dorian was about 135 miles (220 km) east-southeast of Barbados. The estimated minimum central pressure is 1002 millibars.

Dorian is moving toward the west-northwest near 14 mph (22 kph) and this motion is expected to continue through Tuesday night [Aug. 27], followed by a turn toward the northwest on Wednesday [Aug. 28]. Maximum sustained winds are near 60 mph (95 kph) with higher gusts.

Some strengthening is forecast during the next few days, and Dorian could be near hurricane strength when it passes through the northern Windward Islands on Tuesday, and is expected to be a hurricane when it moves near Puerto Rico and eastern Hispaniola.

The National Hurricane Center noted, “Hurricane conditions are possible tonight and early Tuesday within the Hurricane Watch area in the Lesser Antilles. Tropical storm conditions are likely in the warning area by late today. Tropical storm conditions are possible within the tropical storm watch area by tonight or Tuesday. Swells generated by Dorian will be affecting portions of the Lesser Antilles by late today. These swells could cause life-threatening surf and rip current conditions.”

On the forecast track, the center of Dorian is expected to be near the Windward Islands late today and tonight, and move into the eastern Caribbean Sea on Tuesday. Dorian is expected to pass near or south of Puerto Rico on Wednesday and approach eastern Hispaniola Wednesday night.

For updated forecasts, visit: www.nhc.noaa.gov

By Rob Gutro 
NASA’s Goddard Space Flight Center

Bailu (Northwestern Pacific Ocean)

Aug. 23, 2019 – NASA Satellite Catches Tropical Storm Bailu’s U-Shape

NASA’s Aqua satellite passed over the Northwestern Pacific Ocean and captured an image of Tropical Storm Bailu that appeared to have a U-shape.

On Aug. 23 at 12:55 a.m. EDT (04:55 UTC) the MODIS instrument aboard NASA’s Aqua satellite provided a visible image of Tropical Storm Bailu in the Northwestern Pacific Ocean, northeast of the Philippines. Credit: NASA/NRL

On Aug. 23 at 12:55 a.m. EDT (0455 UTC) the Moderate Resolution Imaging Spectroradiometer or MODIS instrument aboard NASA’s Aqua satellite provided a visible image of Bailu in the Philippine Sea. The storm’s has what appears to be a U-shape because of “deepening convection wrapping counterclockwise from the southwest to northeast,” according to the Joint Typhoon Warning Center. Deepening convection means stronger evaporation and rising air. Those factors form the clouds that create thunderstorms that make up a tropical cyclone.

At 5 a.m. EDT (0900 UTC), the center of Bailu was located near latitude 19.4 degrees north and longitude 124.5 degrees east. Bailu was about 417 nautical miles south-southeast of Taipei, Taiwan. Bailu was moving to the northwest and had maximum sustained winds near 45 knots (51.7 mph/83.3 kph).

The Joint Typhoon Warning Center expects Bailu to continue to track northwestward and skim extreme southern Taiwan on Aug. 24, before making landfall in China on Aug. 25. After landfall the system is expected to quickly weaken and is forecast to dissipate by Aug. 26.

Rob Gutro
NASA’s Goddard Space Flight Center, Greenbelt, Md.

Ivo (Eastern Pacific)

Aug. 23, 2019 – GPM Finds Heavy Rain Occurring in a Weaker Tropical Storm Ivo

Tropical Storm Ivo may have weakened in the overnight hours from Aug. 22 to Aug. 23, but the Global Precipitation Measurement mission or GPM core satellite has found that the storm is still generating heavy rainfall over the Eastern Pacific Ocean.

The GPM core satellite passed over Tropical Storm Ivo on Aug. 22 at 10:51 p.m. EDT (0251 UTC, Aug. 23). GPM found the heaviest rainfall (pink) around Ivo’s center of circulation falling at a rate of 25 mm (about 1 inch) per hour. Credit: NASA/JAXA/NRL

As Ivo was moving toward Mexico’s Clarion Island, the GPM satellite passed overhead and analyzed the rain rates throughout the storm on Aug. 22 at 10:51 p.m. EDT (0251 UTC, Aug. 23). GPM found the heaviest rainfall was occurring in a fragmented band of thunderstorms west of the center of circulation where it was falling at a rate of 40 mm (about 1.6 inch) per hour. GPM is a joint mission between NASA and the Japan Aerospace Exploration Agency, JAXA.

At 5 a.m. EDT (0900 UTC), the center of Tropical Storm Ivo was located near latitude 17.9 degrees n and longitude 114.5 degrees west. That puts the center about 455 miles (735 km) southwest of the southernmost tip of Baja California, Mexico. The National Hurricane Center or NHC said that Ivo is moving toward the north-northwest near 10 mph (17 kph), and this general motion is expected to continue for the next 2 to 3 days.

Maximum sustained winds are near 60 mph (95 kph) with higher gusts. The estimated minimum central pressure is 996 millibars.

NHC noted, “Little change in intensity is expected today, but Ivo should begin to weaken on Saturday [August 24].”

For updated forecasts, visit: www.nhc.noaa.gov.

Rob Gutro
NASA’s Goddard Space Flight Center, Greenbelt, Md.

Chantal (Atlantic Ocean)

Aug. 23, 3019 – NASA’s Aqua Satellite Writing the End of Depression Chantal’s Story

Tropical Depression Chantal is winding down in the North Central Atlantic Ocean and that was confirmed by infrared data from NASA’s Aqua satellite on August 23.

On Aug. 23 at 12:45 a.m. EDT (0445 UTC), the MODIS instrument that flies aboard NASA’s Aqua satellite showed strongest storms (yellow) in Tropical Depression Chantal were in two small areas, east and west of center, where cloud top temperatures in those areas were as cold as minus 50 degrees Fahrenheit (minus 45.5 Celsius). Credit: NASA/NRL

The National Hurricane Center or NHC forecasts the end of Chantal’s life story later in the day, as the storm is forecast to become a remnant low pressure area.

On Aug. 23 at 1:30 a.m. EDT (0530 UTC), the Moderate Imaging Spectroradiometer or MODIS instrument that flies aboard NASA’s Aqua satellite used infrared light to analyze the strength of storms by providing temperature information about the system’s clouds. The strongest thunderstorms that reach high into the atmosphere have the coldest cloud top temperatures.

Two areas remained with strongest storms. Those areas were east and west of the center of circulation where cloud top temperatures were as cold as minus 50 degrees Fahrenheit (minus 45.5 degrees Celsius).

At 5 a.m. EDT (0900 UTC), the center of Tropical Depression Chantal was located near latitude 37.1 degrees north and longitude 40.9 degrees west. That places the center of Chantal about 765 miles (1,225 km) west of the Azores Islands. Chantal is moving toward the southeast near 8 mph (13 kph) and is expected to make a slow clockwise loop over the next few days.

Maximum sustained winds have decreased to near 30 mph (45 kph) with higher gusts. The estimated minimum central pressure is 1010 millibars.

NOAA’s National Hurricane Center noted, “Additional weakening is forecast, and Chantal is likely to degenerate into a remnant low by tonight. The remnant low could dissipate by late Sunday [Aug. 25] or Monday [Aug. 26].”

For updated forecasts, visit: www.nhc.noaa.gov

Rob Gutro
NASA’s Goddard Space Flight Center