Cristina – Eastern Pacific Ocean

July 12, 2020 – NASA’s Aqua Satellite Finds a Small Area of Strength Left in Cristina

Tropical Storm Cristina was barely holding onto tropical storm status on Sunday, July 12, 2020, as infrared imagery from NASA’s Aqua satellite revealed only one area of strong storms remaining.
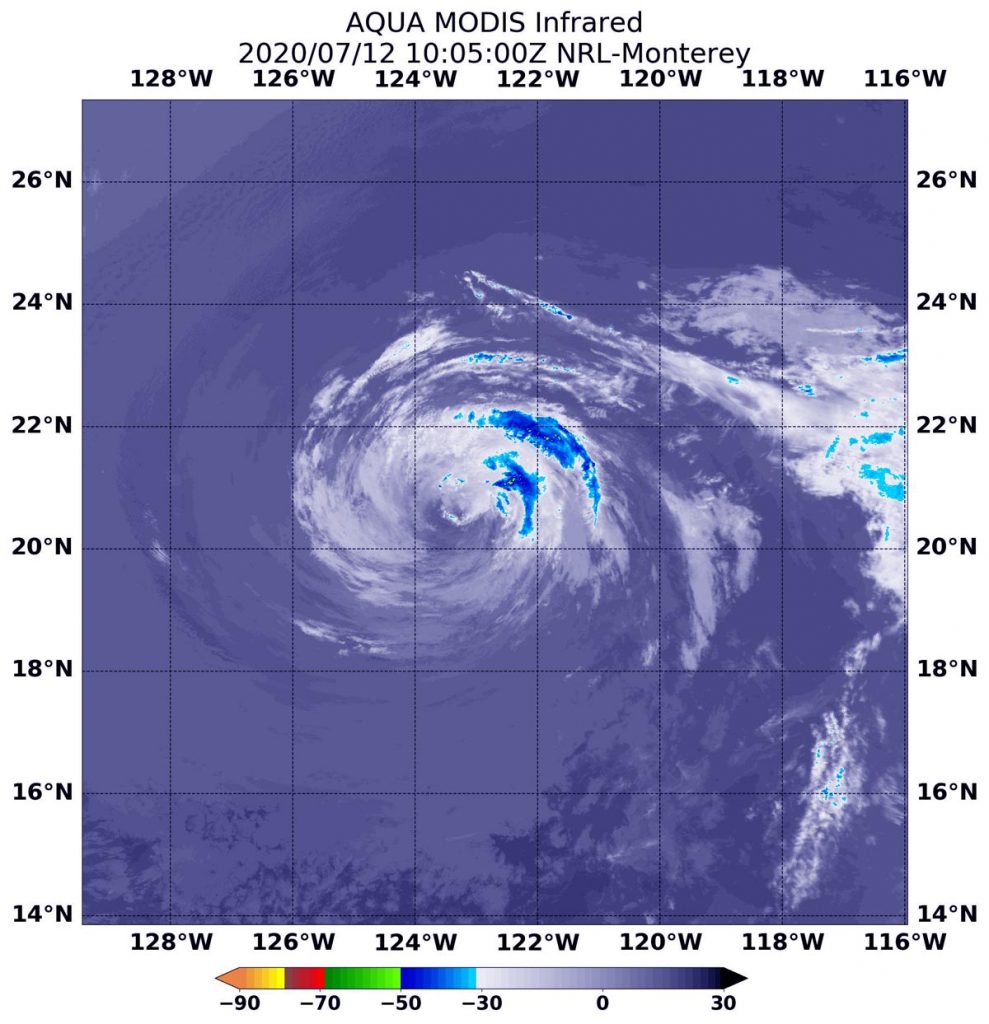
Aqua image of Cristina
On July 12 at 6:05 a.m. EDT (1005 UTC) the MODIS instrument that flies aboard NASA’s Aqua satellite showed a small area of strong storms in Tropical Storm Cristina east of the center of circulation where cloud top temperatures were as cold as minus 50 degrees Fahrenheit (in dark blue) (minus 45.5 Celsius). Credit: NASA/NRL

The National Hurricane Center expects Cristina to weaken to a remnant low-pressure area in the next day.

Infrared data provides temperature information, and the strongest thunderstorms that reach high into the atmosphere have the coldest cloud top temperatures. NASA uses instruments aboard various satellites to provide infrared, microwave and visible data. Those data help forecasters determine if a storm is intensifying or weakening.

On July 12 at 6:05 a.m. EDT (1005 UTC) the Moderate Resolution Imaging Spectroradiometer or MODIS instrument that flies aboard Aqua  showed a small area of strong storms in Tropical Storm Cristina east of the center of circulation where cloud top temperatures were as cold as minus 50 degrees Fahrenheit (minus 45.5 degrees Celsius).

At 4 a.m. EDT (0900 UTC) on July 12, the center of Tropical Storm Cristina was located near latitude 20.7 degrees north and longitude 123.3 degrees west. That is about 870 miles (1,405 km) west of the southern tip of Baja California, Mexico. The National Hurricane Center (NHC) said that Cristina is moving toward the west near 13 mph (20 kph), and this motion is expected to continue for the next few days. Maximum sustained winds have decreased to near 45 mph (75 kph) with higher gusts.  The estimated minimum central pressure is 1002 millibars.

NHC Hurricane Forecaster Eric Blake noted in the 4 a.m. EDT discussion, “Conventional satellite and scatterometer data indicate that Cristina has weakened during the past several hours. Deep convection [strong rising air that forms the thunderstorms that make up a tropical cyclone] has become fragmented near the center of the cyclone, with only a small amount in the eastern semicircle.

Cristina should gradually lose strength during the next few days due to a combination of very cool waters and increasing [wind] shear, along with nearby dry air. These factors will likely cause the storm to transition into a non-convective remnant low on Monday.”

For more than five decades, NASA has used the vantage point of space to understand and explore our home planet, improve lives and safeguard our future. NASA brings together technology, science, and unique global Earth observations to provide societal benefits and strengthen our nation. Advancing knowledge of our home planet contributes directly to America’s leadership in space and scientific exploration.

For updated forecasts, visit: www.nhc.noaa.gov

By Rob Gutro
NASA’s Goddard Space Flight Center

Fay – Atlantic Ocean

July 11, 2020 – NASA Catches Tropical Storm Fay’s Landfall and New York Trip

Two NASA satellites provided forecasters with data on Tropical Storm Fay as it made landfall and tracked into upstate New York, breaking rainfall records in New Jersey and the New York City region.

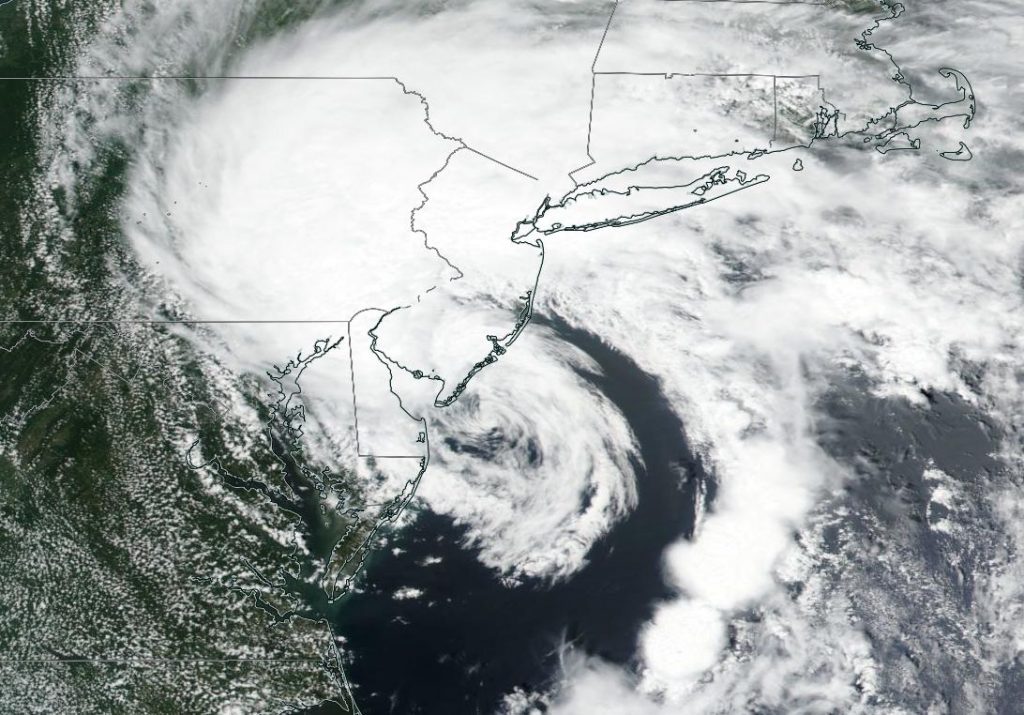
Suomi NPP image of Fay
NASA-NOAA’s Suomi NPP satellite provided a visible image of Tropical Storm Fay after it made landfall near Atlantic City, New Jersey, late on July 10. The visible image showed an elongated storm with the bulk of clouds north of the center and a large band of thunderstorms wrapping into the center from the east. Credit: NASA Worldview, Earth Observing System Data and Information System (EOSDIS)

The Visible Infrared Imaging Radiometer Suite (VIIRS) instrument aboard NASA-NOAA’s Suomi NPP satellite provided a visible image of Tropical Storm Fay as it was making landfall near Atlantic City, New Jersey. The visible image showed an elongated storm with the bulk of clouds north of the center and a large band of thunderstorms wrapping into the center from the east.

At around 5 p.m. EDT (2100 UTC) on July 10, satellite imagery indicated that the center of Tropical Storm Fay made landfall along the coast of New Jersey about 10 miles (15 km) north-northeast of Atlantic City, near latitude 39.5 degrees north and longitude 74.3 degrees west.

Record Rainfall Recorded in New Jersey and New York

Fay brought heavy rains that downed trees and caused street flooding from the New Jersey shore to New York City. Local authorities reported that many subway stations around New York City experienced flooding from the heavy rains. On July 10, the National Weather Service weather station in Central Park, New York received 2.54 inches of rainfall, breaking a record. JFK Airport in New York also broke a rainfall record after receiving 2.33 inches. In New Jersey, Newark broke a rainfall record for the day, after receiving 2.78 inches.

NASA’s Aqua Satellite Observes a Weaker Fay

The following day, NASA’s Aqua satellite provided an infrared analysis of Fay after its center had moved north into New York State. NASA’s Aqua satellite uses infrared light to analyze the strength of storms by providing temperature information about the system’s clouds. The strongest thunderstorms that reach high into the atmosphere have the coldest cloud top temperatures.

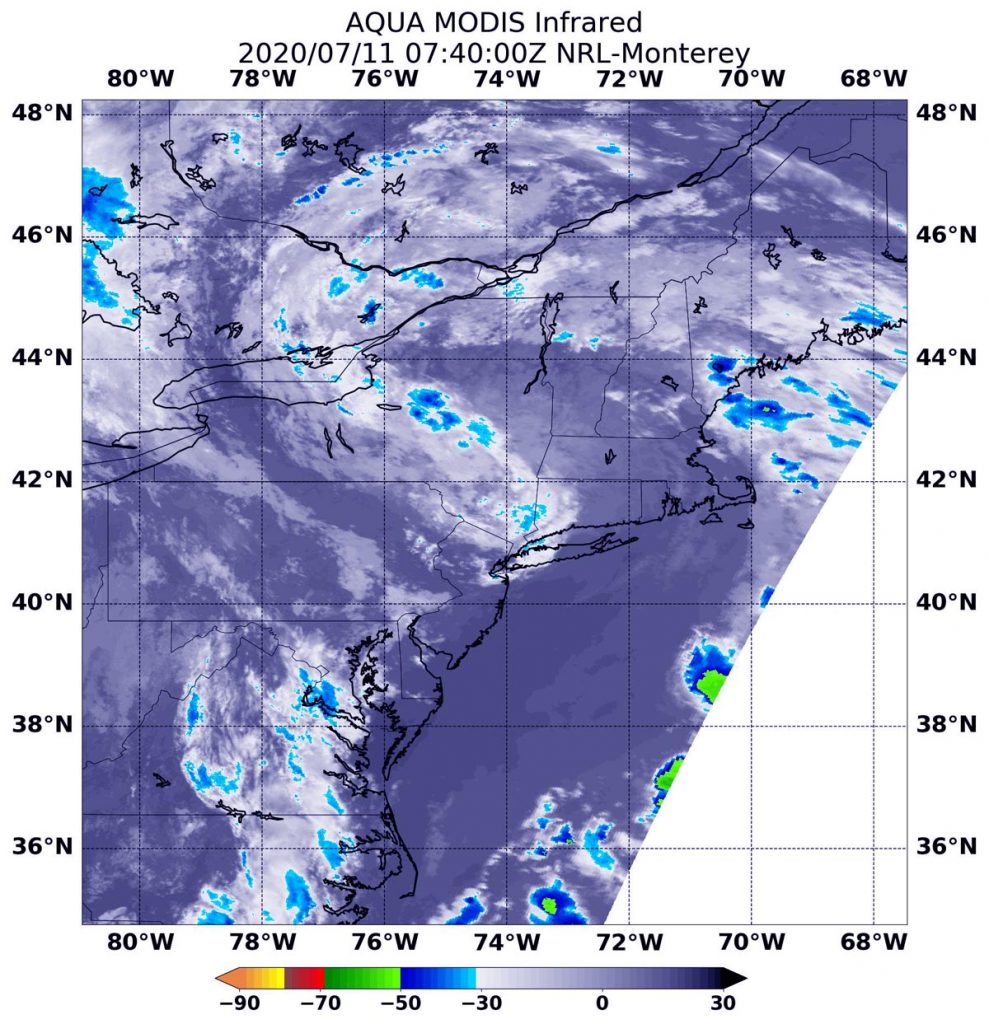
Aqua image of Fay
On July 11 at 3:40 a.m. EDT (0740 UTC), NASA’s Aqua satellite found some small areas of moderate thunderstorms (blue) in Upstate New York and stretching over Lake Ontario and into the Ontario province of Canada, where cloud top temperatures were as cold as minus 50 degrees Fahrenheit (minus 45.5 Celsius). Credit: NASA/NRL

On July 11 at 3:40 a.m. EDT (0740 UTC), the Moderate Resolution Imaging Spectroradiometer or MODIS instrument that flies aboard NASA’s Aqua satellite gathered infrared data on Fay. There were some small areas of moderate thunderstorms in upstate New York and stretching over Lake Ontario and into the Ontario province of Canada, where cloud top temperatures were as cold as minus 50 degrees Fahrenheit (minus 45.5 Celsius). The National Hurricane Center or NHC noted, “The system has lacked significant organized deep convection for some time now, and therefore it has degenerated into a post-tropical low pressure system.”

Fay’s Final Status

At 5 a.m. EDT (0900 UTC) on July 11, the National Hurricane Center (NHC) issued their final advisory on Tropical Storm Fay. At that time, the center of Post-Tropical Cyclone Fay was located near latitude 42.4 degrees north and longitude 73.9 degrees west. That is about 30 miles (45 km) south of Albany New York. The post-tropical cyclone is moving toward the north near 17 mph (28 kph).  The estimated minimum central pressure is 1001 millibars.

Maximum sustained winds were near 35 mph (55 kph) with higher gusts. Weakening is forecast during the next day so, and the post-tropical cyclone is likely to dissipate by late Sunday, July 12.

Fay’s Expected Track to Dissipation

NHC forecasters expect a north-northeastward motion at a faster forward speed today, tonight and Sunday. On the forecast track, the center of the post-tropical cyclone will continue to move across portions of eastern New York this morning, then across northwestern New England later today and over southeastern Canada tonight and Sunday.

Rainfall is the biggest issue with Fay as it continues to move over land. The post-tropical cyclone is expected to produce 1 to 2 inches of rain with isolated maxima of 4 inches along and near its track from eastern New York into portions of New England.  This rain may result in flash flooding and urban flooding in areas with poor drainage where the heaviest amounts occur.

Tropical cyclones/hurricanes are the most powerful weather events on Earth. NASA’s expertise in space and scientific exploration contributes to essential services provided to the American people by other federal agencies, such as hurricane weather forecasting.

For local forecasts, visit: www.weather.gov

By Rob Gutro 
NASA’s Goddard Space Flight Center

Cristina – Eastern Pacific Ocean

July 11, 2020 – NASA Finds Cristina Still on the Cusp of Hurricane Status

Tropical Storm Cristina continues to move west through the Eastern Pacific Ocean and has been struggling to become a hurricane, but because it is tracking over cool waters.  So becoming a hurricane may not happen. Infrared satellite imagery revealed Cristina is also somewhat lopsided with the bulk of clouds and storms on its south and eastern sides.

Aqua image of Cristina
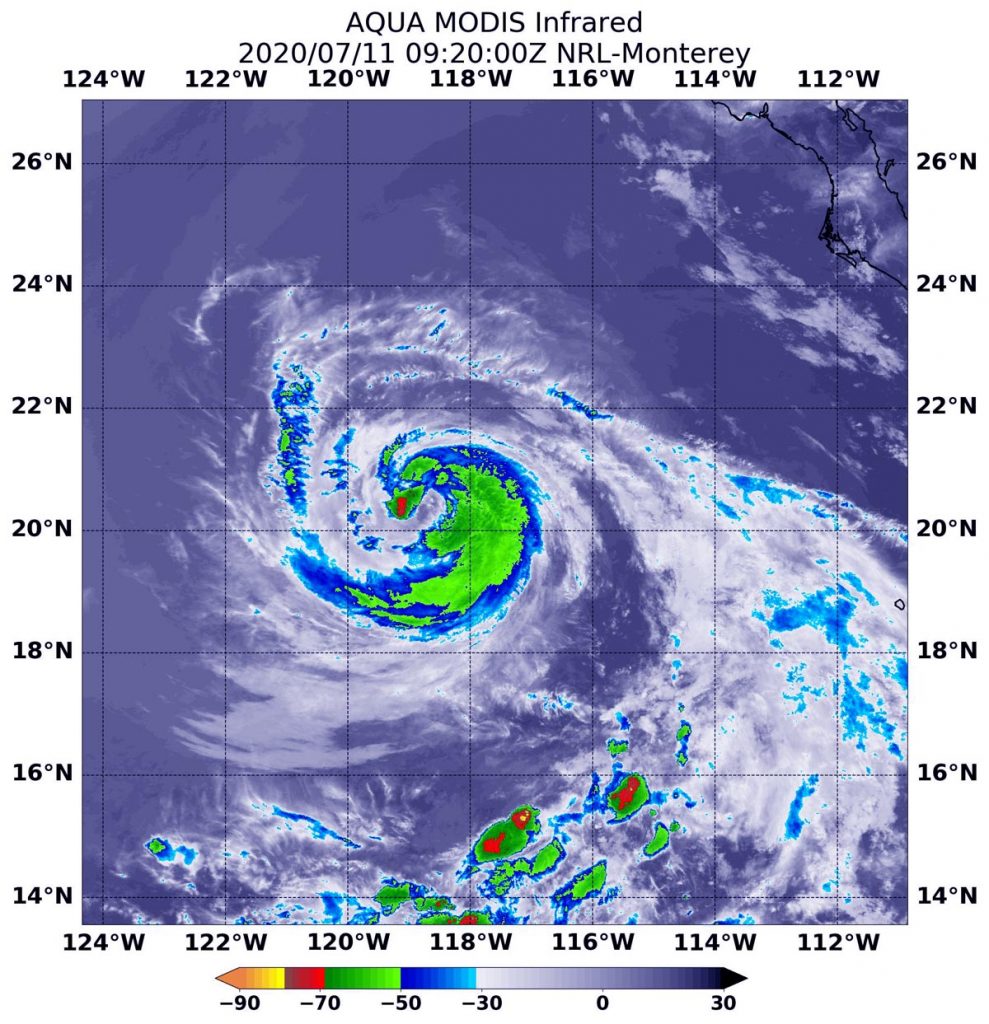
On July 11 at 5:20 a.m. EDT (0920 UTC) the MODIS instrument that flies aboard NASA’s Aqua satellite showed a very small area of strongest storms in Tropical Storm Cristina around the center of circulation where cloud top temperatures were as cold as minus 70 degrees Fahrenheit (in red) (minus 56.6 Celsius). Strong storms with slightly warmer temperatures surrounded the rest of the storm. Credit: NASA/NRL

At 11 p.m. EDT on July 10, satellite data indicated an eye-like feature developing in Cristina that disappeared by the morning hours of July 11. Cristina is struggling to intensify further because it is moving over cool sea surface temperatures. NASA’s Aqua satellite provided a look at the cloud top and sea surface temperatures around Cristina.

The National Hurricane Center noted that despite being over relatively cool 24 degrees Celsius (75.2 degrees Fahrenheit) waters, Cristina is maintaining its strength for now. Tropical cyclones require sea surface temperatures of at least 26.6 degrees Celsius (80 degrees Fahrenheit) to maintain strength.

Infrared data provides temperature information, and the strongest thunderstorms that reach high into the atmosphere have the coldest cloud top temperatures.

On July 11 at 5:20 a.m. EDT (0920 UTC) the Moderate Resolution Imaging Spectroradiometer or MODIS instrument that flies aboard Aqua showed a very small area of the strongest storms in Tropical Storm Cristina around the center of circulation where cloud top temperatures were as cold as minus 70 degrees Fahrenheit (minus 56.6 Celsius). Strong storms with slightly warmer temperatures surrounded the rest of the storm. Deep convection wraps most of the way around the center and is strongest on the south side of the circulation.

At 5 a.m. EDT (0900 UTC), the center of Tropical Storm Cristina was located near latitude 20.4 north and longitude 118.3 west.  That is about 565 miles (910 km) west-southwest of the southern tip of Baja California, Mexico. Cristina is moving toward the west-northwest near 16 mph (26 kph) and this motion is expected into early next week. Maximum sustained winds are near 70 mph (110 kph) with higher gusts.  Weakening of the storm is forecast to begin soon and Cristina is expected to become a post-tropical cyclone early next week.

By Rob Gutro
NASA’s Goddard Space Flight Center

Cristina – Eastern Pacific Ocean

July 10, 2020 – NASA Infrared Data Shows Cristina Strengthening

NASA’s Aqua satellite revealed better organization and colder cloud top temperatures in Tropical Storm Cristina, indications that the storm was strengthening.

Aqua image of Cristina
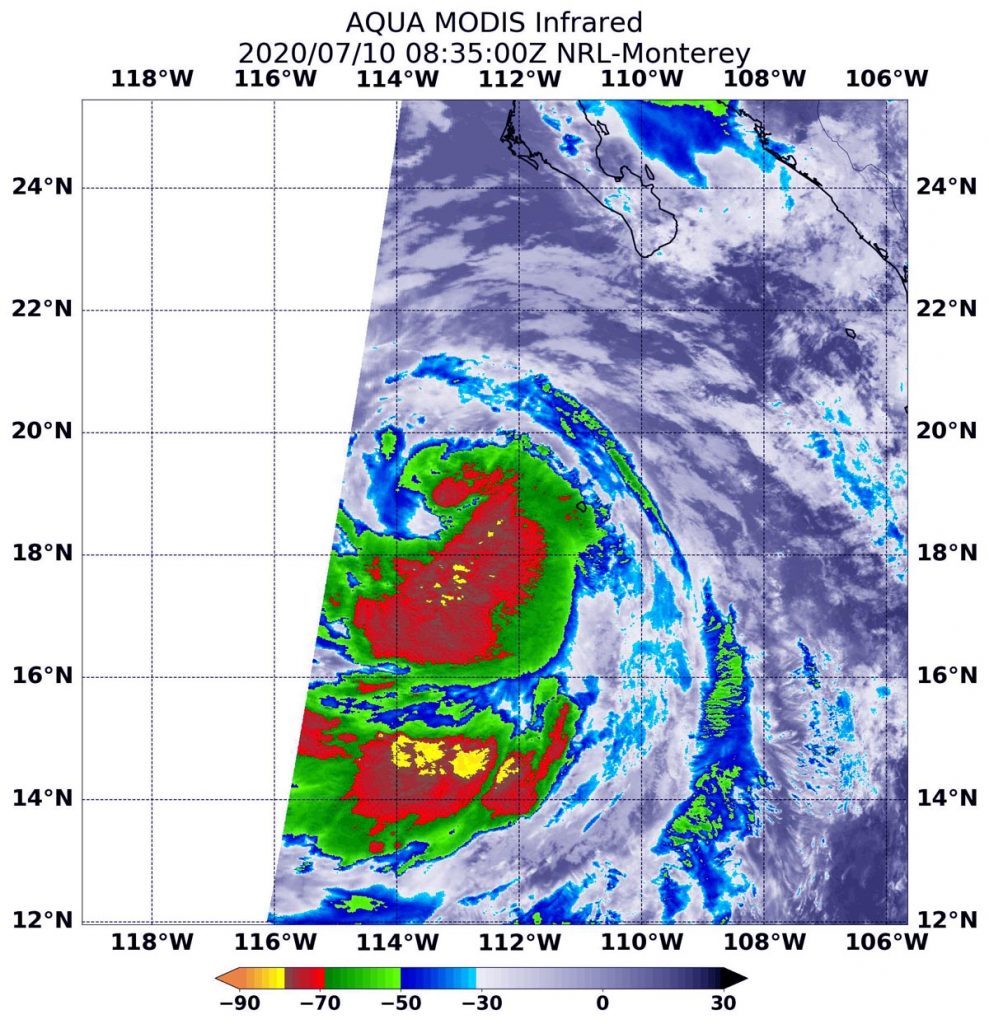
On July 10 at 4:35 a.m. EDT (0835 UTC), the MODIS instrument aboard NASA’s Aqua satellite gathered temperature information about Tropical Storm Cristina’s cloud tops. MODIS found a small area of powerful thunderstorms (red) where temperatures were as cold as or colder than minus 70 degrees Fahrenheit (minus 56.6 Celsius). Credit: NASA/NRL

On July 10 at 4:35 a.m. EDT (0835 UTC), the MODIS instrument aboard NASA’s Aqua satellite analyzed Tropical Storm Cristina’s cloud tops in infrared light. Infrared data provides temperature information, and the strongest thunderstorms that reach high into the atmosphere have the coldest cloud top temperatures.

The Moderate Resolution Imaging Spectroradiometer or MODIS instrument aboard NASA’s Aqua satellite found that the most powerful thunderstorms were east and south of the center of circulation, where temperatures were as cold as or colder than minus 70 degrees Fahrenheit (minus 56.6 Celsius). These cloud top temperatures had become colder than they were over the previous day. Cloud top temperatures that cold indicate strong storms with the potential to generate heavy rainfall.

The National Hurricane Center noted, “Cristina has become better organized during the past several hours. A curved band wraps almost completely around the center, and a ragged eye has occasionally been apparent in satellite images.”

At 5 a.m. EDT (0900 UTC) on July 10, the center of Tropical Storm Cristina was located near latitude 18.8 degrees north and longitude 113.0 degrees west. Cristina is far from land and about 345 miles (560 km) southwest of the southern tip of Baja California. Cristina was moving toward the west-northwest near 12 mph (19 kph) and this general motion with a gradual bend to the west is expected during the next few days. The estimated minimum central pressure was 993 millibars.

Maximum sustained winds are near 70 mph (110 kph) with higher gusts. The National Hurricane Center indicated that Cristina could become a hurricane later today; however, a weakening trend should begin by tonight.

Typhoons/hurricanes are the most powerful weather events on Earth. NASA’s expertise in space and scientific exploration contributes to essential services provided to the American people by other federal agencies, such as hurricane weather forecasting.

For updated forecasts, visit: www.nhc.noaa.gov
By Rob Gutro
NASA’s Goddard Space Flight Center

Fay – Atlantic Ocean

July 10, 2020 (part 2)- NASA’s AIRS Monitors Tropical Storm Fay as It Deluges the East Coast

Tropical Storm Fay is sweeping across New England, with the center of the storm making landfall about 10 miles (15 kilometers) north-northeast of Atlantic City, New Jersey, at around 5 p.m. local time. At that time, Fay had maximum sustained winds of around 50 mph (85 kph). Forecasters predicted the storm will dump up to 7 inches (18 centimeters) of rain along its path from Delaware into New Jersey.

AIRS image of Fay
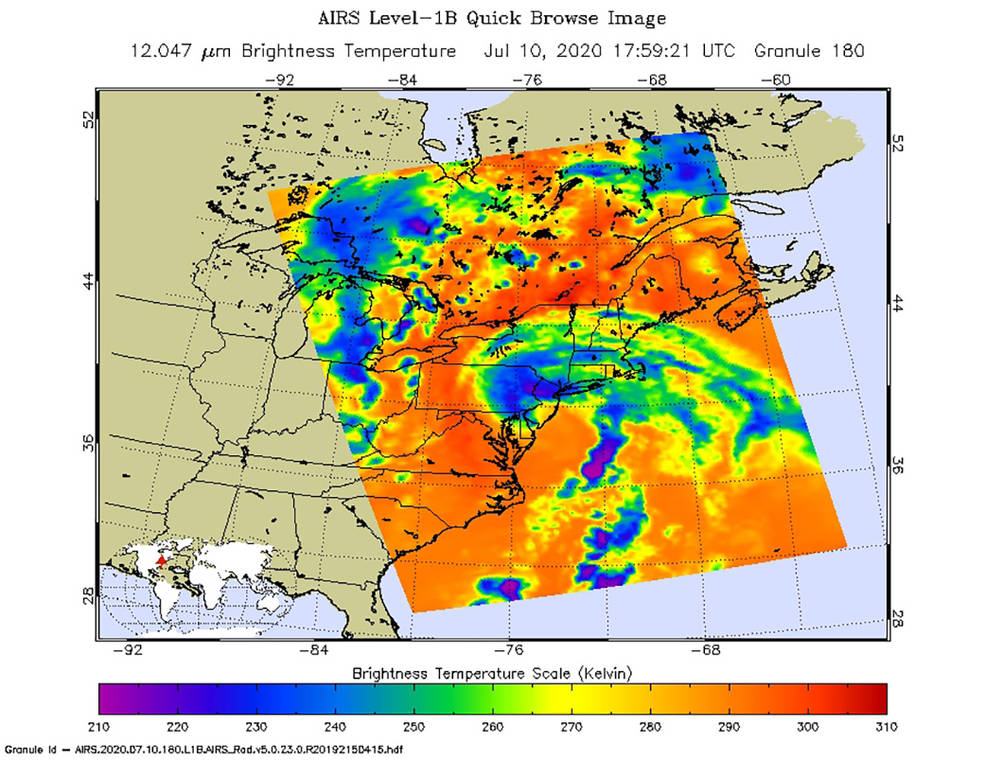
NASA’s AIRS instrument captured this image of Tropical Storm Fay around 2 p.m. local time on July 10, 2020, as the storm swept through New England.
Credits: NASA/JPL-Caltech

NASA’s Atmospheric Infrared Sounder (AIRS) collected this image at around 2 p.m. local time on Friday, July 10. The purple regions indicate very cold clouds lofted high into the atmosphere by the storm and generally linked to heavy rainfall. Warmer clouds closer to the ground show up as green and blue, while the orange areas denote mostly cloud-free parts of the sky.

AIRS, together with the Advanced Microwave Sounding Unit (AMSU), measures the infrared and microwave radiation emitted from Earth to study the planet’s weather and climate. Both instruments observe Earth from NASA’s Aqua satellite, which launched in 2002.

AIRS and AMSU work in tandem to make simultaneous observations down to Earth’s surface, even in the presence of heavy clouds. With more than 2,000 channels sensing different regions of the atmosphere, the system creates a global, three-dimensional map of atmospheric temperature and humidity, cloud amounts and heights, greenhouse gas concentrations, and many other atmospheric phenomena. The AIRS and AMSU instruments are managed by NASA’s Jet Propulsion Laboratory in Southern California under contract with NASA. JPL is a division of Caltech.

More information about AIRS can be found at: https://airs.jpl.nasa.gov/

Jane J. Lee / Ian J. O’Neill
Jet Propulsion Laboratory, Pasadena, Calif.
818-354-0307 / 818-354-2649
jane.j.lee@jpl.nasa.gov / ian.j.oneill@jpl.nasa.gov

2020-134

Fay – Atlantic Ocean

July 10, 2020 – NASA Tracks Tropical Storm Fay’s Development and Strongest Side

NASA used satellite data to create an animation of Fay’s development and progression over the past few days, showing how the storm organized into a tropical storm. Additionally, NASA’s Aqua satellite used infrared light to find the location of the strongest storms in Tropical Storm Fay occurring in the northeastern quadrant of the storm, mostly over the Atlantic Ocean.

MODIS image of Fay
On July 10 at 2:55 a.m. EDT (0655 UTC), the MODIS instrument aboard NASA’s Aqua satellite gathered temperature information about Tropical Storm Fay’s cloud tops. MODIS found powerful thunderstorms where temperatures were as cold as or colder than minus 63 degrees Fahrenheit (minus 53 Celsius) mostly over the western Atlantic Ocean and over parts of coastal Delaware and southern New Jersey. Credit: NASA/NRL

Tropical Storm Fay was officially named as the sixth tropical storm the Atlantic Ocean Hurricane Season by 5 p.m. EDT on July 9. The storm formed just off the North Carolina coast. For several days before that, forecasters were using satellite data to track the storm as it developed.

Animating the Development of Fay

Previously designated as System 98L, the low-pressure area formed off the Georgia coast and moved north. At NASA’s Goddard Space Flight Center in Greenbelt, Md. NASA Worldview was used to create an animation of visible imagery of the storm using data from NASA-NOAA Suomi NPP satellite. The animation showed the development and progression of System 98L into Tropical Storm Fay from July 6 to July 9.

NASA’s Earth Observing System Data and Information System (EOSDIS) Worldview application provides the capability to interactively browse over 700 global, full-resolution satellite imagery layers and then download the underlying data. Many of the available imagery layers are updated within three hours of observation, essentially showing the entire Earth as it looks “right now.” Worldview is a tool that can be used to generate satellite imagery and animations.


NASA Worldview was used to create an animation of visible imagery from the NASA-NOAA Suomi NPP satellite was animated and showed the development and progression of System 98L into Tropical Storm Fay from July 6 to July 9. Image Courtesy: NASA Worldview, Earth Observing System Data and Information System (EOSDIS).

NASA Analyzing Fay in Infrared Light

On July 10 at 2:55 a.m. EDT (0655 UTC), the Moderate Resolution Imaging Spectroradiometer or MODIS instrument aboard NASA’s Aqua satellite gathered temperature information about Tropical Storm Fay’s cloud tops. MODIS found powerful thunderstorms where temperatures were as cold as or colder than minus 63 degrees Fahrenheit (minus 53 Celsius) mostly over the western Atlantic Ocean and along coastal areas of Delaware and southern New Jersey. Cloud top temperatures that cold indicate strong storms with the potential to generate heavy rainfall.

Warnings and Watches on July 9

At 8 a.m. EDT (1200 UTC), the National Hurricane Center (NHC) noted a Tropical Storm Warning is in effect for Fenwick Island, Delaware to Watch Hill, Rhode Island including Long Island and Long Island Sound, as well as Southern Delaware Bay. A Tropical Storm Warning means that tropical storm conditions are expected somewhere within the warning area.

What to Expect from Fay

The National Hurricane Center noted that in addition to tropical-storm force winds, storm surge and a possibility for isolated tornadoes, Fay is expected to produce heavy rainfall. “Fay is forecast to generate 2 to 4 inches of rain with isolated maxima of 7 inches along and near the track from the lower Maryland Eastern Shore and Delaware northward into New Jersey, eastern Pennsylvania, southeast New York, and southern New England. These rains may result in flash flooding where the heaviest amounts occur.”

Fay’s Status on July 9

At that time the NHC reported the center of Tropical Storm Fay was located by an Air Force Reserve Hurricane Hunter aircraft near latitude 37.6 degrees north and longitude 74.7 degrees west. Fay was centered about 55 miles (85 km) south-southeast of Ocean City, Md.  Fay is moving toward the north near 10 mph (17 kph). A northward to north-northeastward motion at a faster forward speed is expected over the next couple of days.

Maximum sustained winds are near 50 mph (85 kph) with higher gusts. Little change in strength is forecast today and tonight while the center remains over water. Weakening should begin after the center moves inland. The estimated minimum central pressure based on aircraft data is 999 millibars.

A Weatherflow station at Lewes, Delaware recently reported a sustained wind of 33 mph (54 kph) and a wind gust of 39 mph (63 kph).

Fay’s Forecast Track

NHC forecasters expect the center of Fay to move near the mid-Atlantic coast today and move inland over the mid-Atlantic or the northeast United States late tonight or on Saturday.

Typhoons/hurricanes are the most powerful weather events on Earth. NASA’s expertise in space and scientific exploration contributes to essential services provided to the American people by other federal agencies, such as hurricane weather forecasting.

By Rob Gutro
NASA’s Goddard Space Flight Center

Cristina – Eastern Pacific Ocean

July 09, 2020 – NASA Sees Storms Wrapping Around Tropical Cyclone Cristina

The analysis of Tropical Cyclone Cristina’s cloud top temperatures revealed some bands of thunderstorms were developing and wrapping around the center of the storm’s circulation.

AIRS image of Cristina
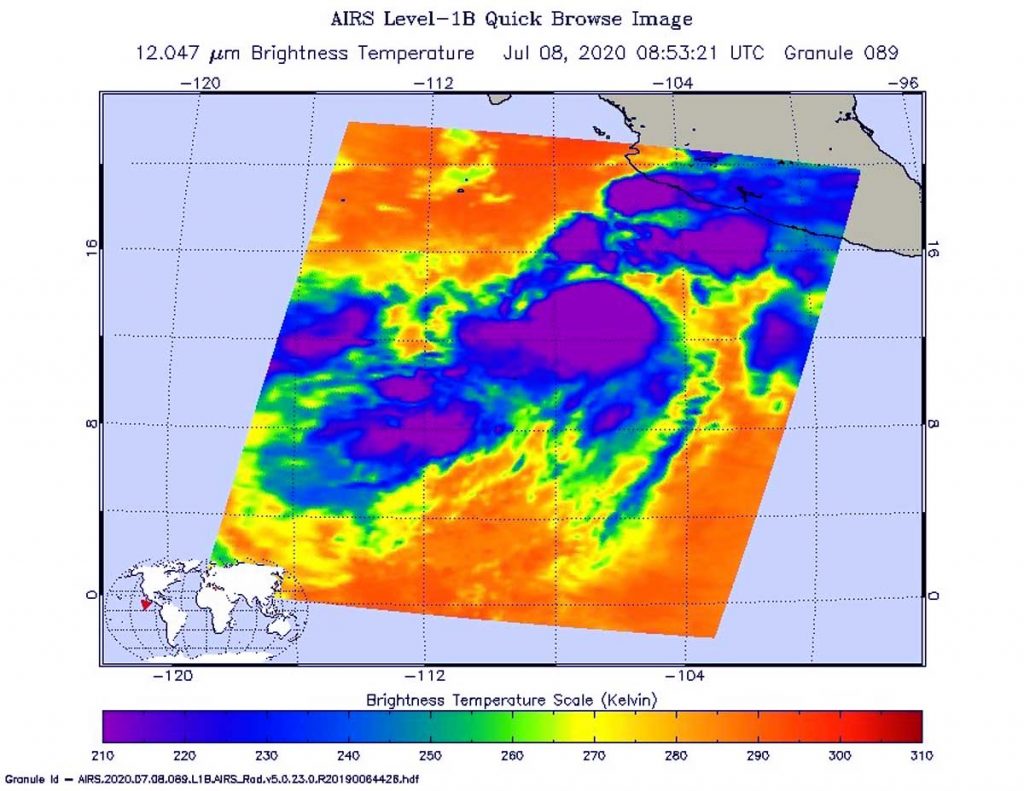
On June 8 at 4:20 p.m. EDT (2020 UTC) NASA’s Aqua satellite analyzed Tropical Storm Cristina using the Atmospheric Infrared Sounder or AIRS instrument. AIRS found coldest cloud top temperatures as cold as or colder than (purple) minus 63 degrees Fahrenheit (minus 53 degrees Celsius). Credit: NASA JPL/Heidar Thrastarson

Banding thunderstorms are generally an indication that a tropical cyclone is getting more organized.

How Tropical Cyclones Form

Tropical cyclones are like giant engines that use warm, moist air as fuel. The warm, moist air over the ocean rises upward from near the surface. As the warm air rises, it causes an area of lower air pressure near the surface. Air from surrounding areas with higher air pressure pushes in to the low-pressure area. Then that “new” air becomes warm and moist and rises, too. As the warm air continues to rise, the surrounding air swirls in to take its place. As the warmed, moist air rises and cools off, the water in the air forms clouds. The whole system of clouds and wind spins and grows, fed by the ocean’s heat and water evaporating from the surface.

NASA Uses Infrared Light to Analyze Storms

One of the ways NASA researches tropical cyclones is by using infrared data that provides temperature information. Cloud top temperatures provide information to forecasters about where the strongest storms are located within a tropical cyclone (which are made of hundreds of thunderstorms).

Tropical cyclones do not always have uniform strength. Some quadrants of a tropical cyclone contain more powerful thunderstorms than other quadrants. Temperature data indicates where those strongest storms are located. The stronger the storms, the higher they extend into the troposphere, and the colder the cloud temperatures.

On June 8 at 4:20 p.m. EDT (2020 UTC) NASA’s Aqua satellite analyzed the storm using the Atmospheric Infrared Sounder or AIRS instrument. AIRS found temperatures as cold as or colder than minus 63 degrees Fahrenheit (minus 53 degrees Celsius). NASA research has shown that cloud top temperatures that cold indicate strong storms that have the capability to create heavy rain.

Those cold temperatures were found around the center and in a developing band of thunderstorms northeast of the center. Satellite data showed the center was located underneath the northeastern side of the main area of convection due to moderate vertical wind shear. The AIRS image also showed banding features were developing across the northern portion of the circulation. One band of thunderstorms northeast of center brought rainfall to part of the coast of southwestern Mexico.

Cristina’s Status on July 9, 2020

Overnight from July 8 to July 9 although deep convection and strong thunderstorm development had been increasing, the overall cloud pattern and structure of the storm changed little and it continued to lack banding features.

At 5 a.m. EDT (0900 UTC) on July 9, the center of Tropical Storm Cristina was located near latitude 16.8 degrees north and longitude degrees 109.4 west. That is about 370 miles (590 km) west-southwest of Manzanillo Mexico. The estimated minimum central pressure is 995 millibars.

NOAA’s National Hurricane Center (NHC) said Cristina was moving toward the west-northwest near 12 mph (19 kph), and this motion with an increase in forward speed is expected during the next few days. On the forecast track, Cristina will remain well offshore of the coast of Mexico.

Maximum sustained winds were near 65 mph (100 kph) with higher gusts.  Some strengthening is forecast and Cristina could become a hurricane by Friday.

Tropical cyclones/hurricanes are the most powerful weather events on Earth. NASA’s expertise in space and scientific exploration contributes to essential services provided to the American people by other federal agencies, such as hurricane weather forecasting.

The AIRS instrument is one of six instruments flying on board NASA’s Aqua satellite, launched on May 4, 2002.

For updated forecasts, visit: www.nhc.noaa.gov
By Rob Gutro
NASA’s Goddard Space Flight Center  

Cristina – Eastern Pacific Ocean

July 08, 2020 – NASA Analyzes Tropical Cyclone Cristina’s Water Vapor Concentration

When NASA’s Aqua satellite passed over Tropical Storm Cristina in the Eastern Pacific Ocean on July 8, it gathered water vapor data that provided information about the intensity of the storm.

Aqua image of Cristina
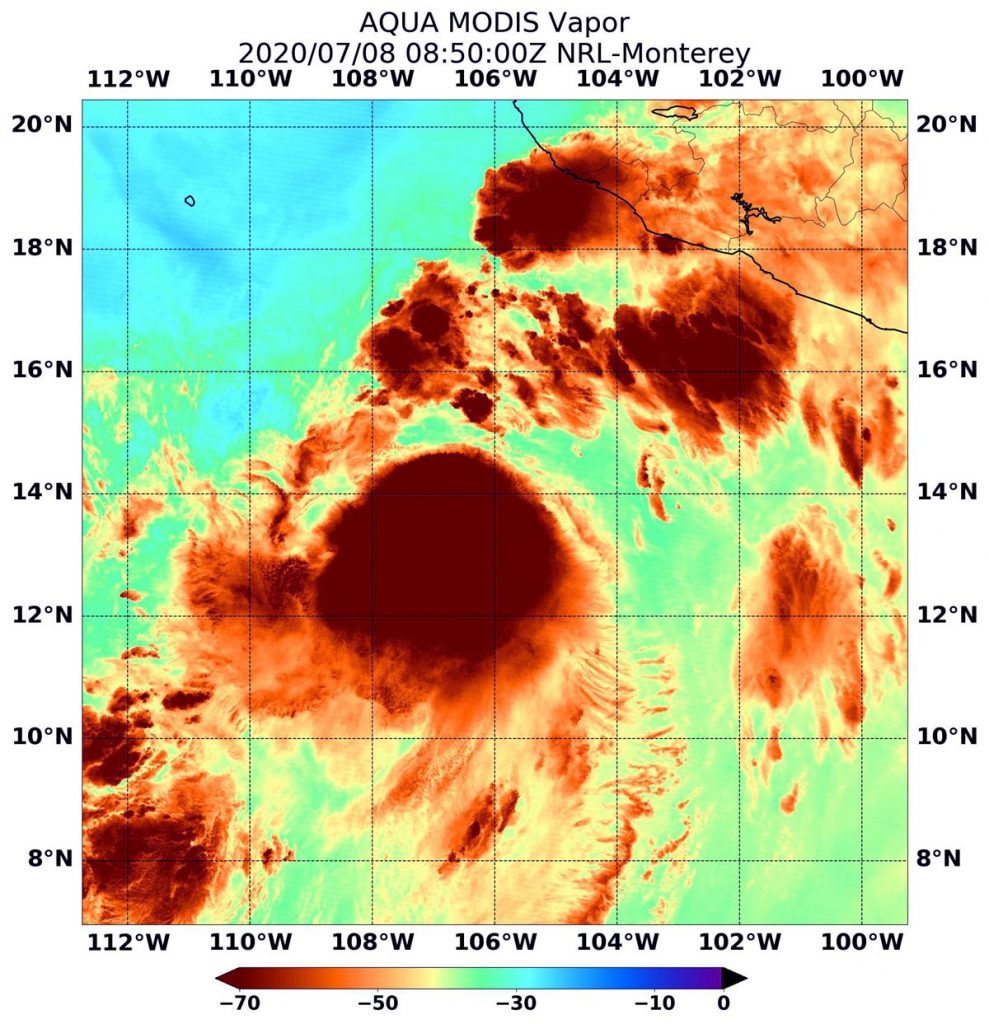
On July 8 at 4:50 a.m. EDT (0850 UTC) NASA’s Aqua satellite passed over Tropical Cyclone Cristina, located in the Eastern Pacific Ocean. Aqua found highest concentrations of water vapor (brown) and coldest cloud top temperatures were around the center. Credits: NASA/NRL

NASA’s Aqua satellite passed over Cristina at 4:50 a.m. EDT (0850 UTC) and the Moderate Resolution Imaging Spectroradiometer or MODIS instrument gathered water vapor content and temperature information. The MODIS image showed highest concentrations of water vapor and coldest cloud top temperatures were around the center of circulation. MODIS data also showed coldest cloud top temperatures were as cold as or colder than minus 70 degrees Fahrenheit (minus 56.6 degrees Celsius) in those storms. Storms with cloud top temperatures that cold have the capability to produce heavy rainfall.

Water vapor analysis of tropical cyclones tells forecasters how much potential a storm has to develop. Water vapor releases latent heat as it condenses into liquid. That liquid becomes clouds and thunderstorms that make up a tropical cyclone. Temperature is important when trying to understand how strong storms can be. The higher the cloud tops, the colder and the stronger the storms.

The National Hurricane Center noted that satellite images show that the convective organization of Cristina is gradually improving, while bands of thunderstorms are developing across the northern portion of the circulation. The center of Cristina’s circulation was still under the northeastern side of the main area of convection due to moderate vertical wind shear, but that wind shear appears to be diminishing.

On July 8 at 11 a.m. EDT (1500 UTC), the center of Tropical Storm Cristina was located near latitude 14.6 degrees north and longitude 106.9 degrees west. That is about 350 miles (560 km) south-southwest of Manzanillo, Mexico.

Cristina is moving toward the northwest near 12 mph (19 kph). A turn to the west-northwest is expected by tonight, and that motion is expected to continue for the next few days. On the forecast track, the cyclone will remain well offshore the coast of Mexico. The estimated minimum central pressure is 998 millibars.

Maximum sustained winds are near 60 mph (95 kph) with higher gusts. Gradual strengthening is expected over the next couple of days, and Cristina is forecast to become a hurricane on Thursday.

National Hurricane Center forecaster Andrew Latto noted, “The decreasing shear over Cristina combined with warm sea surface temperatures and a moist air mass should allow the cyclone to intensify over the next couple of days.”

NASA’s Aqua satellite is one in a fleet of NASA satellites that provide data for hurricane research.

Tropical cyclones/hurricanes are the most powerful weather events on Earth. NASA’s expertise in space and scientific exploration contributes to essential services provided to the American people by other federal agencies, such as hurricane weather forecasting.

By Rob Gutro
NASA’s Goddard Space Flight Center

Cristina – Eastern Pacific Ocean

July 07, 2020 – NASA Finds Powerful Storm’s Around Tropical Storm Cristina’s Center   

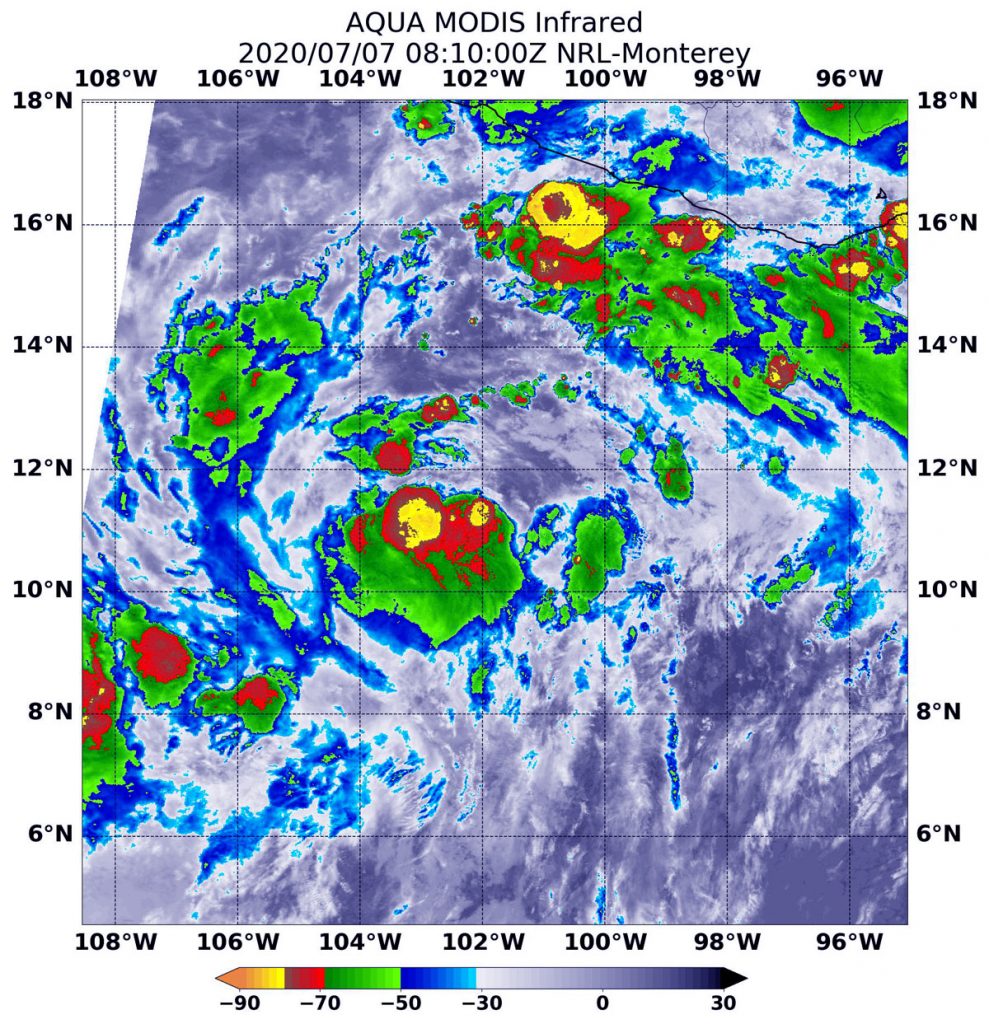
A low-pressure area strengthened quickly and became Tropical Storm Cristina in the Eastern Pacific Ocean and infrared imagery from NASA revealed the powerful thunderstorms fueling that intensification.

Aqua image of Cristina
On July 7 at 4:10 a.m. EDT (0810 UTC) the MODIS instrument that flies aboard NASA’s Aqua satellite revealed two areas of very powerful thunderstorms (yellow) around Cristina’s center where cloud top temperatures were as cold as minus 80 degrees Fahrenheit (minus 62.2 Celsius). Credit: NASA/NRL

Cristina developed by 5 p.m. EDT on Monday, July 6, according to the National Hurricane Center in Miami, Fla. Six hours later it strengthened into a tropical storm and was renamed Cristina.

On July 7 at 4:10 a.m. EDT (0810 UTC), the Moderate Resolution Imaging Spectroradiometer or MODIS instrument that flies aboard NASA’s Aqua satellite used infrared light to analyze the strength of storms within Cristina. NASA researches these storms to determine how they rapidly intensify, develop and behave.

Tropical cyclones are made of up hundreds of thunderstorms, and infrared data can show where the strongest storms are located. That is because infrared data provides temperature information, and the strongest thunderstorms that reach highest into the atmosphere have the coldest cloud top temperatures.

MODIS found those strongest storms in two areas around Cristina’s center of circulation where cloud top temperatures were as cold as minus 80 degrees Fahrenheit (minus 62.2 Celsius). NASA research has found that cloud top temperatures that cold indicate strong storms with the potential to generate heavy rainfall.

At 11 a.m. EDT (1500 UTC) on July 7, the National Hurricane Center (NHC) said the center of Tropical Storm Cristina was located near latitude 12.2 degrees north and longitude 102.8 degrees west. Cristina is centered about 480 miles (770 km) south-southeast of Manzanillo, Mexico. The estimated minimum central pressure is 1005 millibars. Maximum sustained winds are near 40 mph (65 kph) with higher gusts.

Cristina was moving toward the west-northwest near 13 mph (20 kph), and the NHC expects that general motion to continue for the next few days, keeping the cyclone well away from the coast of Mexico.

NHC forecaster David Zelinsky noted in the July 7 Discussion, “The [vertical wind] shear and some nearby dry air that appear to have inhibited Cristina’s organization so far are not expected to persist as negative factors for much longer. All of the models still forecast strengthening, and given the very favorable environment that the cyclone will encounter in a day or two, a period of rapid intensification at some point would not be surprising.”

Strengthening is anticipated and Cristina is forecast to become a hurricane in a day or two.

Typhoons/hurricanes are the most powerful weather events on Earth. NASA’s expertise in space and scientific exploration contributes to essential services provided to the American people by other federal agencies, such as hurricane weather forecasting.

For updated forecasts, visit: www.nhc.noaa.gov
By Rob Gutro
NASA’s Goddard Space Flight Center

Edouard – Atlantic Ocean

July 07, 2020 – Edouard Now Post-Tropical in NASA-NOAA Satellite Imagery

When NASA-NOAA’s Suomi NPP satellite passed over the western North Atlantic Ocean on July 6, it provided forecasters with a visible image of Edouard after it transitioned into a post-tropical cyclone.

Suomi NPP image of Edouard
On July 6, NASA-NOAA’s Suomi NPP satellite provided a visible image of Post-Tropical Cyclone Edouard merging with a frontal boundary in the Northern Atlantic Ocean. Credit: NASA Worldview, Earth Observing System Data and Information System (EOSDIS)

The National Hurricane Center (NHC) defines a post-tropical cyclone as a former tropical cyclone. This generic term describes a cyclone that no longer possesses sufficient tropical characteristics to be considered a tropical cyclone. Post-tropical cyclones can continue carrying heavy rains and high winds. Two classes of post-tropical cyclones include extratropical and remnant lows.

The Visible Infrared Imaging Radiometer Suite (VIIRS) instrument aboard Suomi NPP provided a visible image that showed Edouard’s center of circulation has merged with a frontal boundary. Therefore, the system was classified as extratropical.

On July 6 at 5 p.m. EDT (2100 UTC), NOAA’s National Hurricane Center (NHC) said that Edouard had become post-tropical. At that time, the center of Post-Tropical Cyclone Edouard was located near latitude 42.7 degrees north and longitude 46.0 degrees west. It was centered about 445 miles (715 km) southeast of Cape Race Newfoundland, Canada. The post-tropical cyclone was moving quickly toward the northeast near 38 mph (61 kph). Maximum sustained winds are near 45 mph (75 kph) with higher gusts. The estimated minimum central pressure is 1005 millibars.

The National Hurricane Center forecast said the post-tropical cyclone is forecast to continue moving quickly northeastward for the next day or so until it is absorbed into a larger frontal zone over the north Atlantic late today, July 7 or early Wednesday.

Tropical cyclones/hurricanes are the most powerful weather events on Earth. NASA’s expertise in space and scientific exploration contributes to essential services provided to the American people by other federal agencies, such as hurricane weather forecasting.

By Rob Gutro 
NASA’s Goddard Space Flight Center