Sep. 30, 2020 – NASA Confirms, Heavy Rainfall, Strengthening of Tropical Storm Marie
Tropical Storm Marie has formed in the Eastern Pacific Ocean and NASA satellite data helped confirm the strengthening of the storm. In addition, using a NASA satellite rainfall product that incorporates data from satellites and observations, NASA estimated Marie’s rainfall rates the provided more clues about intensification.
Tropical Depression 18E formed on Sept. 29 by 5 p.m. EDT well southwest of the southwestern coast of Mexico. Twelve hours later the depression strengthened into a tropical storm and renamed Marie.
Marie’s Status on Sept. 30
At 11 a.m. EDT (1500 UTC), the center of Tropical Storm Marie was located near latitude 14.2 degrees north and longitude 113.8 degrees west. Marie is located about 655 miles (1,050 km) south-southwest of the southern tip of Baja California, Mexico and is moving toward the west near 16 mph (26 kph).
A westward to west-northwestward motion is expected through Friday. Maximum sustained winds have increased to near 65 mph (100 kph) with higher gusts. The estimated minimum central pressure is 997 millibars.
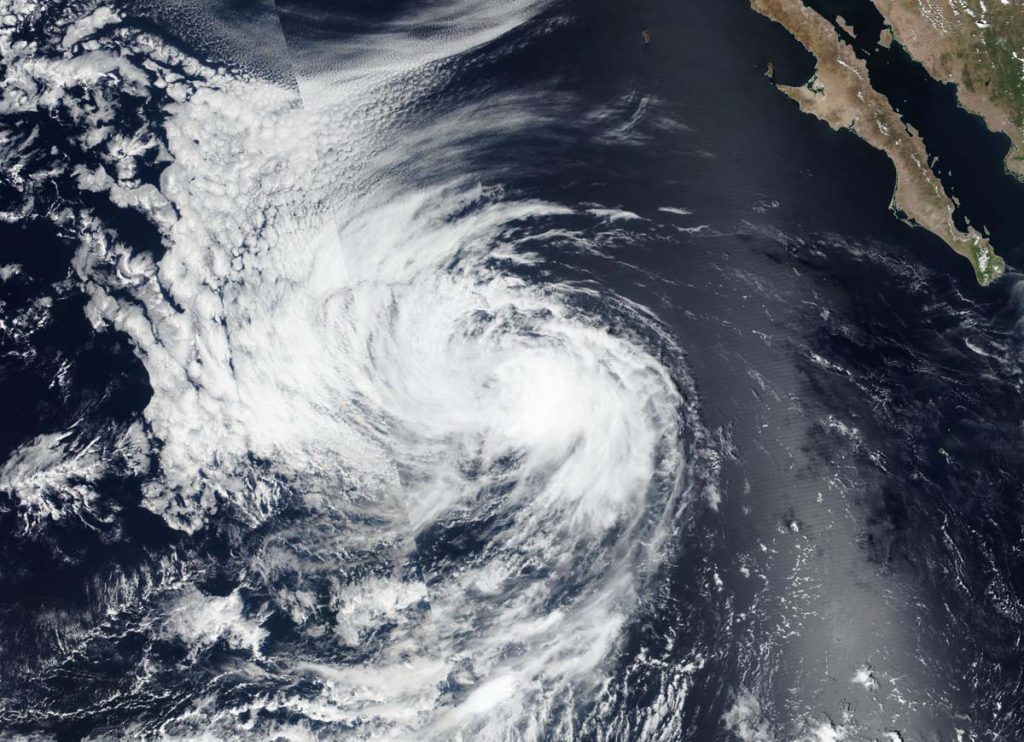
Estimating Marie’s Rainfall Rates from Space
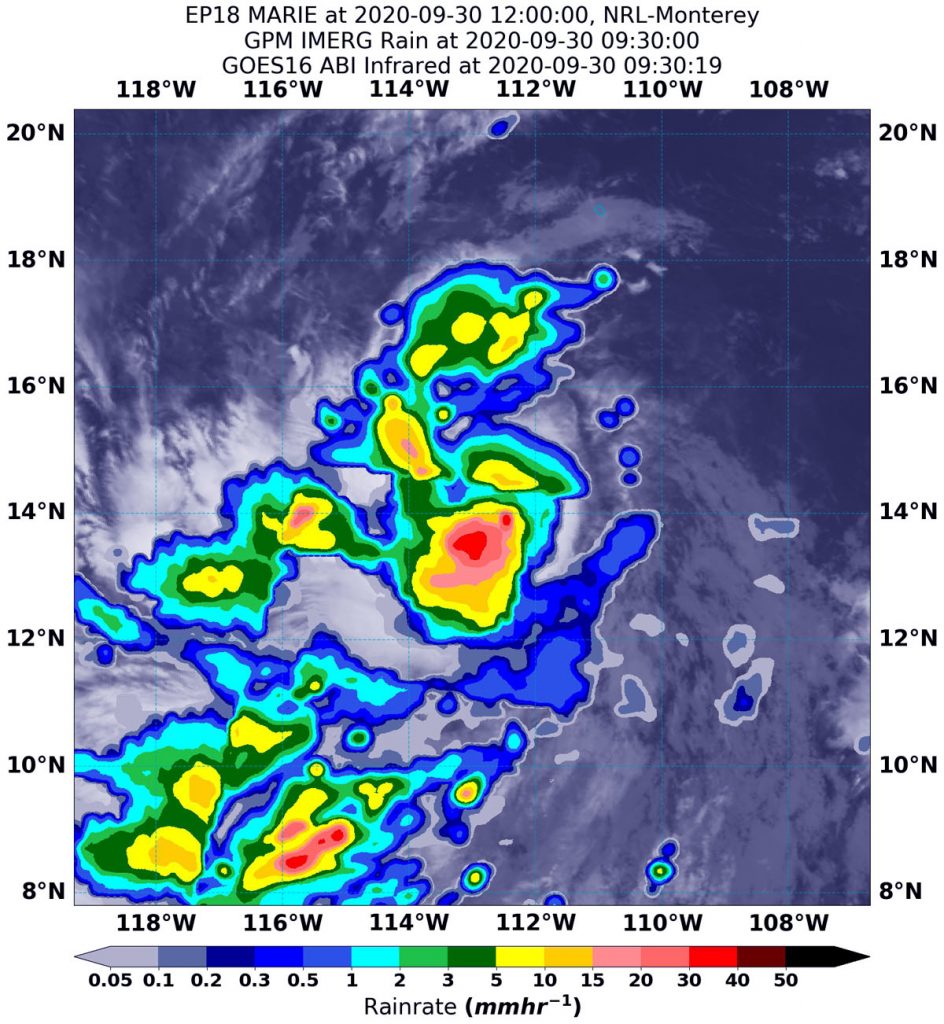
NASA’s Integrated Multi-satellitE Retrievals for GPM or IMERG, which is a NASA satellite rainfall product, estimated on Sept. 30 at 5:30 a.m. EDT (0930 UTC) that Tropical Storm Marie was generating as much as 30 to 40 mm (1.2 to 1.6 inches) of rain around the center of circulation. That heavy rainfall near the center is suggestive of hot towering thunderstorms.
A “hot tower” is a tall cumulonimbus cloud that reaches at least to the top of the troposphere, the lowest layer of the atmosphere. It extends approximately 9 miles/14.5 km high in the tropics. These towers are called “hot” because they rise to such altitude due to the large amount of latent heat. Water vapor releases this latent heat as it condenses into liquid. Those towering thunderstorms have the potential for heavy rain. NASA research shows that a tropical cyclone with a hot tower in its eyewall was twice as likely to intensify within six or more hours, than a cyclone that lacks a hot tower.
Rainfall throughout most of the storm and in bands of thunderstorms west of the center was occurring at a rate of between 2 and 15 mm (0.08 to 0.6 inches) per hour.
At the U.S. Naval Laboratory in Washington, D.C., the IMERG rainfall data was overlaid on infrared imagery from NOAA’s GOES-16 satellite to provide the full extent of the storm.
NASA satellite imagery has shown that Marie’s structure has been gradually improving. The National Hurricane Center (NHC) noted that Marie’s center is embedded beneath a central dense overcast feature, and the band of thunderstorms in the western quadrant of the storm has become more pronounced and continuous. In addition, a mid-level eye has begun to form, as observed in microwave satellite data.
What Does IMERG Do?
This near-real time rainfall estimate comes from the NASA’s IMERG, which combines observations from a fleet of satellites, in near-real time, to provide near-global estimates of precipitation every 30 minutes. By combining NASA precipitation estimates with other data sources, we can gain a greater understanding of major storms that affect our planet.
What IMERG does is “morph” high-quality satellite observations along the direction of the steering winds to deliver information about rain at times and places where such satellite overflights did not occur. Information morphing is particularly important over the majority of the world’s surface that lacks ground-radar coverage. Basically, IMERG fills in the blanks between weather observation stations.
How Other NASA Satellites Help Forecasters
Infrared and water vapor data from NASA’s Aqua, Terra and NASA-NOAA’s Suomi NPP satellite were used to help forecasters assess the environment where Marie was headed. Infrared imagery provides temperature information about cloud tops and sea surface environments. Colder cloud tops indicate stronger storms. Sea surface temperature data are also critical for forecasters because tropical cyclones require ocean temperatures of at least 26.6 degrees Celsius (80 degrees Fahrenheit) to maintain intensity. Warmer waters can help with tropical cyclone intensification, while cooler waters can weaken tropical cyclones.
Water vapor analysis of tropical cyclones tells forecasters how much potential a storm has to develop. Water vapor releases latent heat as it condenses into liquid. That liquid becomes clouds and thunderstorms that make up a tropical cyclone. Temperature is important when trying to understand how strong storms can be. The higher the cloud tops, the colder and the stronger the storms.
Marie’s Forecast
NHC Hurricane Specialist Robbie Berg noted, “The stage appears set for Marie to rapidly intensify during the next couple of days. Water vapor imagery indicates that the easterly [wind] shear over the cyclone has continued to decrease and should be generally low for the next 3 days, and upper-level divergence will also be in place during that period to help ventilate the storm. The thermodynamics are also favorable for fast strengthening, highlighted by sea surface temperatures of 28-29 degrees Celsius and plenty of moisture in the surrounding environment. Due to these conditions, the NHC forecast explicitly shows rapid intensification during the next couple of days, with a peak intensity likely occurring sometime between 48 and 60 hours.”
The National Hurricane Center expects rapid strengthening and Marie is expected to become a hurricane this evening or tonight. Marie could then become a major hurricane by late Thursday, Oct. 1.
NASA Researches Tropical Cyclones
Hurricanes/tropical cyclones are the most powerful weather events on Earth. NASA’s expertise in space and scientific exploration contributes to essential services provided to the American people by other federal agencies, such as hurricane weather forecasting.
For more than five decades, NASA has used the vantage point of space to understand and explore our home planet, improve lives and safeguard our future. NASA brings together technology, science, and unique global Earth observations to provide societal benefits and strengthen our nation. Advancing knowledge of our home planet contributes directly to America’s leadership in space and scientific exploration.
For more information about NASA’s IMERG, visit: https://pmm.nasa.gov/gpm/imerg-global-image
For forecast updates on hurricanes, visit: www.hurricanes.gov
By Rob Gutro
NASA’s Goddard Space Flight Center