Delta – Atlantic Ocean

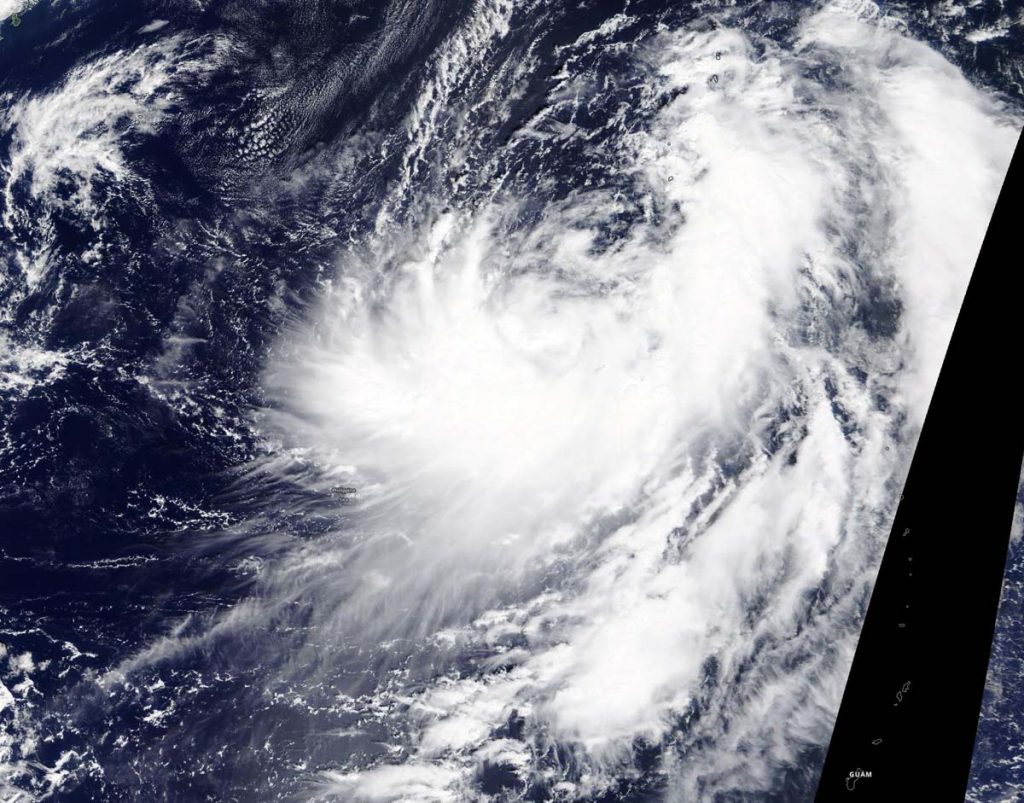
Oct. 07, 2020 – NASA Analyzes Hurricane Delta’s Water Vapor Concentration

When NASA’s Aqua satellite passed over the Caribbean Sea on Oct. 7, it gathered water vapor data on Hurricane Delta as Mexico’s Yucatan continues to feel its effects.

Aqua image of Delta
On Oct. 7 at 2:50 a.m. EDT (0650 UTC), NASA’s Aqua satellite found highest concentrations of water vapor (brown) and coldest cloud top temperatures were around Hurricane Delta’s center. Cloud top temperatures in those storms were as cold as or colder than minus 90 degrees Fahrenheit (minus 67.7 degrees Celsius). Delta was moving over Mexico’s Yucatan Peninsula. Credits: NASA/NRL

Water vapor analysis of tropical cyclones tells forecasters how much potential a storm has to develop. Water vapor releases latent heat as it condenses into liquid. That liquid becomes clouds and thunderstorms that make up a tropical cyclone. Temperature is important when trying to understand how strong storms can be. The higher the cloud tops, the colder and stronger the storms.

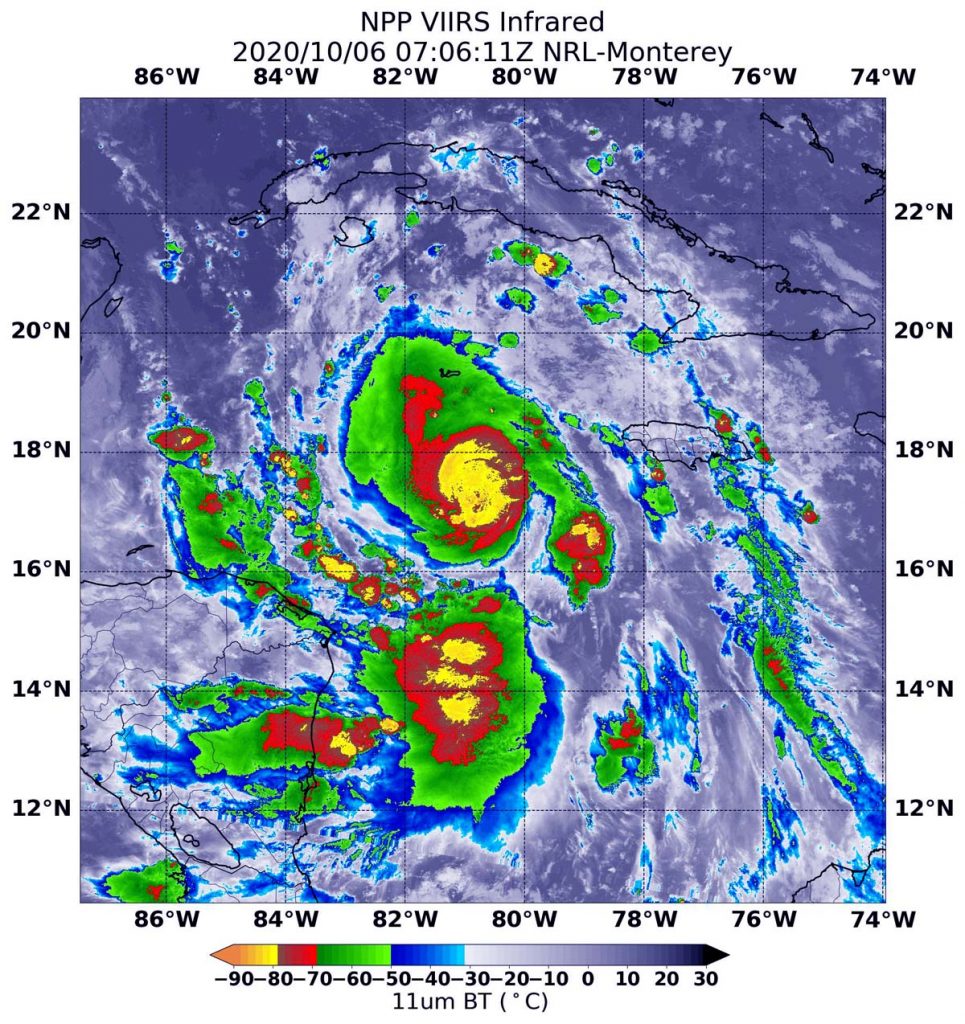
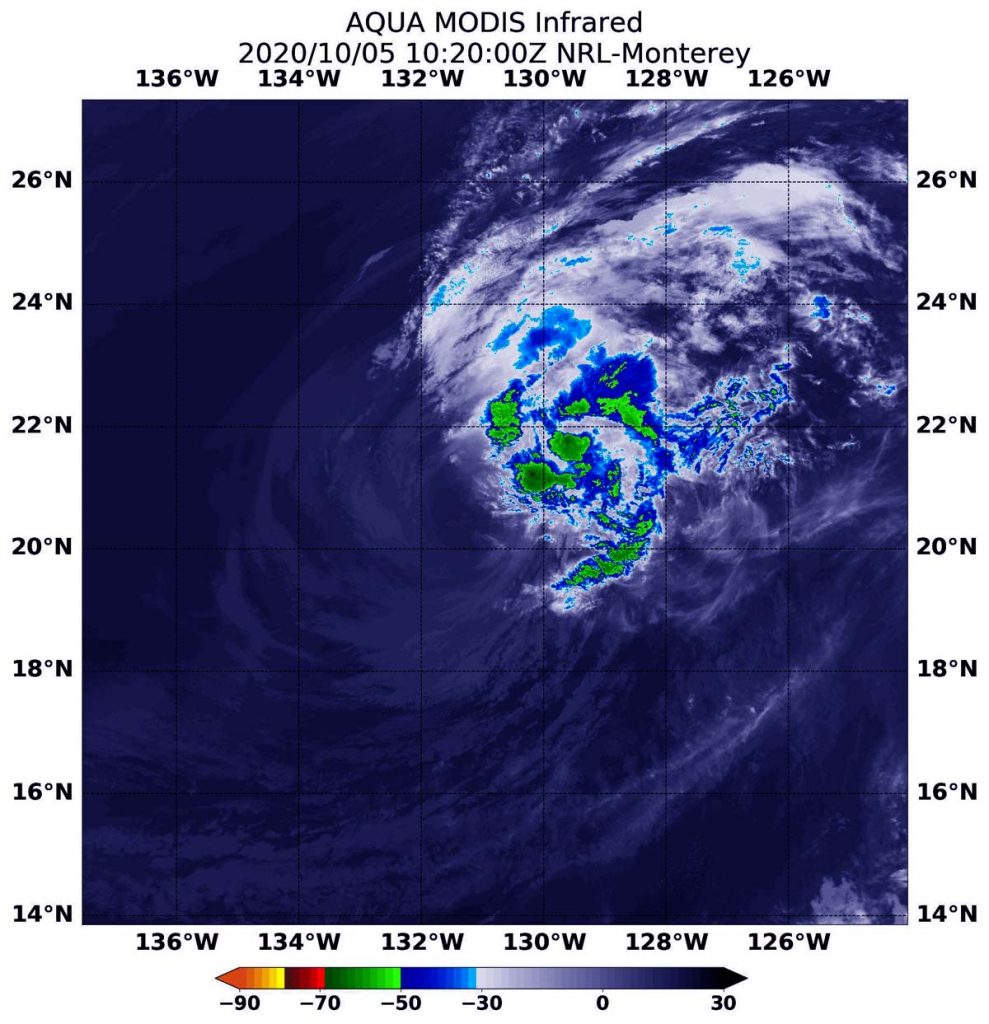
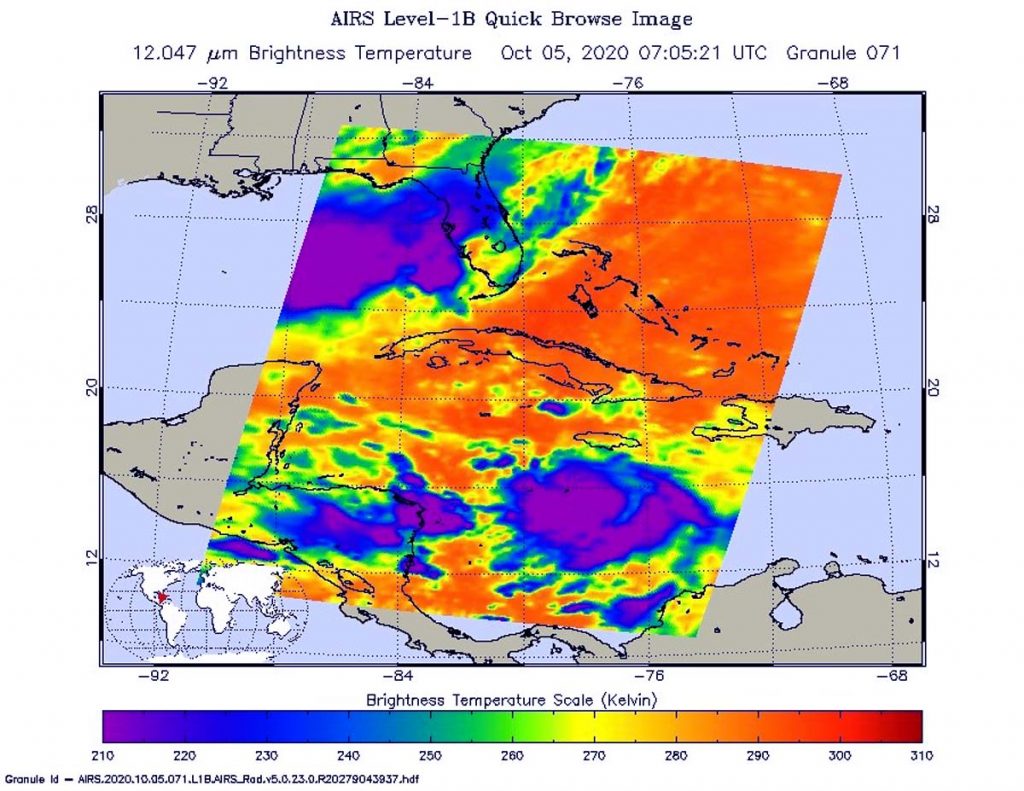
NASA’s Aqua satellite passed over Delta on Oct. 7 at 2:50 a.m. EDT (0650 UTC), and the Moderate Resolution Imaging Spectroradiometer or MODIS instrument gathered water vapor content and temperature information. NASA’s Aqua satellite is one in a fleet of NASA satellites that provide data for hurricane research.

The MODIS image showed highest concentrations of water vapor and coldest cloud top temperatures were around the center of circulation and east of the center. Strongest storms were over the northern Caribbean Sea, between Mexico’s Yucatan Peninsula and western Cuba. MODIS data also showed coldest cloud top temperatures were as cold as or colder than minus 90 degrees Fahrenheit (minus 67.7 degrees Celsius) in those storms. Storms with cloud top temperatures that cold have the capability to produce heavy rainfall.

At 5 a.m. EDT, NHC Senior Hurricane Specialist Eric Blake said, “Satellite images show very deep convection associated with Delta, with extremely cold cloud-top temperatures to minus 97 degrees Celsius noted southwest of the center overnight.  However, this structure has not resulted in a stronger cyclone, and the full NOAA Hurricane Hunter aircraft mission actually indicated that Delta has significantly weakened since earlier today.”

Forecasters at the National Hurricane Center (NHC) noted, “Through early Thursday, Delta is expected to produce 4 to 6 inches of rain, with isolated maximum totals of 10 inches, across portions of the northern Yucatan Peninsula. This rainfall may result in areas of significant flash flooding. In addition, 2 to 4 inches of rain, with isolated higher amounts, are expected across portions of western Cuba. This rainfall may result in areas of flash flooding and mudslides.”

Warnings and Watches on Oct. 7

NHC issued a Hurricane Warning from Tulum to Dzilam, Mexico and for Cozumel. A Tropical Storm Warning is in effect for the Cuban province of Pinar del Rio; from Punta Herrero to Tulum, Mexico; and from Dzilam to Progreso, Mexico.

Delta’s Status on Oct. 7

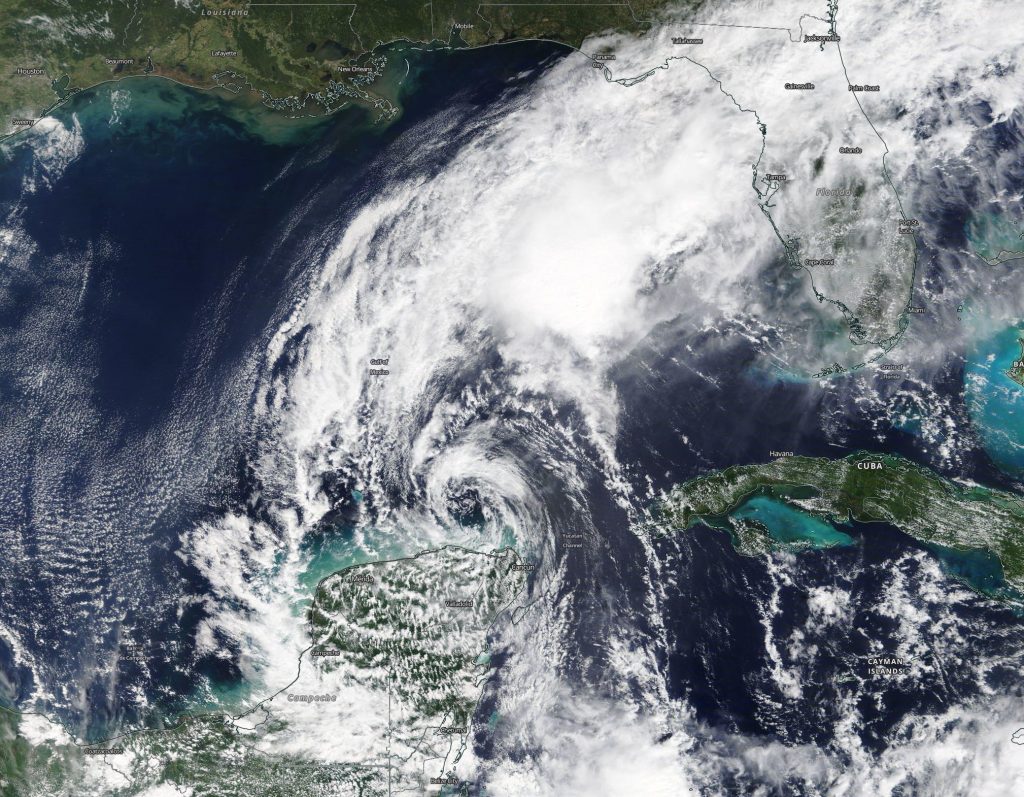
At 8 a.m. EDT (1200 UTC), the NHC said the center of Hurricane Delta was located by satellite images and surface observation inland over northeastern Mexico near latitude 21.1 degrees north and longitude 87.4 degrees west. Delta was centered just 35 miles (55 km) west of Cancun, Mexico.

Delta was moving toward the northwest near 17 mph (28 kph). A west northwestward-to-northwestward motion is expected over the next day or so.  A slower northwestward to north-northwestward motion is forecast to begin on Thursday, and a northward motion is likely Thursday night and Friday. Maximum sustained winds are near 105 mph (165 kph) with higher gusts.  The estimated minimum central pressure based on surface observations is 974 millibars.

Delta’s Forecast Track

NHC forecasters said, “Although some additional weakening is likely when Delta moves over the Yucatan peninsula this morning, re-strengthening is forecast when the hurricane moves over the southern Gulf of Mexico Wednesday night and Thursday, and Delta could become a category 4 hurricane again by late Thursday.  Weakening is expected as Delta approaches the northern Gulf coast on Friday.

On the forecast track, Delta is expected to move over the southern Gulf of Mexico during the afternoon of Oct. 7 and be over the southern or central Gulf of Mexico through Thursday. Delta is expected to approach the northern Gulf coast on Friday, Oct. 9.”

NASA Researches Tropical Cyclones

Hurricanes/tropical cyclones are the most powerful weather events on Earth. NASA’s expertise in space and scientific exploration contributes to essential services provided to the American people by other federal agencies, such as hurricane weather forecasting.

For more than five decades, NASA has used the vantage point of space to understand and explore our home planet, improve lives and safeguard our future. NASA brings together technology, science, and unique global Earth observations to provide societal benefits and strengthen our nation. Advancing knowledge of our home planet contributes directly to America’s leadership in space and scientific exploration.

For NHC’s Key Messages, visit: www.hurricanes.gov

By Rob Gutro
NASA’s Goddard Space Flight Center

Chan-hom – Northwestern Pacific Ocean

Oct. 07, 2020 – NASA Analyzes Rainfall Around Typhoon Chan-hom’s Ragged Eye

A NASA satellite rainfall product that incorporates data from satellites and observations found heavy rainfall occurring throughout Typhoon Chan-hom and the heaviest rainfall in the eyewall. Chan-hom is expected to bring rainfall to Japan on its track through the Northwestern Pacific Ocean.

IMERG data from Chan-hom
On Oct. 7 at 2 a.m. EDT (0600 UTC), NASA’s IMERG estimated Typhoon Chan-hom was generating as much as (30 mm/1.18 inches of rain (dark pink) around the center of circulation. Rainfall throughout most of the storm was occurring between 5 and 15 mm (0.2 to 0.6 inches/yellow and green colors) per hour. The rainfall data was overlaid on infrared imagery from NOAA’s GOES-16 satellite. Credit: NASA/NOAA/NRL

Chan-hom’s Status on Sept. 18

At 5 a.m. EDT (0900 UTC), the center of Typhoon Chan-hom was located near latitude 26.2 degrees north and longitude 134.4 degrees east. It was centered 378 nautical miles east of Kadena Air Base, Okinawa Island, Japan, moving toward the northwest. Maximum sustained winds are near 65 knots (75 mph/120 kph) with higher gusts.

Estimating Chan-hom’s Rainfall Rates from Space

NASA’s Integrated Multi-satellitE Retrievals for GPM or IMERG, which is a NASA satellite rainfall product, estimated on Oct. 7 at 2 a.m. EDT (0600 UTC), Chan-hom was generating as much as 30 mm (1.18 inches) of rain per hour falling in the ragged eyewall that surrounds the eye. Rainfall throughout most of the storm was estimated as falling at a rate between 5 and 15 mm (0.2 to 0.6 inches) per hour. At the U.S. Naval Laboratory in Washington, D.C., the IMERG rainfall data was overlaid on infrared imagery from NOAA’s GOES-16 satellite to provide a full extent of the storm.

In addition to the rainfall calculation within the typhoon, animated enhanced infrared satellite imagery revealed a consolidating system with a ragged eye. Microwave imagery indicates improved banding of thunderstorms wrapping tightly into a microwave eye feature.

Warnings for heavy rainfall are in effect for Kyushu, the southernmost big island of Japan. Watches were posted for much of Japan’s southeastern and east central coasts.

What Does IMERG Do?

This near-real time rainfall estimate comes from the NASA’s IMERG, which combines observations from a fleet of satellites, in near-real time, to provide near-global estimates of precipitation every 30 minutes. By combining NASA precipitation estimates with other data sources, we can gain a greater understanding of major storms that affect our planet.

Instead, what the IMERG does is “morph” high-quality satellite observations along the direction of the steering winds to deliver information about rain at times and places where such satellite overflights did not occur. Information morphing is particularly important over the majority of the world’s surface that lacks ground-radar coverage. Basically, IMERG fills in the blanks between weather observation stations.

Chan-hom’s Forecast

Forecasters at the Joint Typhoon Warning Center (JTWC) expect Chan-hom to track northwestward to northward through the next two days and closer to Japan. Chan-hom is forecast to make a slow track paralleling the coast of Japan from Oct. 8 through the 11, when it is expected to affect Tokyo before heading out to open waters.

JTWC expects Chan-hom to continue weakening over the next several days and begin transitioning to an extra-tropical storm.

NASA Researches Tropical Cyclones

Hurricanes/tropical cyclones are the most powerful weather events on Earth. NASA’s expertise in space and scientific exploration contributes to essential services provided to the American people by other federal agencies, such as hurricane weather forecasting.

For more than five decades, NASA has used the vantage point of space to understand and explore our home planet, improve lives and safeguard our future. NASA brings together technology, science, and unique global Earth observations to provide societal benefits and strengthen our nation. Advancing knowledge of our home planet contributes directly to America’s leadership in space and scientific exploration.

For more information about NASA’s IMERG, visit: https://pmm.nasa.gov/gpm/imerg-global-image

For updated warnings from the Japan Meteorological Agency, visit: https://www.jma.go.jp/en/warn/

By Rob Gutro
NASA’s Goddard Space Flight Center

Norbert – Eastern Pacific Ocean

Oct. 07, 2020 – NASA Finds Dry Air Sapping Tropical Storm Norbert’s Strength

Infrared imagery from NASA’s Aqua satellite revealed that dry air is eroding Tropical Storm Norbert, located off the coast of southwestern Mexico.

Aqua image of Norbert
On Oct. 7 at 4:30 a.m. EDT (0830 UTC), the MODIS instrument aboard NASA’s Aqua satellite gathered temperature information about Norbert’s cloud tops. MODIS found a limited area of powerful thunderstorms (red) around the center where temperatures were as cold as or colder than minus 70 degrees Fahrenheit (minus 56.6 Celsius). Dry air around it was sapping other thunderstorms from developing. Credit: NASA/NRL

Infrared Data Reveals Dry Air Effects

On Oct. 7 at 4:30 a.m. EDT (0830 UTC), the Moderate Resolution Imaging Spectroradiometer or MODIS instrument aboard NASA’s Aqua satellite gathered temperature information about Norbert’s cloud tops. Infrared data provides temperature information, and the strongest thunderstorms that reach high into the atmosphere have the coldest cloud top temperatures.

Dry air suppresses the development of thunderstorms that need warm, moist air to form. Dry air saps the moisture. Tropical cyclones consist of hundreds of thunderstorms. When their development is limited by environmental factors, they have difficulty strengthening and often weaken. The MODIS image showed fragmentation of thunderstorms around Norbert’s center as dry air affected development.

MODIS found that Norbert has weakened as entrainment of dry air has disrupted the compact system. The National Hurricane Center reported that Norbert’s center was partially exposed overnight, but recent infrared imagery shows a new burst of deep convection near the center. MODIS identified that burst of strong thunderstorms in infrared light, where temperatures were as cold as or colder than minus 70 degrees Fahrenheit (minus 56.6 Celsius). Cloud top temperatures that cold indicate strong storms with the potential to generate heavy rainfall.

Norbert’s Status on Oct. 7

At 5 a.m. EDT (0900 UTC), the center of Tropical Storm Norbert was located near latitude 14.0 degrees north and longitude 107.1 degrees west. Norbert is drifting toward the southwest near 1 mph (2 kph). The storm is forecast to meander or remain nearly stationary over the next couple of days.

Satellite-derived wind data indicate that maximum sustained winds have decreased to near 40 mph (65 kph) with higher gusts. Some fluctuations in strength will be possible during the next few days. The estimated minimum central pressure is 1005 millibars.

Norbert’s Future

Forecasters at the National Hurricane Center noted the forecast for Norbert over the next couple of days is challenging. “The intensity forecast for Norbert remains tricky given its small circulation and the presence of dry air in the surrounding environment. Sea-surface temperatures are more than sufficient for at least modest strengthening, but the question will be whether Norbert can survive the increased southeasterly shear that the SHIPS [computer forecast model] guidance calls for during the next 24-48 hours.”

NASA Researches Tropical Cyclones

For more than five decades, NASA has used the vantage point of space to understand and explore our home planet, improve lives and safeguard our future. NASA brings together technology, science, and unique global Earth observations to provide societal benefits and strengthen our nation. Advancing knowledge of our home planet contributes directly to America’s leadership in space and scientific exploration.

For updated forecasts, visit: www.nhc.noaa.gov

By Rob Gutro
NASA’s Goddard Space Flight Center

Chan-hom – Northwestern Pacific Ocean

Oct. 06, 2020 – Infrared NASA Imagery Finds Chan-hom Organizing, Consolidating

NASA’s Aqua satellite analyzed the large Tropical Storm Chan-hom as it tracked through the Northwestern Pacific Ocean. Aqua imagery showed the storm was consolidating, indicating a strengthening trend.

AIRS image of Chan-hom
On Oct. 6 at 0353 UTC (Oct. 5 at 11:53 p.m. EDT) NASA’s Aqua satellite analyzed Tropical Storm Chan-hom using the Atmospheric Infrared Sounder or AIRS instrument. AIRS found coldest cloud top temperatures as cold as or colder than (purple) minus 63 degrees Fahrenheit (minus 53 degrees Celsius) around the consolidating center. Credit: NASA JPL/Heidar Thrastarson

One of the ways NASA researches tropical cyclones is using infrared data that provides temperature information. The AIRS instrument aboard NASA’s Aqua satellite captured a look at those temperatures in Chan-hom and gave insight into the size of the storm and its rainfall potential.

Cloud top temperatures provide information to forecasters about where the strongest storms are located within a tropical cyclone. The stronger the storms, the higher they extend into the troposphere, and the colder the cloud top temperatures. NASA provides that data to forecasters at the Joint Typhoon Warning Center so they can incorporate it into their forecasting.

On Oct. 6 at 0353 UTC (Oct. 5 at 11:53 p.m. EDT) NASA’s Aqua satellite analyzed Tropical Storm Chan-hom using the Atmospheric Infrared Sounder or AIRS instrument. Forecasters at the Joint Typhoon Warning Center (JTWC) in Honolulu, Hawaii noted that animated enhanced infrared satellite imagery showed the system is consolidating.  JTWC noted there has been an improvement in the developing strong bands of thunderstorms wrapping into the low-level center.

AIRS found coldest cloud top temperatures as cold as or colder than minus 63 degrees Fahrenheit (minus 53 degrees Celsius) around the center of circulation. NASA research has shown that cloud top temperatures that cold indicate strong storms that have the capability to create heavy rain.

Despite the consolidation, a microwave image captured at 7:36 a.m. EDT (1136 UTC) indicated that the convective banding remains fragmented.

Chan-hom’s Status on Oct. 6

By 11 a.m. EDT (1500 UTC) on Oct. 6, Chan-hom was located near latitude 24.5 degrees north and longitude 137.2 degrees east. It is located approximately 552 nautical miles east-southeast of Kadena Air Base, Okinawa, Japan. It was moving to the west and had maximum sustained winds near 55 knots (63 mph/102 kph).

Chan-hom’s Forecast

Chan-hom is forecast to continue consolidating and organizing while it tracks generally to the northwest. It is expected to peak at typhoon strength in two days before weakening again.

About NASA’s AIRS Instrument

The AIRS instrument is one of six instruments flying on board NASA’s Aqua satellite, launched on May 4, 2002.

AIRS, in conjunction with the Advanced Microwave Sounding Unit (AMSU), senses emitted infrared and microwave radiation from Earth to provide a three-dimensional look at Earth’s weather and climate. Working in tandem, the two instruments make simultaneous observations down to Earth’s surface. With more than 2,000 channels sensing different regions of the atmosphere, the system creates a global, three-dimensional map of atmospheric temperature and humidity, cloud amounts and heights, greenhouse gas concentrations and many other atmospheric phenomena. Launched into Earth orbit in 2002, the AIRS and AMSU instruments fly aboard NASA’s Aqua spacecraft and are managed by NASA’s Jet Propulsion Laboratory in Southern California, under contract to NASA. JPL is a division of Caltech.

NASA Researches Tropical Cyclones

For more than five decades, NASA has used the vantage point of space to understand and explore our home planet, improve lives and safeguard our future. NASA brings together technology, science, and unique global Earth observations to provide societal benefits and strengthen our nation. Advancing knowledge of our home planet contributes directly to America’s leadership in space and scientific exploration.

More information about AIRS can be found at: https://airs.jpl.nasa.gov/

By Rob Gutro
NASA’s Goddard Space Flight Center

Norbert – Eastern Pacific Ocean

Oct. 06,  2020 – NASA Catches Development of Tropical Storm Norbert as Marie Declines

NASA-NOAA’s Suomi NPP satellite passed over the Eastern Pacific Ocean and captured the birth of a depression that became Tropical Storm Norbert while Marie continued weakening while headed toward the Central Pacific.

Suomi NPP image of Norbert
NASA-NOAA’s Suomi NPP satellite captured a visible image of the development of Tropical Storm Norbert near the coast of southwestern Mexico on Oct. 5 at 5:55 p.m. EDT (2155 UTC). Meanwhile, (top left), Tropical Storm Marie continues tracking toward the Central Pacific Ocean. Credit: NASA Worldview, Earth Observing System Data and Information System (EOSDIS)

Tropical Depression 19E formed well offshore of southwestern Mexico on Oct. 5 and at 5:55 p.m. EDT (2155 UTC) visible imagery from the Visible Infrared Imaging Radiometer Suite (VIIRS) instrument aboard Suomi NPP helped confirm the development. VIIRS showed the low-pressure area had become better defined than it was during the previous day. The image was generated at NASA’s Goddard Space Flight Center in Greenbelt, Md. using the NASA Worldview application.

NOAA’s National Hurricane Center (NHC) noted, “The associated deep convection has also become more organized and convection has persisted over the low-level center since early this morning. In addition, a banding feature has also developed over the western portion of the circulation. Based on these trends, advisories have been initiated for Tropical Depression 19E.”

The same VIIRS visible image also caught a weakening Tropical Storm Marie as it continued toward the Central Pacific Ocean. The Suomi NPP image showed that deep convection and building thunderstorms associated with Marie had all but dissipated and what was left of it was located over 120 nautical miles away from the exposed low-level center of the cyclone (as a result of wind shear).

By 5 a.m. EDT on Oct. 6, Tropical Depression 19E strengthened into a tropical storm and was re-dubbed Norbert. At 11 a.m. EDT, Marie was barely hanging onto tropical storm status and fading quickly.

Norbert’s Status on Oct. 6

At 11 a.m. EDT (1500 UTC) on Oct. 6, the center of Tropical Storm Norbert was located near latitude 14.2 degrees north and longitude 106.6 degrees west. That is 365 miles (585 km) south-southwest of Manzanillo, Mexico. Norbert is moving toward the northwest near 7 mph (11 kph). A slower northwestward motion is expected until tonight. The system is forecast to meander thereafter through midweek. Maximum sustained winds are near 45 mph (75 kph) with higher gusts. Some slow strengthening is possible over the next few days. The estimated minimum central pressure is 1002 millibars.

Marie’s Fading Status of Oct. 6

At 11 a.m. EDT (1500 UTC), the center of Tropical Storm Marie was located near latitude 22.1 degrees north and longitude 135.1 degrees west. Marie is moving toward the west-northwest near 9 mph (15 kph), and this general motion with some decrease in forward speed is expected during the next day or so, followed by a turn toward the west late Wednesday or early Thursday.

Maximum sustained winds have decreased to near 45 mph (75 kph) with higher gusts.  Gradual weakening is forecast during the next 48 hours, and Marie is forecast to become a remnant low-pressure area by tonight and a trough of low pressure in a few days.

About NASA’s Worldview

NASA’s Earth Observing System Data and Information System (EOSDIS) Worldview application provides the capability to interactively browse over 700 global, full-resolution satellite imagery layers and then download the underlying data. Many of the available imagery layers are updated within three hours of observation, essentially showing the entire Earth as it looks “right now.”

NASA Researches Tropical Cyclones

Hurricanes/tropical cyclones are the most powerful weather events on Earth. NASA’s expertise in space and scientific exploration contributes to essential services provided to the American people by other federal agencies, such as hurricane weather forecasting.

For more than five decades, NASA has used the vantage point of space to understand and explore our home planet, improve lives and safeguard our future. NASA brings together technology, science, and unique global Earth observations to provide societal benefits and strengthen our nation. Advancing knowledge of our home planet contributes directly to America’s leadership in space and scientific exploration.

By Rob Gutro 
NASA’s Goddard Space Flight Center

Delta – Atlantic Ocean

Oct. 06, 2020 – NASA-NOAA Satellite Finds Hurricane Delta Rapidly Intensifying

Infrared imagery from NASA-NOAA’s Suomi NPP satellite revealed that Hurricane Delta has been rapidly growing stronger and more powerful. Infrared imagery revealed that powerful thunderstorms circled the eye of the hurricane and southern quadrant as it moved through the Caribbean Sea on Oct. 6.

Suomi NPP image of Delta
On Oct. 6 at 3:06 a.m. EDT (0706 UTC) NASA-NOAA’s Suomi NPP satellite analyzed Hurricane Delta’s cloud top temperatures and found strongest storms (yellow) were around Delta’s center of circulation and in a band of thunderstorms south of the center. Temperatures in those areas were as cold as minus 80 degrees Fahrenheit (minus 62.2 Celsius). Strong storms with cloud top temperatures as cold as minus 70 degrees (red) Fahrenheit (minus 56.6. degrees Celsius) surrounded both of those areas. Credit: NASA/NRL

At 11:20 a.m. EDT on Oct. 6, NOAA’s National Hurricane Center (NHC) received data from a NOAA hurricane hunter aircraft that Delta has rapidly strengthened into a category 4 hurricane.

Infrared Imagery Reveals a More Powerful Delta

One of the ways NASA researches tropical cyclones is by using infrared data which provides temperature information. Cloud top temperatures identify where the strongest storms are located. The stronger the storms, the higher they extend into the troposphere, and the colder the cloud top temperatures.

On Oct. 6 at 3:06 a.m. EDT (0706 UTC) NASA-NOAA’s Suomi NPP satellite analyzed Hurricane Delta’s cloud top temperatures using the Visible Infrared Imaging Radiometer Suite or VIIRS instrument. At the time, Delta was a Category 1 hurricane with maximum sustained winds near 85 mph (140 kph). By 5 a.m. EDT, maximum sustained winds strengthened to 100 mph (155 kph). The storm continued to intensify rapidly during the morning hours.

VIIRS found strongest storms were around Delta’s center of circulation and in a band of thunderstorms south of the center. Temperatures in those areas were as cold as minus 80 degrees Fahrenheit (minus 62.2 Celsius). Strong storms with cloud top temperatures as cold as minus 70 degrees Fahrenheit (minus 56.6. degrees Celsius) surrounded both of those areas.

NASA research has shown that cloud top temperatures that cold indicate strong storms that have the capability to create heavy rain. NASA provides data to tropical cyclone meteorologists so they can incorporate it in their forecasts.

Warnings and Watches on Oct. 6

A Hurricane Warning is in effect from Tulum to Dzilam, Mexico and for Cozumel. A Tropical Storm Warning is in effect for the Cayman Islands including Little Cayman and Cayman Brac and for the Cuban province of Pinar del Rio and the Isle of Youth. A Tropical Storm Warning is also in effect from Punta Herrero to Tulum, Mexico and from Dzilam to Progresso, Mexico. A Tropical Storm Watch is in effect for the Cuban province of La Habana.

Delta’s Status on Oct. 6

At 11:20 a.m. EDT, data from a NOAA Hurricane Hunter aircraft indicate that Delta is continuing to strengthen rapidly. The maximum winds have increased to near 130 mph (215 kph) with higher gusts.  This makes Delta a category 4 hurricane on the Saffir-Simpson Hurricane Wind Scale.

Delta was centered near latitude 18.2 degrees north and longitude 82.7 degrees west, about 315 miles (510 km) east-southeast of Cozumel, Mexico.  Delta is moving to the west-northwest at 16 mph (26 kph) and has a minimum central pressure near 954 millibars.

NHC Key Messages for Delta

The NHC issued several key messages about Delta today, Oct. 6:

STORM SURGE:  An extremely dangerous storm surge will raise water levels by as much as 6 to 9 feet above normal tide levels along coast of the Yucatan peninsula within the hurricane warning area, near and to right of where the center makes landfall. Near the coast, the surge will be accompanied by large and destructive waves.

WIND:  Tropical storm conditions are expected in portions of the Cayman Islands today.  In the Yucatan Peninsula, hurricane conditions are expected in the warning area early Wednesday, with tropical storm conditions beginning later today or tonight. Tropical storm conditions are expected in the tropical storm warning area tonight and Wednesday. In Cuba, tropical storm conditions are expected tonight in the warning area and possible in the watch area near the same time.

RAINFALL:  Delta is expected to produce 4 to 6 inches of rain, with isolated maximum totals of 10 inches, across portions of the northern Yucatan Peninsula through midweek. This rainfall may result in areas of significant flash flooding.

Over the next few days, Delta is expected to produce 2 to 4 inches of rain, with isolated higher amounts, across portions of the Cayman Islands and western Cuba. This rainfall may result in areas of flash flooding and mudslides.

Delta’s Forecast

NHC noted, “A slower northwestward to north-northwest motion is forecast to begin by late Wednesday or Wednesday night. On the forecast track, the center of Delta is expected to continue to pass southwest of the Cayman Islands through early this afternoon, and move over the northeastern portion of the Yucatan peninsula late tonight or early Wednesday.  Delta is forecast to move over the southern Gulf of Mexico Wednesday afternoon, and be over the southern or central Gulf of Mexico through Thursday.”

What Happened to Gamma’s Remnants?

The remnant low-pressure area of Gamma was located off the north coast of Yucatan at 8 a.m. EDT. Gamma has since moved inland and is forecast to dissipate on Wednesday.

NASA Researches Earth from Space

For more than five decades, NASA has used the vantage point of space to understand and explore our home planet, improve lives and safeguard our future. NASA brings together technology, science, and unique global Earth observations to provide societal benefits and strengthen our nation. Advancing knowledge of our home planet contributes directly to America’s leadership in space and scientific exploration.

For updated forecasts, visit: www.hurricanes.gov

By Rob Gutro 
NASA’s Goddard Space Flight Center

Marie – Eastern Pacific Ocean

Oct. 06, 2020 – NASA Catches Development of Tropical Storm Norbert as Marie Declines

NASA-NOAA’s Suomi NPP satellite passed over the Eastern Pacific Ocean and captured the birth of a depression that became Tropical Storm Norbert while Marie continued weakening while headed toward the Central Pacific.

Suomi NPP image of Norbert
NASA-NOAA’s Suomi NPP satellite captured a visible image of the development of Tropical Storm Norbert near the coast of southwestern Mexico on Oct. 5 at 5:55 p.m. EDT (2155 UTC). Meanwhile, (top left), Tropical Storm Marie continues tracking toward the Central Pacific Ocean. Credit: NASA Worldview, Earth Observing System Data and Information System (EOSDIS).

The same VIIRS visible image (above) besides capturing Norbert also caught a weakening Tropical Storm Marie as it continued toward the Central Pacific Ocean. The Suomi NPP image showed that deep convection and building thunderstorms associated with Marie had all but dissipated and what was left of it was located over 120 nautical miles away from the exposed low-level center of the cyclone (as a result of wind shear).

By 5 a.m. EDT on Oct. 6, Tropical Depression 19E strengthened into a tropical storm and was re-dubbed Norbert. At 11 a.m. EDT, Marie was barely hanging onto tropical storm status and fading quickly.

At 11 a.m. EDT (1500 UTC), the center of Tropical Storm Marie was located near latitude 22.1 degrees north and longitude 135.1 degrees west. Marie is moving toward the west-northwest near 9 mph (15 kph), and this general motion with some decrease in forward speed is expected during the next day or so, followed by a turn toward the west late Wednesday or early Thursday.

Maximum sustained winds have decreased to near 45 mph (75 kph) with higher gusts.  Gradual weakening is forecast during the next 48 hours, and Marie is forecast to become a remnant low-pressure area by tonight and a trough of low pressure in a few days.

By Rob Gutro
NASA’s Goddard Space Flight Center


Oct. 05, 2020 – NASA Infrared Imagery Reveals Wind Shear Displacing Marie’s Strongest Storms

NASA’s Aqua satellite provided an infrared view of Tropical Storm Marie that revealed the effects of outside winds battering the storm.

Aqua image of Marie
On Oct.5 at 6:20 a.m. EDT (1020 UTC), the MODIS instrument that flies aboard NASA’s Aqua satellite gathered infrared data on Marie that confirmed wind shear was adversely affecting the storm. Persistent westerly vertical wind shear showed strongest storms (yellow) pushed east of the center where cloud top temperatures were as cold as minus 50 degrees Fahrenheit (minus 45.5 Celsius). Credit: NASA/NRL

Wind shear occurs when winds at different levels of the atmosphere push against the rotating cylinder of winds, weakening the rotation by pushing it apart at different levels.

NASA’s Aqua Satellite Reveals Effects of Wind Shear 

Infrared light is a tool used to analyze the strength of storms in tropical cyclones by providing temperature information about a system’s clouds. The strongest thunderstorms that reach highest into the atmosphere have the coldest cloud top temperatures. This temperature information can also tell forecasters if the strongest storms in a tropical cyclone are being pushed away from the center, indicating wind shear.

On Oct.5 at 6:20 a.m. EDT (1020 UTC), the Moderate Resolution Imaging Spectroradiometer or MODIS instrument that flies aboard NASA’s Aqua satellite gathered infrared data on Marie that confirmed wind shear was adversely affecting the storm. Westerly vertical wind shear has pushed strongest storms east of the center where cloud top temperatures are as cold as minus 50 degrees Fahrenheit (minus 45.5 Celsius). The remains of the deep convection associated with Marie continues to get further displaced from the exposed low-level center due strong upper-level westerly winds, with the gap now over 100 nautical miles between those two features.

Status of Tropical Storm Marie  

At 11 a.m. EDT (1500 UTC), the center of Tropical Storm Marie was located near latitude 21.1 degrees north and longitude 131.9 degrees west. Marie is moving toward the west-northwest near 9 mph (15 km/h), and this general motion, with a decrease in forward speed, is anticipated during the next couple of days followed by a turn to the west. Maximum sustained winds are near 60 mph (95 kph) with higher gusts.

Forecast for Marie

Continued weakening is expected and Marie is forecast to degenerate into a remnant low by Tuesday night.

NASA Researches Tropical Cyclones

Hurricanes/tropical cyclones are the most powerful weather events on Earth. NASA’s expertise in space and scientific exploration contributes to essential services provided to the American people by other federal agencies, such as hurricane weather forecasting.

For more than five decades, NASA has used the vantage point of space to understand and explore our home planet, improve lives and safeguard our future. NASA brings together technology, science, and unique global Earth observations to provide societal benefits and strengthen our nation. Advancing knowledge of our home planet contributes directly to America’s leadership in space and scientific exploration.

For updated forecasts. visit: www.nhc.noaa.gov

By Rob Gutro
NASA’s Goddard Space Flight Center

Gamma – Atlantic Ocean

Oct. 06, 2020 – What Happened to Gamma’s Remnants?

The remnant low-pressure area of Gamma was located off the north coast of Yucatan at 8 a.m. EDT. Gamma has since moved inland and is forecast to dissipate on Wednesday.

By Rob Gutro
NASA’s Goddard Space Flight Center


Oct. 05, 2020 – NASA Imagery Reveals Tropical Storm Gamma Battered by Wind Shear

NASA’s Terra satellite obtained visible imagery of Tropical Storm Gamma being battered by outside winds in the south central Gulf of Mexico. Over the weekend of Oct. 3 and 4, Gamma tracked over Mexico’s Yucatan Peninsula.

Animation of Gammas movements
This animation from Oct. 1 to 4 shows visible imagery from NOAA/NASA’s Suomi NPP satellite of Tropical Storm Gamma moving through the Caribbean Sea, making landfall over Mexico’s Yucatan and moving into the southern Gulf of Mexico, just north of Mexico’s Yucatan Peninsula. Image Courtesy: NOAA/NASA

Tropical Depression 25 formed on Oct. 2 by 11 a.m. EDT over the northwestern Caribbean Sea. At the time of formation, NOAA’s National Hurricane Center (NHC) issued warnings and watches for a portion of the Yucatan Peninsula of Mexico. By 8 p.m. EDT, the depression strengthened into a tropical storm and re-named Gamma.

Gamma brought heavy rainfall to the Yucatan Peninsula over the weekend of Oct. 3 and 4. On Oct. 3, NHC noted, “Surface observations and satellite images indicate that the center of Tropical Storm Gamma made landfall in the northeast Yucatan Peninsula near Tulum, Mexico, around 11:45 a.m. CDT (12:45 p.m. EDT). The storm was very close to hurricane strength at landfall, with maximum sustained winds near 70 mph (110 mph) with higher gusts.”

The storm had weakened after tracking over the peninsula. By 5 p.m. EDT, Gamma’s center had moved off the northern coast of the Yucatan Peninsula and appeared to be stalled. The storm did not move much by Oct. 5.

Watches and Warnings on Oct. 5

On Oct. 5, the NHC posted a warning and a watch. A Tropical Storm Warning is in effect for north and west of Cancun to Dzilam, Mexico A Tropical Storm Watch is in effect from west of Dzilam to Campeche, Mexico.

Gamma’s Wind Shear Troubles  

The Moderate Resolution Imaging Spectroradiometer or MODIS instrument that flies aboard NASA’s Terra satellite captured a visible image of Tropical Storm Gamma on Oct. 5.

Terra image of Gamma
On Oct. 5, 2020 at 1:30 p.m. EDT, NASA’s Terra satellite provided a visible image of Tropical Storm Gamma in the southern Gulf of Mexico, just north of Mexico’s Yucatan Peninsula. Image Courtesy: NASA Worldview, Earth Observing System Data and Information System (EOSDIS).

Gamma is a strongly sheared tropical storm that has been meandering just north of the northern coast of the Yucatan Peninsula of Mexico. The MODIS image revealed the strongest thunderstorms were pushed far to the north of the center of circulation by those outside winds (wind shear) from the south.

Infrared imagery showed that strong convective cloud tops colder than minus 80 degrees Celsius were more than 60 nautical miles north and northeast of the well-defined and fully exposed low-level circulation center. That southerly wind shear was pushing those strong storms north of the center.

NHC noted that the Decay SHIPS intensity computer forecast model does indicate a very brief period of decreasing wind shear magnitude just prior to landfall around the 24-hour period. Afterward, the shear, once again, increases and the storm will weaken.

The satellite imagery was created using NASA’s Worldview product at NASA’s Goddard Space Flight Center in Greenbelt, Md.

Gamma’s Status on Oct. 5

At 2 p.m. EDT (1800 UTC), the center of Tropical Storm Gamma was located near latitude 22.3 degrees north and longitude 87.9 degrees west. It was centered about 135 miles (220 km) north-northwest of Cozumel, Mexico.

Gamma is moving toward the southwest near 4 mph (7 kph), and this general motion is expected to continue through Wednesday morning. Maximum sustained winds have decreased to near 40 mph (65 kph) with higher gusts.  The estimated minimum central pressure is 1003 millibars.

Key Messages

NHC issued two key messages about Gamma, as the storm is expected to continue affecting the Yucatan Peninsula:

Through midweek, Gamma is expected to produce an additional 3 to 6 inches of rainfall with isolated maximum amounts of 8 inches across portions of the Mexican states of Yucatan, Campeche, and Tabasco. This rainfall may produce significant flash flooding.

Tropical storm conditions are likely in portions of the Tropical Storm Warning area along the northern coast of the Yucatan Peninsula for a brief period this afternoon. Tropical Storm conditions are possible within the Tropical Storm Watch area.

Gamma’s Forecast 

On the forecast track, the center of Gamma should move inland over the northwest coast of the Yucatan Peninsula Tuesday night and remain inland through Thursday. Gradual weakening is forecast, and Gamma is expected to become a depression this evening and degenerate to a post-tropical remnant low tonight.

About NASA’s Worldview and Terra Satellite

NASA’s Earth Observing System Data and Information System (EOSDIS) Worldview application provides the capability to interactively browse over 700 global, full-resolution satellite imagery layers and then download the underlying data. Many of the available imagery layers are updated within three hours of observation, essentially showing the entire Earth as it looks “right now.”

NASA’s Terra satellite is one in a fleet of NASA satellites that provide data for hurricane research.

Tropical cyclones/hurricanes are the most powerful weather events on Earth. NASA’s expertise in space and scientific exploration contributes to essential services provided to the American people by other federal agencies, such as hurricane weather forecasting.

By Rob Gutro
NASA’s Goddard Space Flight Center

Chan-hom – Northwestern Pacific Ocean

Oct. 05, 2020 – NASA Imagery Reveals Tropical Storm Chan-hom’s Skewed Structure

NASA’s Terra satellite obtained visible imagery of Tropical Storm Chan-hom as it continued moving though the Northwestern Pacific Ocean. The imagery revealed that the center of circulation was exposed and its strongest storms were south of the center.

Terra image of Chan-hom
On Oct. 5, 2020, NASA’s Terra satellite provided a visible image of Tropical Storm Chan-hom several hundred miles northwest of Guam (lower right). Image Courtesy: NASA Worldview, Earth Observing System Data and Information System (EOSDIS).

Tropical Depression 16W formed on Oct. 4 and strengthened into a tropical storm on Oct 5. Once it reached tropical storm strength, it was re-named Chan-hom.  Laos submitted the name Chan-hom to the World Meteorological Organization list. The name is a type of tree in Laos.

NASA Satellite View: Chan-hom’s Organization

The Moderate Resolution Imaging Spectroradiometer or MODIS instrument that flies aboard NASA’s Terra satellite captured a visible image of Tropical Storm Chan-hom on Oct. 5 that showed a couple of things were occurring in the storm. First, bands of thunderstorms were wrapping into a partially exposed low-level circulation center. Second, there was building convection and thunderstorms occurring over the southern quadrant of the storm, giving it an appearance of a backwards letter “C” on satellite imagery. The storm is expected to strengthen over the next three days and when it does, it will likely develop a more circular shape.

The satellite imagery was created using NASA’s Worldview product at NASA’s Goddard Space Flight Center in Greenbelt, Md.

Chan-hom’s Status on Oct. 5

At 11 a.m. EDT (1500 UTC) on Oct. 5, Chan-hom was centered near latitude 23.0 degrees north and longitude 139.2 degrees east. That is about 738 miles south of Yokosuka, Japan. Chan-hom is moving north and has maximum sustained winds of 35 knots (40 mph/64 kph).

Chan-hom’s Forecast

The Joint Typhoon Warning Center noted, “Chan-hom is forecast to track generally northwestward along the southwestern periphery of a sub-tropical ridge (elongated area of high pressure) over the next three days. During this time, the system will steadily intensify to a peak intensity of 85 knots (98 mph/157 kph) by three days largely due to the continued low vertical wind shear and warm sea surface temperatures.”

About NASA’s Worldview and Terra Satellite

NASA’s Earth Observing System Data and Information System (EOSDIS) Worldview application provides the capability to interactively browse over 700 global, full-resolution satellite imagery layers and then download the underlying data. Many of the available imagery layers are updated within three hours of observation, essentially showing the entire Earth as it looks “right now.”

NASA’s Terra satellite is one in a fleet of NASA satellites that provide data for hurricane research.

Tropical cyclones/hurricanes are the most powerful weather events on Earth. NASA’s expertise in space and scientific exploration contributes to essential services provided to the American people by other federal agencies, such as hurricane weather forecasting.

By Rob Gutro
NASA’s Goddard Space Flight Center

Delta – Atlantic Ocean

Oct. 05, 2020 – NASA Gages Tropical Storm Delta’s Strength in Infrared

NASA’s Aqua satellite analyzed Tropical Storm Delta in infrared imagery as it moved through the Caribbean Sea. The imagery provided cloud top temperatures to identify the strongest areas within the storm.

AIRS image of Delta
On Oct. 5 at 3:05 a.m. EDT (0705 UTC) NASA’s Aqua satellite analyzed Tropical Storm Delta using the Atmospheric Infrared Sounder or AIRS instrument. AIRS found coldest cloud top temperatures as cold as or colder than (purple) minus 63 degrees Fahrenheit (minus 53 degrees Celsius) around the center of circulation. Credit: NASA JPL/Heidar Thrastarson

Potential Tropical Cyclone 26 formed in the Caribbean Sea on Sunday, Oct. 4 by 5 p.m. EDT. Six hours later, the National Hurricane Center (NHC) classified it as Tropical Depression 26. By 8 a.m. EDT, satellite imagery helped confirm that the depression had strengthened into a tropical storm. At that time, it was given the name Delta.

 Analyzing Delta’s Temperatures and Strength

One of the ways NASA researches tropical cyclones is using infrared data that provides temperature information. The AIRS instrument aboard NASA’s Aqua satellite captured a look at those temperatures in Delta and gave insight into the size of the storm and its rainfall potential.

Tropical cyclones do not always have uniform strength, and some sides have stronger sides than others. The stronger the storms, the higher they extend into the troposphere, and the colder the cloud top temperatures. NASA provides that data to forecasters at NOAA’s National Hurricane Center or NHC so they can incorporate in their forecasting.

On Oct. 5 at 3:05 a.m. EDT (0705 UTC) NASA’s Aqua satellite analyzed Tropical Storm Delta using the Atmospheric Infrared Sounder or AIRS instrument. AIRS found coldest cloud top temperatures as cold as or colder than (purple) minus 63 degrees Fahrenheit (minus 53 degrees Celsius) around the center of circulation. NASA research has shown that cloud top temperatures that cold indicate strong storms that have the capability to create heavy rain.

When meteorologists studied satellite imagery, including infrared imagery, it was noted that deep convection (rising air that forms the thunderstorms that make up a tropical cyclone) had been steadily improving in both vertical depth and structure of the storm since 2 a.m. EDT. Even the cloud pattern was becoming more circular with upper-level outflow of air at the top of the storm now having become established in all quadrants. That is an indication of improvement in a storm’s structure.

NHC noted, “However, there are still some indications in satellite imagery that the low-level and the mid-upper-level circulations are not yet vertically aligned, with the low-level center still located just inside the northern edge of the convective cloud shield.”

Eight hours after the AIRS image, the convective structure of Delta continued to improve. Earlier microwave data and early-light visible satellite imagery showed that the center of the tropical cyclone re-formed farther south within the area of deep convection.

Warnings and Watches on Oct. 5

NOAA’s National Hurricane Center has issued a number of watches and warnings for Delta on Oct. 5. A Hurricane Warning is in effect for Cuba’s province of Pinar del Rio. A Tropical Storm Warning is in effect for the Cayman Islands including Little Cayman and Cayman Brac, and for the Isle of Youth.

A Hurricane Watch is in effect for the Cuban province of Artemisa and for the Isle of Youth. A Tropical Storm Watch is in effect for the Cuban province of La Habana.

Delta’s Status

At 11 a.m. EDT (1500 UTC) on Oct. 5, the center of Tropical Storm Delta was located near latitude 16.4 degrees north and longitude 78.6 degrees west. Delta is centered about 135 miles (215 km) south of Negril, Jamaica and about 265 miles (425 km) southeast of Grand Cayman.

Delta is moving toward the west near 7 mph (11 kph), and a turn toward the west-northwest is forecast later today. A faster northwestward motion is expected on Tuesday (Oct. 6) and Wednesday (Oct. 7).  Maximum sustained winds have increased to near 45 mph (75 kph) with higher gusts. The estimated minimum central pressure is 1002 millibars.

 Delta’s Forecast

NHC expects additional strengthening during the next few days, and Delta is expected to become a hurricane on Tuesday before it nears western Cuba. On the forecast track, the center of Delta is expected to move away from Jamaica later today, move near or over the Cayman Islands early Tuesday, and approach western Cuba Tuesday afternoon or evening. Delta is forecast to move into the southeastern Gulf of Mexico Tuesday night, and be over the south-central Gulf of Mexico on Wednesday.

About NASA’s AIRS Instrument

The AIRS instrument is one of six instruments flying on board NASA’s Aqua satellite, launched on May 4, 2002.

AIRS, in conjunction with the Advanced Microwave Sounding Unit (AMSU), senses emitted infrared and microwave radiation from Earth to provide a three-dimensional look at Earth’s weather and climate. Working in tandem, the two instruments make simultaneous observations down to Earth’s surface. With more than 2,000 channels sensing different regions of the atmosphere, the system creates a global, three-dimensional map of atmospheric temperature and humidity, cloud amounts and heights, greenhouse gas concentrations and many other atmospheric phenomena. Launched into Earth orbit in 2002, the AIRS and AMSU instruments fly aboard NASA’s Aqua spacecraft. They are managed by NASA’s Jet Propulsion Laboratory (JPL) in Southern California, under contract to NASA. JPL is a division of Caltech.

NASA Research

For more than five decades, NASA has used the vantage point of space to understand and explore our home planet, improve lives and safeguard our future. NASA brings together technology, science, and unique global Earth observations to provide societal benefits and strengthen our nation. Advancing knowledge of our home planet contributes directly to America’s leadership in space and scientific exploration.

For updated forecasts, visit: www.nhc.noaa.gov

More information about AIRS can be found at: https://airs.jpl.nasa.gov/

By Rob Gutro
NASA’s Goddard Space Flight Center