Aug. 04, 2020 – NASA Infrared Imagery Shows Hagupit Nearing Landfall in China
NASA’s Aqua satellite provided a look at Typhoon Hagupit as it was nearing landfall in southeastern China.
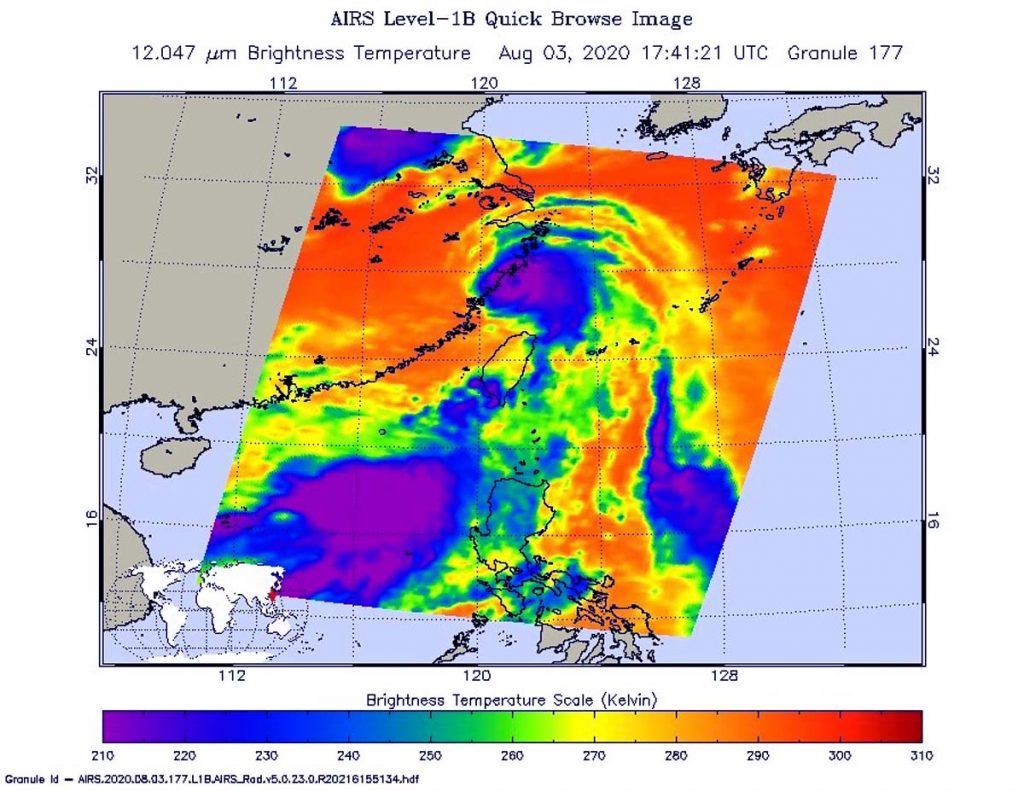
On Aug. 3 at 1:41 p.m. EDT (1741 UTC) NASA’s Aqua satellite analyzed Typhoon Hagupit less than 2 hours before landfall in China. Using the Atmospheric Infrared Sounder or AIRS instrument, NASA found coldest cloud top temperatures as cold as or colder than (purple) minus 63 degrees Fahrenheit (minus 53 degrees Celsius). Credit: NASA JPL/Heidar Thrastarson
One of the ways NASA researches tropical cyclones is using infrared data that provides temperature information. Cloud top temperatures provide information to forecasters about where the strongest storms are located within a tropical cyclone. Tropical cyclones do not always have uniform strength, and some sides have stronger sides than others. The stronger the storms, the higher they extend into the troposphere, and the colder the cloud temperatures.
On Aug. 3 at 1:41 p.m. EDT (1741 UTC) NASA’s Aqua satellite analyzed Hagupit using the Atmospheric Infrared Sounder or AIRS instrument. Aqua passed over Hagupit less than 2 hours before its official landfall.
The infrared data showed the bulk of the storms were southeast of the center because of vertical wind shear or outside winds pushing against the storm from the northwest.
AIRS found coldest cloud top temperatures as cold as or colder than minus 63 degrees Fahrenheit (minus 53 degrees Celsius). NASA research has shown that cloud top temperatures that cold indicate strong storms that have the capability to create heavy rain.
China’s National Meteorological Center reported that Hagupit made landfall China’s Zhejiang province on the coastal areas of Yueqing City at around 3:30 a.m. local time on Aug. 4 (3:30 p.m. EDT on Aug 3). At the time of landfall, Hagupit had maximum sustained winds near 85 mph (137 kph), equivalent to a Category 1 hurricane.
At 5 a.m. EDT (0900 UTC) on Aug. 4, the Joint Typhoon Warning Center noted that Tropical depression Hagupit was centered near latitude 29.8 degrees north and longitude 120.3 degrees east, about 104 nautical miles southwest of Shanghai, China. Hagupit was moving to the north with maximum sustained winds decreasing to 30 knots (35 mph/56 kph).
Hagupit is moving inland over eastern China and the Joint Typhoon Warning Center forecasts that it will reemerge into the Yellow Sea on Aug. 5, but adverse conditions will lead to Hagupit’s dissipation.
The AIRS instrument is one of six instruments flying on board NASA’s Aqua satellite, launched on May 4, 2002.
For more than five decades, NASA has used the vantage point of space to understand and explore our home planet, improve lives and safeguard our future. NASA brings together technology, science, and unique global Earth observations to provide societal benefits and strengthen our nation. Advancing knowledge of our home planet contributes directly to America’s leadership in space and scientific exploration.
Aug. 03, 2020 – NASA Puts Visible and Water Vapor Eyes on Tropical Storm Isaias
NASA’s Aqua satellite obtained visible and water vapor imagery as Tropical Storm Isaias continued moving along the east coast of Florida. On Aug. 3, Warnings and Watches stretched from Florida to Maine.
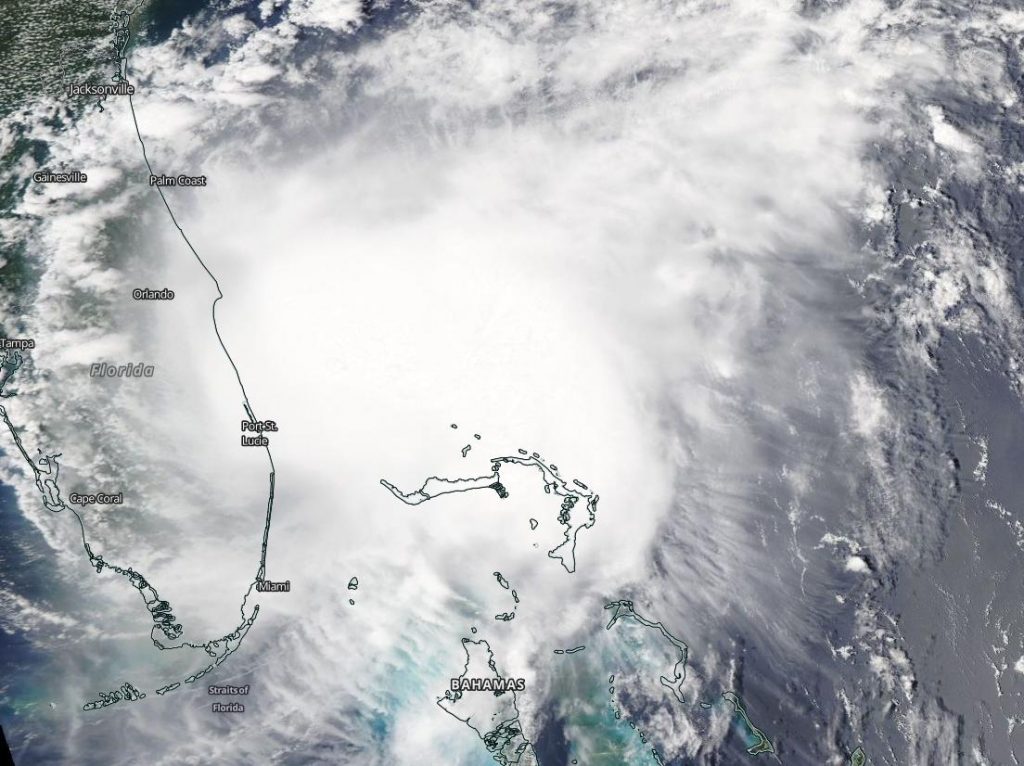
NASA’s Aqua satellite provided a visible image to forecasters of Tropical Storm Isaias of Florida’s east coast on Aug. 2 at 1:30 p.m. EDT. Image Courtesy: NASA Worldview, Earth Observing System Data and Information System (EOSDIS).
NASA Satellite View: Isaiah’s Organization
The Moderate Resolution Imaging Spectroradiometer or MODIS instrument that flies aboard NASA’s Aqua satellite captured a visible image of Tropical Storm Isaias on Aug. 2 at 1:30 p.m. EDT. There was no visible eye in the storm at the time of the imagery. The satellite image was created using NASA’s Worldview product at NASA’s Goddard Space Flight Center in Greenbelt, Md.
Water Vapor Imagery Shows Location of Heaviest Rain
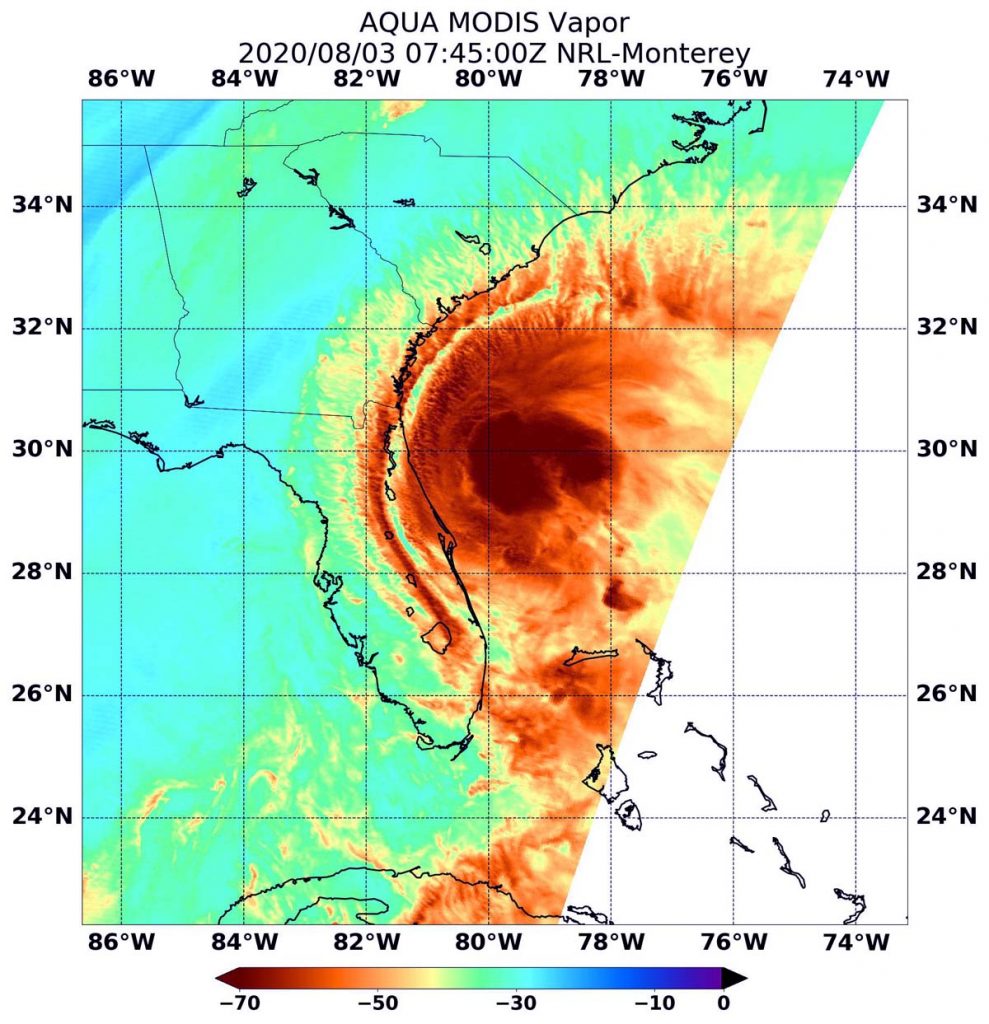
NASA’s Aqua satellite passed over Isaias on Aug. 3 at 3:45 a.m. EDT (0745 UTC) when it was off the coast of northeastern Florida and found highest concentrations of water vapor and coldest cloud top temperatures were offshore and mostly north and northeast of the center.
NASA’s Aqua satellite passed over Isaias on Aug. 3 at 3:45 a.m. EDT (0745 UTC) when it was off the coast of northeastern Florida and found highest concentrations of water vapor (brown) and coldest cloud top temperatures were off-shore and mostly north and northeast of the center. Credits: NASA/NRL
NHC noted, “Isaias continues to produce an area of vigorous convection near and to the northeast of its low-level center. Overnight radar data from Melbourne and Jacksonville have shown a transient mid-level eye feature that is located northeast of the low-level center.”
Coldest cloud top temperatures were as cold as or colder than minus 70 degrees Fahrenheit (minus 56.6 degrees Celsius) in those storms. Storms with cloud top temperatures that cold have the capability to produce heavy rainfall.
Water vapor analysis of tropical cyclones tells forecasters how much potential a storm has to develop. Water vapor releases latent heat as it condenses into liquid. That liquid becomes clouds and thunderstorms that make up a tropical cyclone. Temperature is important when trying to understand how strong storms can be. The higher the cloud tops, the colder and stronger they are.
The heavy rain potential in the storm is in the forecast as Isaias makes landfall and moves northeast along the U.S. East Coast. The National Hurricane Center (NHC) noted, “Heavy rainfall will result in flash and urban flooding, some of which may be significant in the eastern Carolinas and the mid-Atlantic, through midweek along and near the path of Isaias across the East Coast of the United States. Widespread minor to moderate river flooding is possible across portions of the Carolinas and the mid-Atlantic. Additionally, quick-responding rivers in the southern Appalachians and Northeast will be susceptible to minor river flooding.”
Warnings and Watches Posted All Along U.S. East Coast
A Storm Surge Warning is in effect for Edisto Beach, South Carolina to Cape Fear, North Carolina. A Storm Surge Watch is in effect for Cape Fear to Duck, North Carolina and the Pamlico and Albemarle Sounds. A Hurricane Warning is in effect for South Santee River, South Carolina to Surf City, North Carolina. A Tropical Storm Warning is in effect for Flagler/Volusia County Line, Florida to South Santee River, South Carolina; north of Surf City, North Carolina to west of Watch Hill, Rhode Island; Chesapeake Bay south of North Beach; Tidal Potomac River south of Cobb Island; Delaware Bay; Long Island and Long Island Sound; Pamlico and Albemarle Sounds. A Tropical Storm Watch is in effect for Watch Hill, Rhode Island to Stonington, Maine and for Martha’s Vineyard, Nantucket, and Block Island.
Tropical Storm Isaias on Aug. 3
At 8 a.m. EDT (1200 UTC) on Aug. 3, the center of Tropical Storm Isaias was located by an Air Force Reserve reconnaissance aircraft and NOAA Doppler weather radars near latitude 30.2 degrees north and longitude 80.1 degrees west. That is about 100 miles (155 km) east-southeast of Jacksonville, Fla. and about 250 miles (400 km) south-southwest of Myrtle Beach, So. Carolina. The estimated minimum central pressure is 994 millibars.
Isaias is moving toward the north near 13 mph (20 kph). A turn toward the north and north-northeast along with an increase in forward speed is expected later today and Tuesday, Aug. 4. Maximum sustained winds are near 70 mph (110 kph) with higher gusts. Some strengthening is anticipated today, and Isaias is forecast to regain hurricane strength before it reaches the coast of northeastern South Carolina or southern North Carolina tonight. Slow weakening is forecast after Isaias makes landfall in the Carolinas and moves across the U.S. mid-Atlantic region tonight and Tuesday.
An 8 a.m. EDT Florida Observation on Aug. 3
During the 7 a.m. hour a wind gust to 40 mph (65 kph) was observed at the St, Augustine Pier, Florida, and a sustained wind of 34 mph (55 kph) and a gust to 40 mph (65 kph) were measured by a Weatherflow station at the Jacksonville Beach Pier, Florida.
Isaias’ Forecast and Track
The NHC Discussion at 8 a.m. EDT on Aug. 3 noted that the vertical wind shear that has been plaguing Isaias is forecast to abate slightly today as the storm turns north-northeastward. All of the intensity models shows some slight strengthening during the next 12 hours, and the global models also indicate some deepening. As a result, the updated NHC intensity forecast calls for Isaias to regain hurricane status before the system moves over the coast of the Carolinas.
The NHC noted, “On the forecast track, the center of Isaias will pass well east of the Georgia coast through this morning. The center of Isaias will then approach the coast of northeastern South Carolina and southern North Carolina within the hurricane warning area later today. The center will then move inland over eastern North Carolina tonight, and move along the coast of the mid-Atlantic states on Tuesday and into the northeastern United States by Tuesday night.”
About NASA’s Worldview and Aqua Satellite
NASA’s Earth Observing System Data and Information System (EOSDIS) Worldview application provides the capability to interactively browse over 700 global, full-resolution satellite imagery layers and then download the underlying data. Many of the available imagery layers are updated within three hours of observation, essentially showing the entire Earth as it looks “right now.”
NASA’s Aqua satellite is one in a fleet of NASA satellites that provide data for hurricane research.
Tropical cyclones/hurricanes are the most powerful weather events on Earth. NASA’s expertise in space and scientific exploration contributes to essential services provided to the American people by other federal agencies, such as hurricane weather forecasting.
Aug. 03, 2020 – NASA Finds an Eye and a Giant “Tail” in Typhoon Hagupit
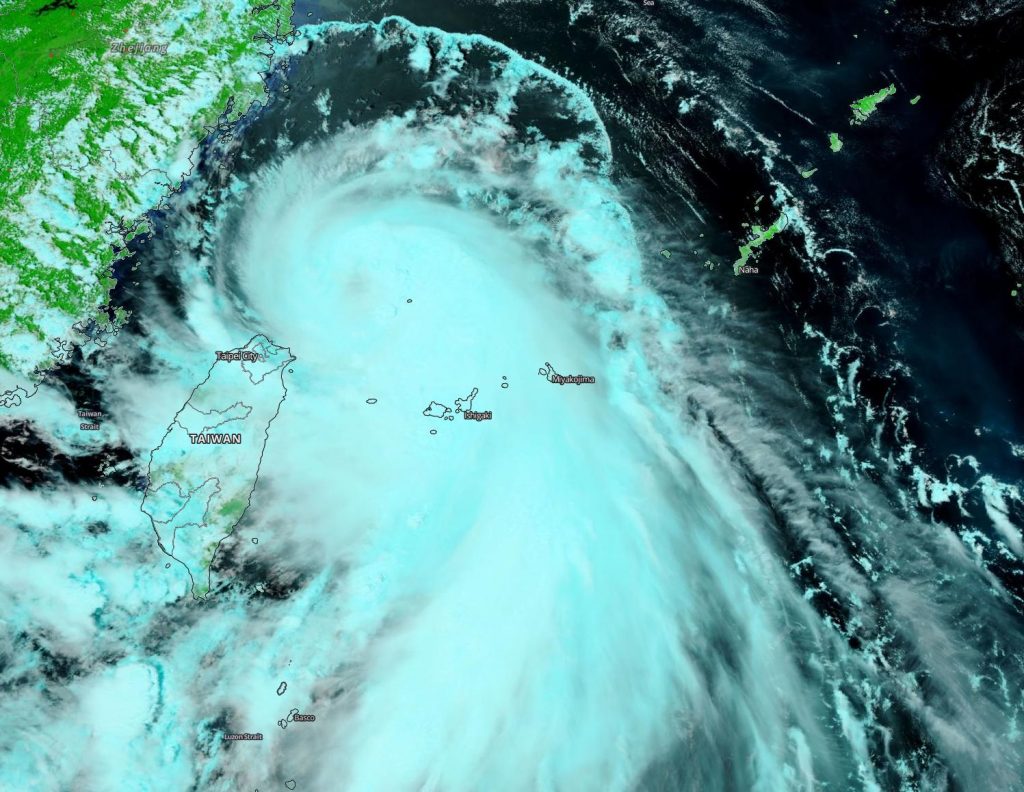
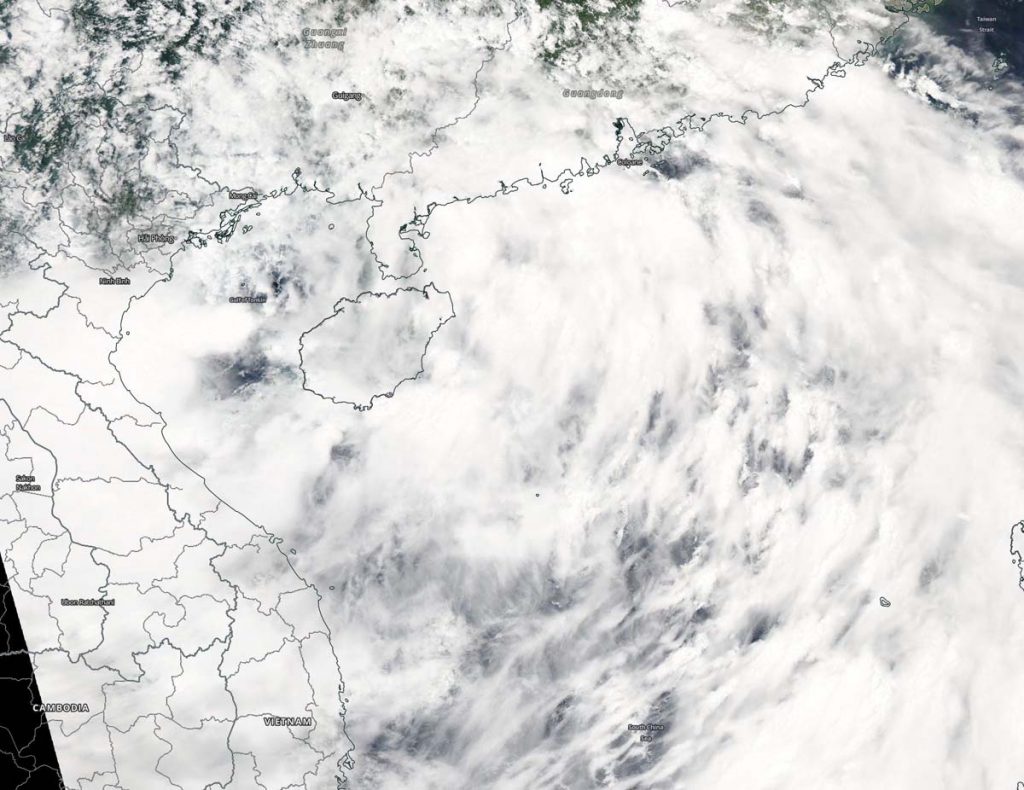
NASA-NOAA’s Suomi NPP satellite provided forecasters with a visible image of Typhoon Hagupit in the Northwestern Pacific Ocean that showed the development of an eye as it quickly intensified. Imagery also showed a thick band of thunderstorms that resembled a giant tail, spiraling into the powerful storm.
NASA-NOAA’s Suomi NPP satellite provided forecasters with a visible image of Typhoon Hagupit on Aug. 3 as it moved through the Northwestern Pacific Ocean, just northeast of Taiwan. Credit: NASA Worldview, Earth Observing System Data and Information System (EOSDIS)
Tropical Depression 03W formed northeast of Luzon, Philippines on August 1 and was renamed Hagupit when it strengthened to a tropical storm on Aug. 2. By Aug. 3, Hagupit had quickly intensified into a typhoon.
On Aug. 3, the Visible Infrared Imaging Radiometer Suite (VIIRS) instrument aboard Suomi NPP revealed that the storm had developed an eye, although it appeared somewhat obscured by high clouds. VIIRS showed that powerful bands of thunderstorms had circled the eye. A large, thick band of thunderstorms that extended south-southeast of the center looked like a giant tail on the VIIRS imagery. Hagupit was northeast of Taiwan at the time Suomi NPP passed overhead.
At 5 a.m. EDT (0900 UTC) on Aug. 3, the Joint Typhoon Warning Center (JTWC) noted that Hagupit had maximum sustained winds near 65 knots (75 mph/120 kph), making it a Category 1 hurricane on the Saffir-Simpson Hurricane Wind Scale. The center of Hagupit was located near latitude 26.8 degrees north and longitude 122.2 degrees east. It was centered about 285 nautical miles west of Kadena Air Base, Okinawa, Japan. Hagupit was moving northwest.
Hagupit is forecast to make landfall later today, Aug. 3, south of Shanghai and curve north then northeast. The center of the storm is expected to pass to the west of Shanghai and then re-emerge into the East China Sea.
NASA Researches Tropical Cyclones
Tropical cyclones/hurricanes are the most powerful weather events on Earth. NASA’s expertise in space and scientific exploration contributes to essential services provided to the American people by other federal agencies, such as hurricane weather forecasting.
For more than five decades, NASA has used the vantage point of space to understand and explore our home planet, improve lives and safeguard our future. NASA brings together technology, science, and unique global Earth observations to provide societal benefits and strengthen our nation. Advancing knowledge of our home planet contributes directly to America’s leadership in space and scientific exploration.
Aug. 02, 2020 –NASA Catches Tropical Storm Sinlaku’s Vietnam Landfall
NASA’s Aqua satellite passed over Tropical Storm Sinlaku shortly after it made landfall around 2 a.m. EDT (0600 UTC) on Aug. 2 in northern Vietnam.
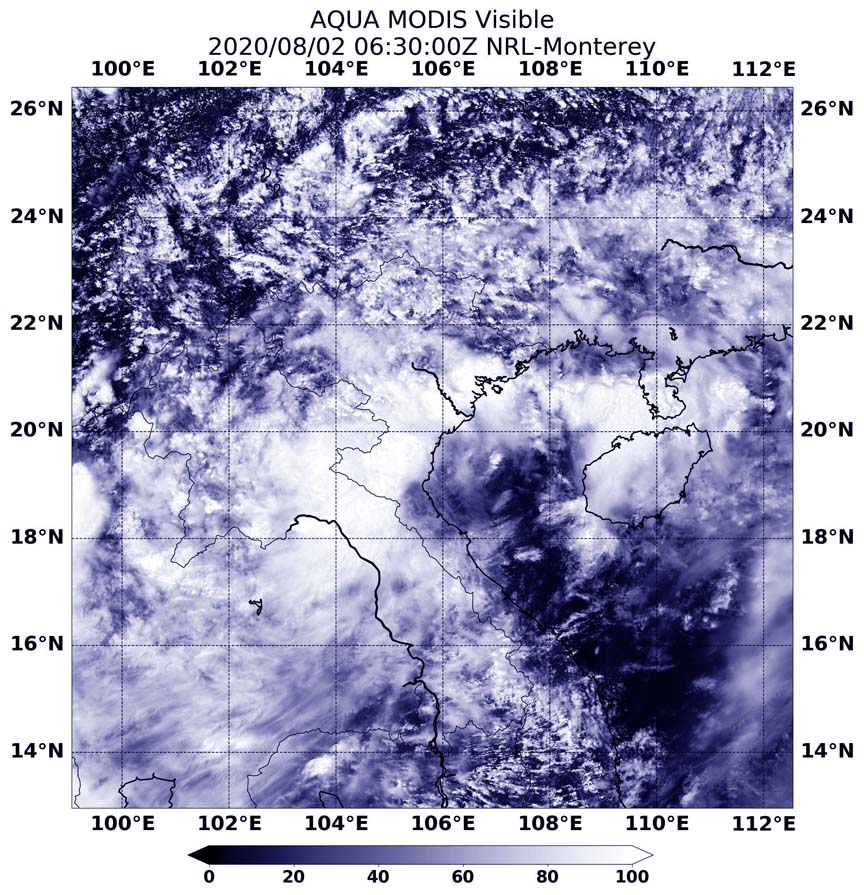
NASA’s Aqua satellite provided a visible image of the Tropical Storm Sinlaku on Aug 2 at 2:30 p.m. EDT (0630 UTC) shortly after its landfall in northern Vietnam. Credit: NASA/NRL
By 5 a.m. EDT (0900 UTC), Sinlaku had moved inland and was located near 19.7 north degrees latitude and 105.8 east degrees longitude, about 78 miles south of Hanoi, Vietnam. Sinlaku had maximum sustained winds near 35 knots (40 mph) and was weakening.
The Moderate Resolution Imaging Spectroradiometer aboard NASA’s Aqua satellite provided a visible image of the storm on Aug 2 at 2:30 p.m. EDT (0630 UTC) shortly after its landfall in northern Vietnam.
Sinlaku is moving northwest and is forecast to dissipate.
Aug. 02, 2020 – NASA Satellites Show a Weaker Tropical Storm Isaias
NASA’s Aqua satellite provided visible and infrared views of Isaias and found the storm a little more disorganized–an indication that it had weakened from a hurricane to a tropical storm. Isaias ran into wind shear and forecasters expect those winds to continue battering the storm for another day.
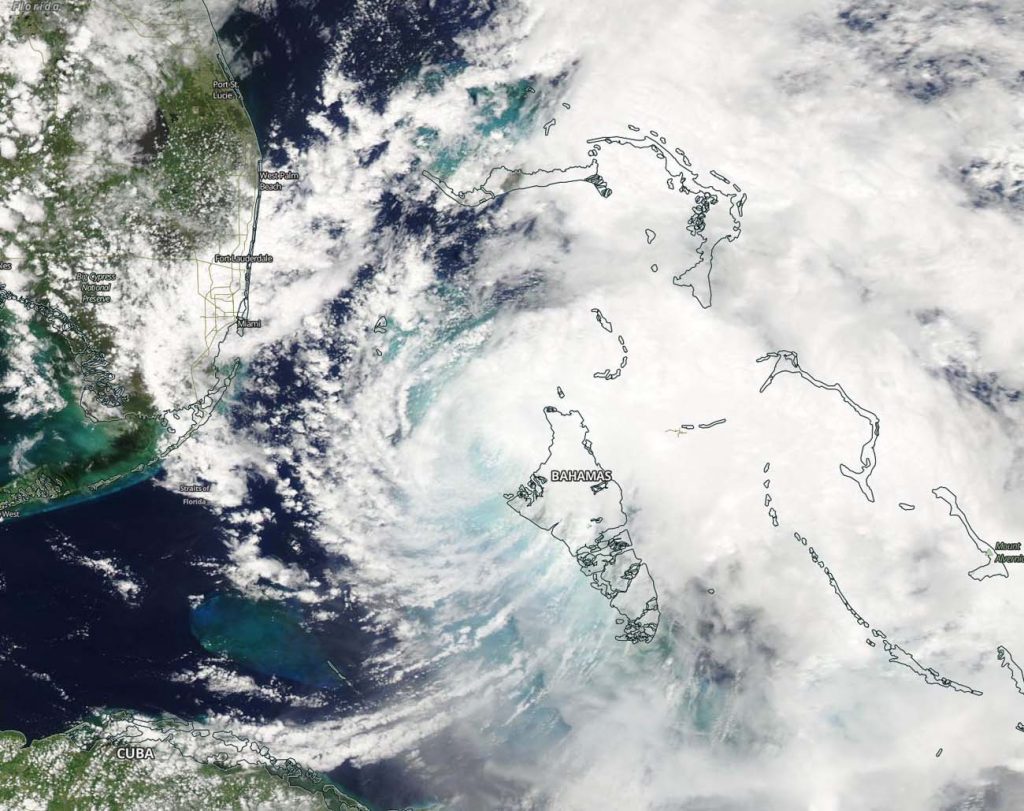
On Aug. 1, NASA’s Aqua satellite provided a visible image to forecasters of Tropical Storm Isaias over the northern Bahamas where it weakened slightly from a hurricane to a tropical storm. Image Courtesy: NASA Worldview, Earth Observing System Data and Information System (EOSDIS).
On Aug. 1, the MODIS instrument, known as the Moderate Resolution Imaging Spectroradiometer that flies aboard NASA’s Aqua satellite provided a visible image to forecasters of Tropical Storm Isaias over the northern Bahamas where it weakened slightly from a hurricane to a tropical storm. Isaias had weakened to a tropical storm due to a combination of shear, dry air and interaction with Andros Island earlier in the day.
NASA Finds Isaias’ Strongest Storms Over Northern Bahamas
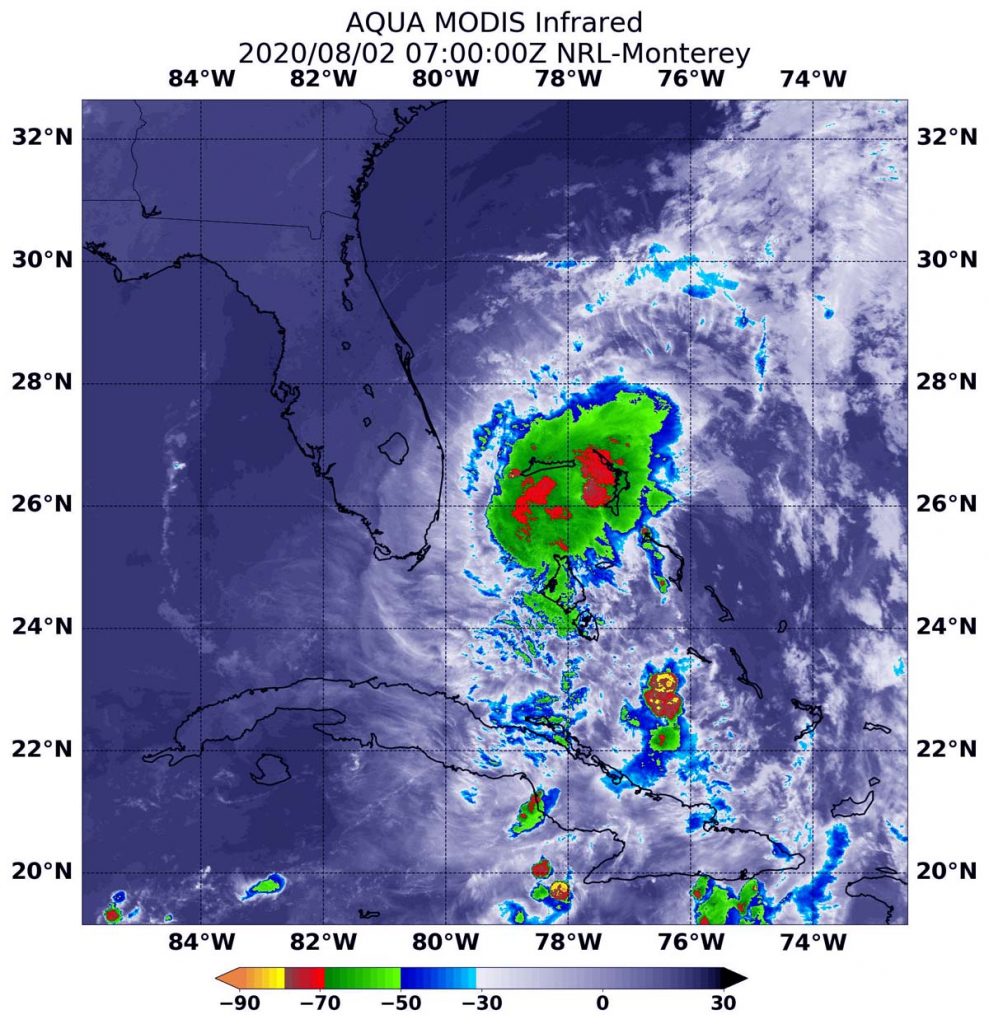
NASA’s Aqua satellite’s MODIS instrument also used infrared light to analyze the strength of storms in Tropical Storm Isaias. Infrared data provides temperature information, and the strongest thunderstorms that reach high into the atmosphere have the coldest cloud top temperatures.
On Aug. 2 at 3 a.m. EDT (0700 UTC) the MODIS instrument that flies aboard NASA’s Aqua satellite showed strongest storms were east of Isaias’ center and over the northern Bahamas. In those areas, cloud top temperatures were as cold as minus 70 degrees Fahrenheit (minus 56.6 Celsius). Credit: NASA/NRL
On Aug. 2 at 3 a.m. EDT (0700 UTC) the Moderate Resolution Imaging Spectroradiometer or MODIS instrument that flies aboard NASA’s Aqua satellite found strongest thunderstorms had cloud top temperatures as cold as or colder than minus 70 degrees Fahrenheit (minus 56.6 Celsius). Cloud top temperatures that cold indicate strong storms with the potential to generate heavy rainfall.
Forecasters at the National Hurricane Center (NHC) noted, “The burst of deep convection that developed to the northeast of the center last evening has not resulted in any significant improvement in the structure of Isaias according to recent reconnaissance aircraft data and radar imagery.”
At 8 a.m. EDT (1200 UTC) on Aug. 2, the NHC reported, “Heavy rainfall and gusty winds continue over the northwestern Bahamas and tropical storm conditions close to the east coast of Florida.”
Weakened by Wind Shear
NHC noted at 5 a.m. EDT (0900 UTC) on Sunday, August 2, 2020, “The tropical cyclone is still being adversely affected by about 25 knots (29 mph/46 kph) of 850-200 millibar vertical wind shear. That is about 5,000 feet about sea level to about 39,000 feet above sea level (near the top of the troposphere).
An air pressure of 200 millibars is said to occur near 39,000 feet (12,000 meters) in elevation. However, the height ranges from near 35,000 to 41,000 feet (10,800 to 12,300 meters). This pressure level is near an elevation of 5,000 feet though it ranges from 3,800 feet (1,170 meters) to 5,200 feet (1,590 meters).
In general, wind shear is a measure of how the speed and direction of winds change with altitude. Tropical cyclones are like rotating cylinders of winds. Each level needs to be stacked on top each other vertically in order for the storm to maintain strength or intensify. Wind shear occurs when winds at different levels of the atmosphere push against the rotating cylinder of winds, weakening the rotation by pushing it apart at different levels.
Hurricane Isaias on Sunday, August 2, 2020
At 8 a.m. EDT (1200 UTC) on Aug. 2 the center of Tropical Storm Isaias was located by an Air Force Reserve reconnaissance aircraft and NOAA Doppler weather radars near latitude 26.5 degrees north and longitude 79.5 degrees west. Isaias is moving toward the northwest near 8 mph (13 kph). A general northwestward motion is expected today, followed by a north-northwestward motion tonight.
Reports from an Air Force Reserve Hurricane Hunter aircraft indicated that the maximum sustained winds remain near 65 mph (100 kph) with higher gusts. Little change in strength is expected during the next couple of days. The latest minimum central pressure reported by reconnaissance aircraft is 996 millibars.
Watches and Warnings in Effect
NHC has posted many warnings and watches for Isaias. A Storm Surge Watch is in effect for Jupiter Inlet to Ponte Vedra Beach, Florida. Edisto Beach, South Carolina to Cape Fear, North Carolina. A Tropical Storm Warning is in from Hallandale Beach, Florida to South Santee River, South Carolina and for Lake Okeechobee, Florida. A Tropical Storm Watch is in effect from north of South Santee River, South Carolina to Surf City, North Carolina.
Isaias’ Forecast Path
NHC forecasters noted, “A turn toward the north and north-northeast is anticipated on Monday and Tuesday with an increase in forward speed. On the forecast track, the center of Isaias will move near or over the east coast of Florida today through late tonight. On Monday and Tuesday, the center of Isaias will move from offshore of the coast of Georgia into the southern mid-Atlantic states.”
NHC Hurricane Forecaster Daniel Brown noted, “Since Isaias has not shown any signs of re-organizing overnight, it appears that the window of opportunity for it to re-strengthen is closing.”
NASA Researches Tropical Cyclones
Hurricanes/tropical cyclones are the most powerful weather events on Earth. NASA’s expertise in space and scientific exploration contributes to essential services provided to the American people by other federal agencies, such as hurricane weather forecasting.
For more than five decades, NASA has used the vantage point of space to understand and explore our home planet, improve lives and safeguard our future. NASA brings together technology, science, and unique global Earth observations to provide societal benefits and strengthen our nation. Advancing knowledge of our home planet contributes directly to America’s leadership in space and scientific exploration.
Aug. 01, 2020 – NASA Sees New Tropical Storm Sinlaku Form Before a Quick Landfall
NASA’s Aqua satellite obtained visible imagery of a newly developed tropical storm in the South China Sea, the same day it was forecast to make landfall.
NASA’s Aqua satellite captured a visible image of Tropical Storm Sinlaku Aug. 1. Sinlaku has formed near Hainan Island and appears to have a large circulation. Image Courtesy: NASA Worldview, Earth Observing System Data and Information System (EOSDIS).
Tropical Storm Sinlaku formed in the South China Sea, within the Northwestern Pacific Ocean basin on Saturday, August 1 at 5 a.m. EDT (0900 UTC). At that time, the storm was centered near 18.9 degrees north latitude and 108.4 degrees east longitude, about 174 nautical miles north of Da Nang, Vietnam. Sinlaku was moving to the west-northwest at 15 knots (17 mph/28 kph) and had maximum sustained winds 35 knots (40 mph/~65 kph).
The Moderate Imaging Spectroradiometer or MODIS instrument that flies aboard NASA’s Aqua satellite captured a visible image of Tropical Storm Sinlaku Aug. 1. The Aqua image showed Sinlaku formed near Hainan Island and appears to have a large circulation. Satellite imagery was generated using NASA’s Worldview product at NASA’s Goddard Space Flight Center in Greenbelt, Md.
In addition to the visible imagery, forecasters used animated enhanced infrared satellite imagery that showed fragmented deep convective banding over the western semicircle with a large low-level circulation center.
The Joint Typhoon Warning Center said that the storm will make landfall in northern Vietnam later today.
About NASA’s Worldview and Aqua Satellite
NASA’s Earth Observing System Data and Information System (EOSDIS) Worldview application provides the capability to interactively browse over 700 global, full-resolution satellite imagery layers and then download the underlying data. Many of the available imagery layers are updated within three hours of observation, essentially showing the entire Earth as it looks “right now.”
NASA’s Aqua satellite is one in a fleet of NASA satellites that provide data for hurricane research.
Tropical cyclones are the most powerful weather event on Earth. NASA’s expertise in space and scientific exploration contributes to essential services provided to the American people by other federal agencies, such as hurricane weather forecasting.
Aug. 01, 2020 – NASA Catches Atlantic Depression with an Expected Short Life
NASA’s Aqua satellite provided a visible image of what is expected to be a new short-lived tropical depression in the eastern North Atlantic Ocean. Although it formed yesterday, July 31, it is forecast to become a remnant low-pressure area today.
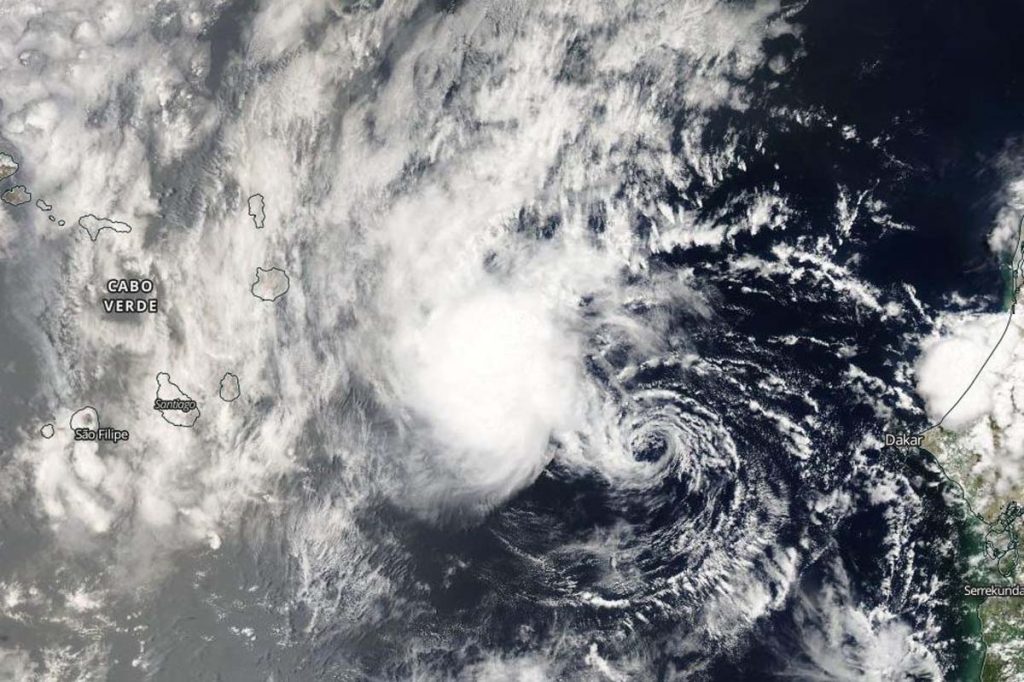
NASA’s Aqua satellite captured a visible image of North Atlantic Ocean Tropical Depression 10 as it formed on July 31 near the Cabo Verde Islands (left). It is a weak system and appeared as wispy clouds around the center of circulation, with thunderstorms northwest of the center. Credit: NASA Worldview
The Moderate Resolution Imaging Spectroradiometer instrument aboard NASA’s Aqua satellite captured a visible image of North Atlantic Ocean Tropical Depression 10 as it formed on July 31 near the Cabo Verde Islands. It is a weak system and appeared as wispy clouds around the center of circulation, with thunderstorms northwest of the center. The image was created using the Worldview application at NASA’s Goddard Space Flight Center in Greenbelt, Md.
Tropical Depression 10 formed on Friday, July 31 at 5 p.m. EDT (2100 UTC) about 265 miles (430 km) east of the Cabo Verde Islands (Cape Verde Islands) in the eastern North Atlantic Ocean. Deep convection had developed closer to the center of a small area of low pressure located a couple of hundred miles east of the Cabo Verde Islands and it was designated a tropical depression.
However, the depression did not seem to have much of a chance to develop. At 11 p.m. EDT on July 31 (0300 UTC on Aug. 1), the National Hurricane Center (NHC) noted, “The small depression maintained a large burst of convection in its northwest quadrant for several hours after the last advisory, though cloud tops have warmed steadily since around 00 UTC.” Warming cloud top temperatures indicate a weakening in the uplift of the storm that helps create the thunderstorms that make up a tropical cyclone. When cloud tops warm, they lower in altitude.
At 5 a.m. EDT (0900 UTC) on Aug. 1, the center of Tropical Depression 10 was located near latitude 17.8 degrees north and longitude 21.6 degrees west. That is about 200 miles (325 km) northeast of the Cabo Verde Islands. The depression was moving toward the northwest near 16 mph (26 kph). A turn toward the west-northwest or west is expected by Saturday afternoon. Maximum sustained winds are near 35 mph (55 km/h) with higher gusts. The depression is forecast to weaken and become a remnant low later today. The estimated minimum central pressure is 1008 millibars.
NHC forecaster Blake noted, “It seems like the chance for the depression to become a tropical storm has passed with it now moving over cooler waters into a drier air mass. Thus weakening is forecast and the system will likely degenerate into a remnant low later today. On the forecast track, the center of the depression is expected to move north of the Cabo Verde Islands later today.
NASA Researches Tropical Cyclones
Hurricanes/tropical cyclones are the most powerful weather events on Earth. NASA’s expertise in space and scientific exploration contributes to essential services provided to the American people by other federal agencies, such as hurricane weather forecasting.
For more than five decades, NASA has used the vantage point of space to understand and explore our home planet, improve lives and safeguard our future. NASA brings together technology, science, and unique global Earth observations to provide societal benefits and strengthen our nation. Advancing knowledge of our home planet contributes directly to America’s leadership in space and scientific exploration.
Aug. 01, 2020 – NASA Examines Hurricane Isaias’ Soaking Potential
NASA analyzed the cloud top temperatures in Hurricane Isaias using infrared light to determine the strength of the storms that make up the tropical cyclone. NASA’s Aqua satellite found very cold cloud temperatures indicative of storms with heavy rainmaking capabilities.
Isaias is expected to approach the southeast coast of Florida later today, Aug. 1 and into Sunday, Aug. 2.
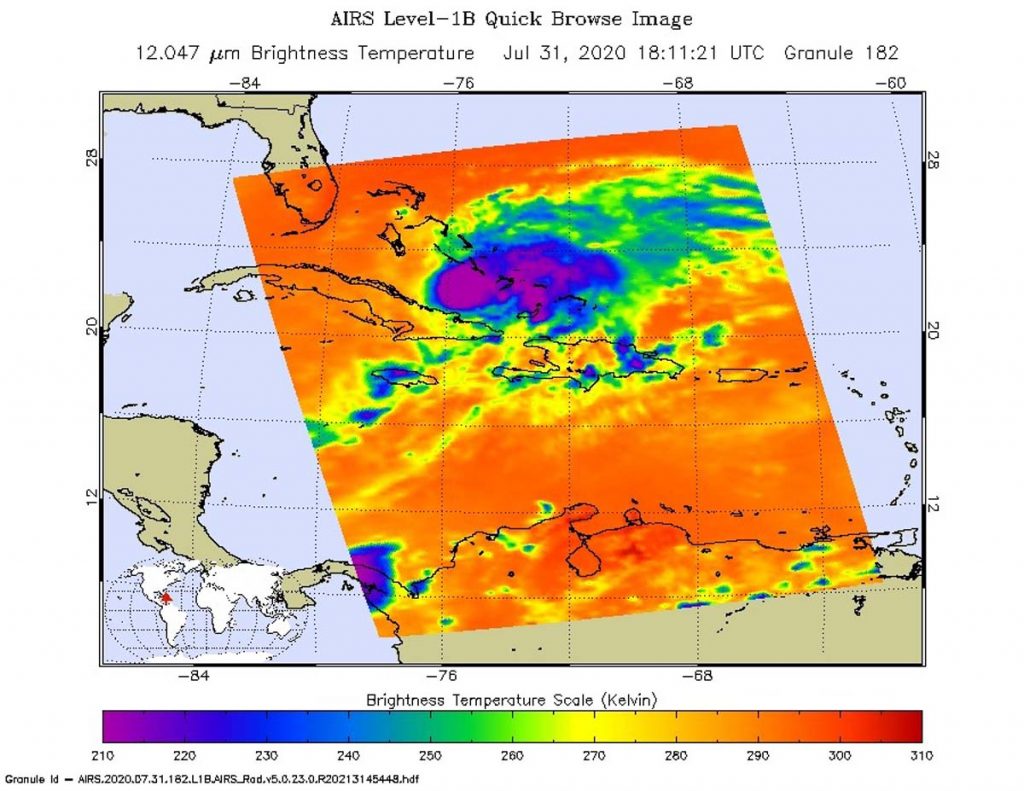
On July 31 at 2:11 p.m. EDT (1811 UTC) the AIRS instrument aboard NASA’s Aqua satellite provided an infrared view of Isaias when it was over the southern and central Bahamas. Coldest cloud top temperatures were as cold as or colder than (purple) minus 63 degrees Fahrenheit (minus 52.7 degrees Celsius) around the center. Credit: NASA JPL/Heidar Thrastarson
An Infrared Analysis of Isaias
One of the ways NASA researches tropical cyclones is using infrared data that provides temperature information. Cloud top temperatures identify where the strongest storms are located. The stronger the storms, the higher they extend into the troposphere, and the colder the cloud temperatures.
On July 31 at 2:11 p.m. EDT (1811 UTC) NASA’s Aqua satellite analyzed the storm using the Atmospheric Infrared Sounder or AIRS instrument. Isaias was over the southern and central Bahamas at the time, and generating soaking rains.
The AIRS imagery showed the strongest storms circling the center of circulation. In those areas, AIRS found coldest cloud top temperatures as cold as or colder than minus 63 degrees Fahrenheit (minus 52.7 degrees Celsius). NASA research has shown that cloud top temperatures that cold indicate strong storms that have the capability to create heavy rain.
Tropical cyclones do not always have uniform strength, and some sides have stronger sides than others, so knowing where the strongest sides of the storms are located helps forecasters. NASA then provides data to tropical cyclone meteorologists so they can incorporate it in their forecasts. Isaias Forecast Rainfall
The NHC rainfall forecast for Isaias calls for 4 to 8 inches in the Bahamas, 1 to 2 inches in Cuba with a maximum of 4 inches there. Rainfall forecasts from July 31 to Aug. 4 in South Florida into east-Central Florida call for between 2 to 4 inches, with isolated maximum totals of 6 inches. From northeast Florida into coastal Georgia, 1 to 2 inches are currently forecast. These totals are also subject to change based on any deviation of the track of the storm.
In addition to the heavy rainfall, hurricane-force winds, dangerous storm surge and ocean swells are expected. For an updated list of hazards, visit the NHC website.
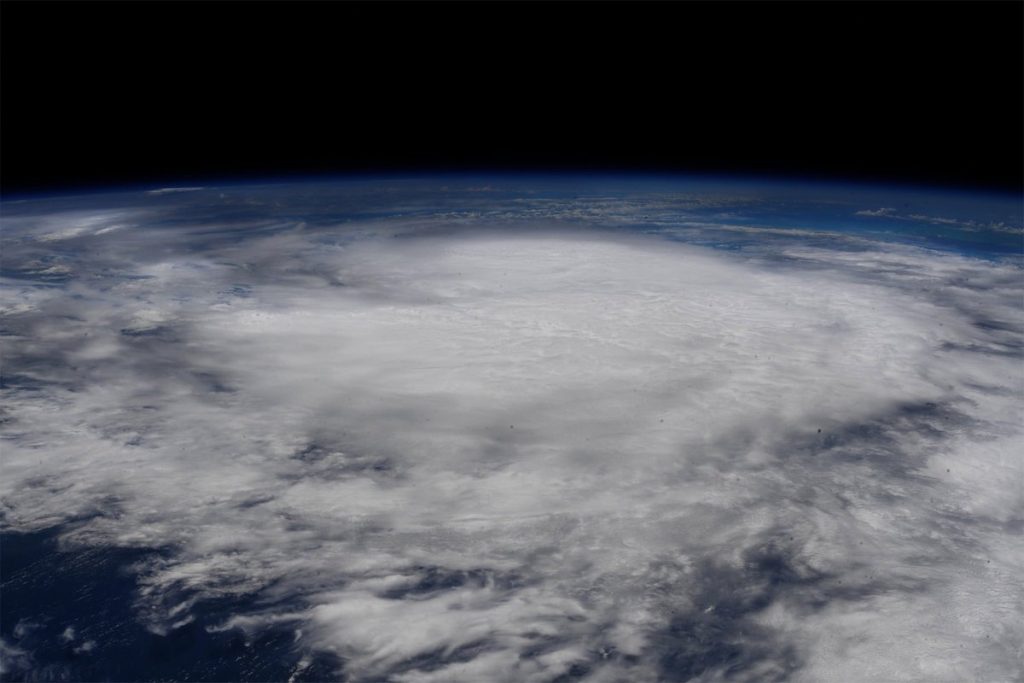
This photo of Hurricane Isaias was taken around 5:30 p.m. EDT on July 31 by Col. Doug Hurley aboard the International Space Station. Isaias was located between Cuba and the Bahamas. Credit: NASA/ Col. Doug Hurley
A View from the International Space Station
The International Space Station provides a window onto the world and shortly after NASA’s Aqua satellite passed over Isaias, the ISS was close enough to get a view of the storm. Around 5:30 p.m. EDT on July 31, Astronaut Col. Doug Hurley photographed Isaias when it was located between Cuba and the Bahamas.
Hurricane Isaias on Saturday, August 1, 2020
At 8 a.m. EDT on Saturday, August 1, 2020, the National Hurricane Center (NHC) reported that Isaias ragged eye was near eastern Andros Island. The center was near near latitude 24.3 degrees north and longitude 77.5 degrees west. Isaias is moving toward the northwest near 12 mph (19 kph). A general northwestward motion with some decrease in forward speed is expected for the next day or so, followed by a turn toward the north-northwest by late Sunday.
NHC noted that reports from the reconnaissance aircraft indicate that maximum sustained winds remain near 85 mph (140 kph) with higher gusts. Little change in strength is expected through Sunday, and Isaias is forecast to remain a hurricane during this time. The minimum central pressure recently measured by the aircraft was 987 millibars.
Watches and Warnings in Effect
NHC has posted many warnings and watches for Isaias. A Hurricane Warning is in effect from Boca Raton to the Volusia/Flagler County Line, Florida and for the Northwestern Bahamas. A Hurricane Watch is in effect for Hallandale Beach to south of Boca Raton, Florida.
In addition, a Storm Surge Watch is in effect for Jupiter Inlet to Ponte Vedra Beach, Florida. Dangerous storm surge is possible along the Florida east coast from Jupiter Inlet to Ponte Vedra Beach where water rises of 2 to 4 feet above ground level are possible along the immediate coastline and adjacent waterways.
A Tropical Storm Warning is in effect from north of Ocean Reef to south of Boca Raton, Florida and for Lake Okeechobee. A Tropical Storm Watch is in effect for Volusia/Flagler County Line to Ponte Vedra Beach, Florida.
Isaias’ Forecast Path
NHC forecasters noted, “On the forecast track, the center of Isaias will move near or over Andros Island in the Northwestern Bahamas this morning and continue to move near or over the rest of Northwestern Bahamas later today, and move near the east coast of the Florida peninsula tonight through Sunday (Aug. 1).”
NASA Researches Tropical Cyclones
Hurricanes/tropical cyclones are the most powerful weather events on Earth. NASA’s expertise in space and scientific exploration contributes to essential services provided to the American people by other federal agencies, such as hurricane weather forecasting.
For more than five decades, NASA has used the vantage point of space to understand and explore our home planet, improve lives and safeguard our future. NASA brings together technology, science, and unique global Earth observations to provide societal benefits and strengthen our nation. Advancing knowledge of our home planet contributes directly to America’s leadership in space and scientific exploration.
July 31, 2020 – NASA Examines Water Vapor and Structure in Hurricane Isaias
When NASA’s Aqua satellite passed over the North Atlantic Ocean, it gathered water vapor data on Isaias, while NASA-NOAA’s Suomi NPP satellite provided forecasters with a visible image that showed a more organized tropical cyclone.
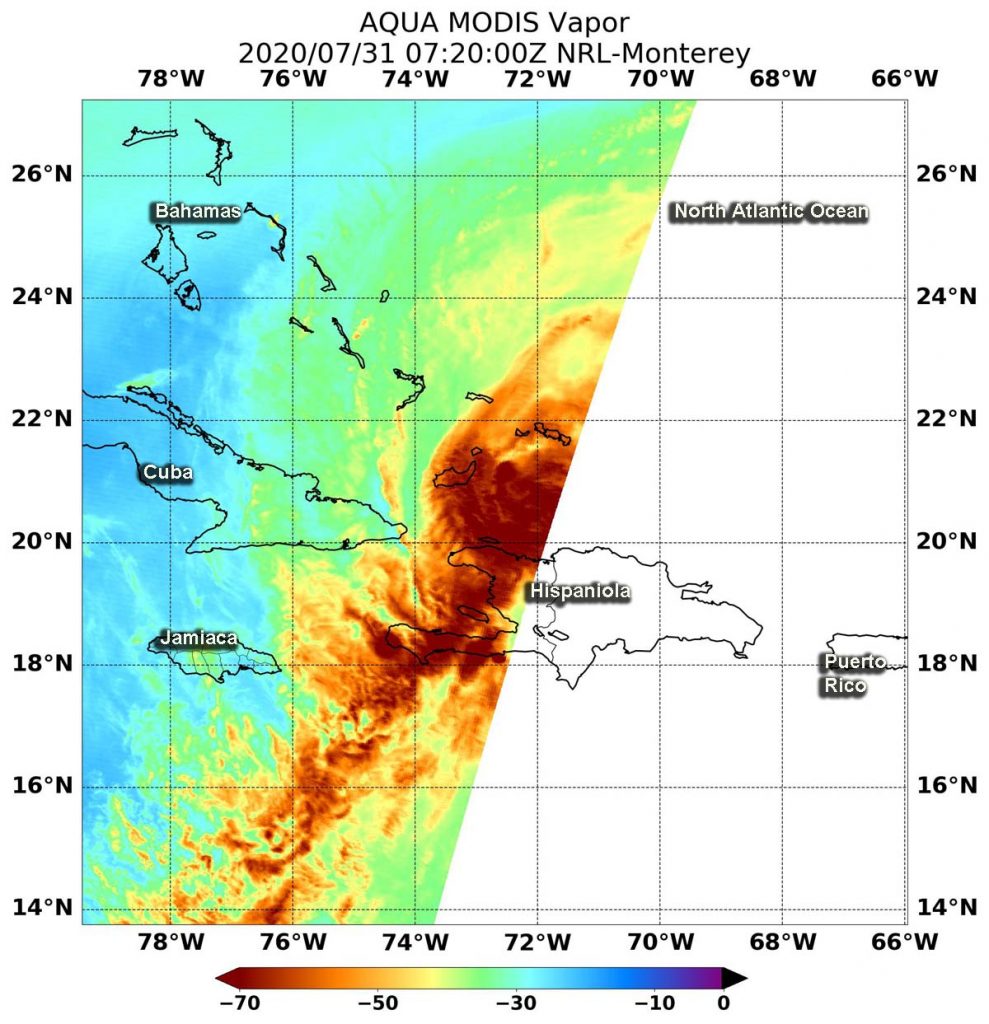
On July 31 at 3:20 a.m. EDT (0720 UTC), NASA’s Aqua satellite passed over Hurricane Isaias as it departed Hispaniola. Aqua found highest concentrations of water vapor (brown) and coldest cloud top temperatures were around the center. Credits: NASA/NRL
A Visible View of Isaias
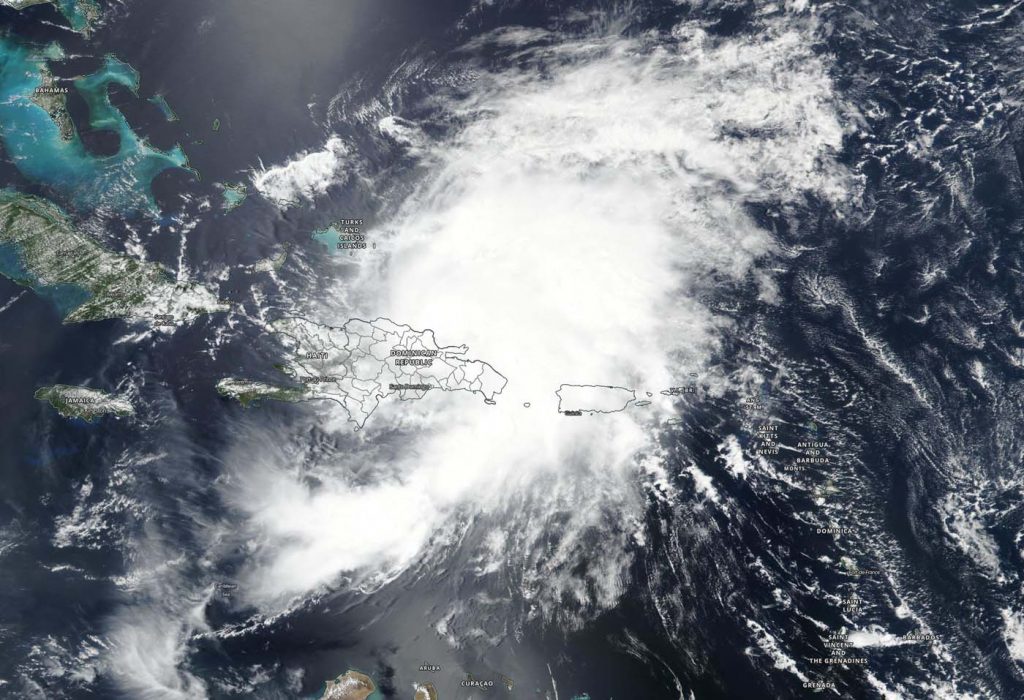
NASA-NOAA’s Suomi NPP satellite passed over the Atlantic Ocean during the afternoon on July 30, the Visible Infrared Imaging Radiometer Suite (VIIRS) instrument provided forecasters with a visible image of Isaias as it was intensifying. VIIRS revealed strong thunderstorms had circled the center of circulation. The image showed the center near the northeastern coast of the Dominican Republic and bands of thunderstorms from the eastern quadrant stretching over Puerto Rico. At the time of the image, Isaias had not yet reached Turks and Caicos. A thick band of thunderstorms from the center of circulation also stretched out in a southwesterly direction and over the Caribbean Sea.
On July 30, NASA-NOAA’s Suomi NPP satellite revealed strong thunderstorms circled the center of Isaias’ circulation. The center was near the northeastern coast of the Dominican Republic and bands of thunderstorms from the eastern quadrant stretching over Puerto Rico. A thick band of thunderstorms from the center of circulation also stretched out in a southwesterly direction and over the Caribbean Sea. Credit: NASA Worldview, Earth Observing System Data and Information System (EOSDIS)
Water Vapor Imagery Reveals Heavy Rainfall Potential
Water vapor analysis of tropical cyclones tells forecasters how much potential a storm has to develop. Water vapor releases latent heat as it condenses into liquid. That liquid becomes clouds and thunderstorms that make up a tropical cyclone. Temperature is important when trying to understand how strong storms can be. The higher the cloud tops, the colder and stronger the storms.
NASA’s Aqua satellite passed over Hurricane Isaias on July 31 at 3:20 a.m. EDT (0720 UTC), and the Moderate Resolution Imaging Spectroradiometer or MODIS instrument gathered water vapor content and temperature information. The MODIS image showed highest concentrations of water vapor and coldest cloud top temperatures were around the center of circulation and in a thick band of thunderstorms that extends southwest over western Hispaniola and into the Caribbean Sea. Those cloud top temperatures were as cold as or colder than minus 70 degrees Fahrenheit (minus 56.6 degrees Celsius) in those storms. Storms with cloud top temperatures that cold have the capability to produce heavy rainfall.
That rainfall potential is apparent in today’s forecast from the National Hurricane Center. NHC said the Dominican Republic and northern Haiti: 4 to 8 inches, with isolated maximum totals of 12 inches through Saturday. For the Bahamas, Turks and Caicos: 4 to 8 inches, and for Cuba: 1 to 2 inches, with isolated maximum totals of 4 inches.
Warnings and Watches on July 31, 2020
On July 31, NOAA’s National Hurricane Center (NHC) issued a Hurricane Warning for the northwestern Bahamas including Andros Island, New Providence, Eleuthera, Abacos Islands, Berry Islands, Grand Bahamas Island, and Bimini. It is also in effect for the southeastern Bahamas including the Acklins, Crooked Island, Long Cay, the Inaguas, Mayaguana, and the Ragged Islands; and for the central Bahamas, including Cat Island, the Exumas, Long Island, Rum Cay, and San Salvador.
A Tropical Storm Warning is in effect for the Dominican Republic entire southern and northern coastlines, and the Turks and Caicos Islands. In addition, a Tropical Storm Watch is in effect for the east coast of Florida from Ocean Reef to Sebastian Inlet and for Lake Okeechobee.
Isaias’ Status on July 31, 2020
At 8 a.m. EDT (1200 UTC) on July 31, NHC reported the center of Hurricane Isaias was located by NOAA and Air Force Reserve Hurricane Hunter aircraft near latitude 21.3 north, longitude 73.9 west. That puts the center about 30 miles (50 km) northwest of Great Inagua Island, and 340 miles (545 km) southeast of Nassau. Reports from the reconnaissance aircraft indicate that the minimum central pressure is 990 millibars.
Isaias was moving toward the northwest near 17 mph (28 kph), and a generally northwestward motion with some decrease in forward speed is expected for the next couple of days followed by a turn toward the north-northwest. Maximum sustained winds are near 80 mph (130 kph) with higher gusts. Some strengthening is possible today, and Isaias is expected to remain a hurricane for the next few days.
NOAA’s NHC Forecast for Isaias
On the forecast track, the center of Isaias will move near or over the southeastern Bahamas today. Isaias is forecast to be near the central Bahamas tonight, and move near or over the northwestern Bahamas and be near or east of the Florida peninsula on Saturday and Sunday.
Interests elsewhere along the southeast coast of the United States should monitor the progress of this system. Additional watches or warnings may be required for a portion of the Florida peninsula later today.
NASA Researches Tropical Cyclones
Hurricanes/tropical cyclones are the most powerful weather events on Earth. NASA’s expertise in space and scientific exploration contributes to essential services provided to the American people by other federal agencies, such as hurricane weather forecasting. NASA’s Aqua satellite is one in a fleet of NASA satellites that provide data for hurricane research.
For more than five decades, NASA has used the vantage point of space to understand and explore our home planet, improve lives and safeguard our future. NASA brings together technology, science, and unique global Earth observations to provide societal benefits and strengthen our nation. Advancing knowledge of our home planet contributes directly to America’s leadership in space and scientific exploration.
NASA-NOAA’s Suomi NPP satellite provided visible imagery of the development and movement of Tropical Storm Isaias is it moved into the eastern Caribbean Sea. NASA’s Aqua satellite provided temperature information that gave insight into Isaias’ rainmaking potential.
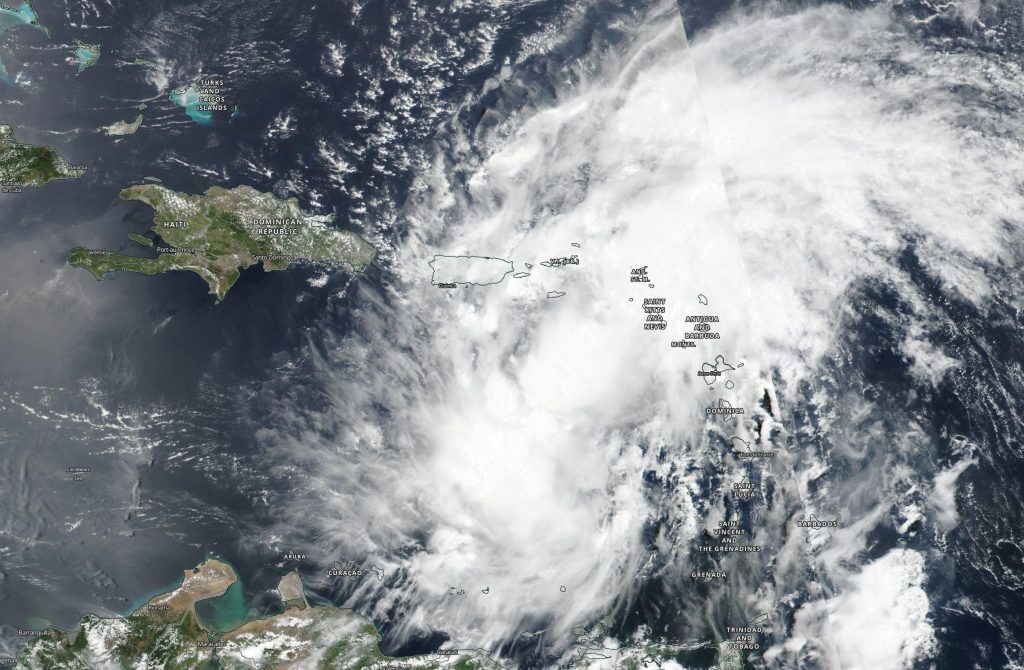
NASA-NOAA’s Suomi NPP satellite provided a visible image Tropical Storm Isaias after it formed in the eastern Caribbean Sea on July 29. Credit: NASA Worldview, Earth Observing System Data and Information System (EOSDIS)
The Visible Infrared Imaging Radiometer Suite (VIIRS) instrument aboard Suomi NPP provided a visible image of Potential Tropical Cyclone 9 on July 28. The storm developed into Tropical Storm Isaias on July 29. The imagery showed the broader circulation of the disturbance had become slightly better defined but at the time of the July 29 image, Air Force Reserve reconnaissance aircraft was still unable to find a well-defined circulation.
Later in the day, by 5 p.m. EDT, deep convection continued to increase and a band of thunderstorms developed over the southwestern portion of the broad circulation. By 11 p.m., the storm had developed into a tropical storm. The National Hurricane center noted, “Observations from recent scatterometer passes over the system show that it now has a sufficiently well-defined center to be designated as a tropical cyclone.”
Many Warnings and Watches in Effect
The National Hurricane Center (NHC) posted many watches and warnings as Isaias moved through the Caribbean Sea on July 30.
Animation of visible imagery from NASA-NOAA’s Suomi NPP satellite on July 28 and 29 as Potential Tropical Cyclone 9 developed into Tropical Storm Isaias in the eastern Caribbean Sea. Credit: NASA Worldview, Earth Observing System Data and Information System (EOSDIS)
A Tropical Storm Warning is in effect for Puerto Rico, Vieques, Culebra; the U.S. Virgin Islands; the Dominican Republic entire southern and northern coastlines; the north coast of Haiti from Le Mole St. Nicholas eastward to the northern border with the Dominican Republic; Turks and Caicos Islands; the southeastern Bahamas including the Acklins, Crooked Island, Long Cay, the Inaguas, Mayaguana, the Ragged Islands; the Central Bahamas, including Cat Island, the Exumas, Long Island, Rum Cay, and San Salvador.
A Tropical Storm Watch is in effect for the northwestern Bahamas including Andros Island, New Providence, Eleuthera, Abacos Islands, Berry Islands, Grand Bahamas Island, and Bimini.
NASA Infrared Data Reveals a Heavy Rainmaker
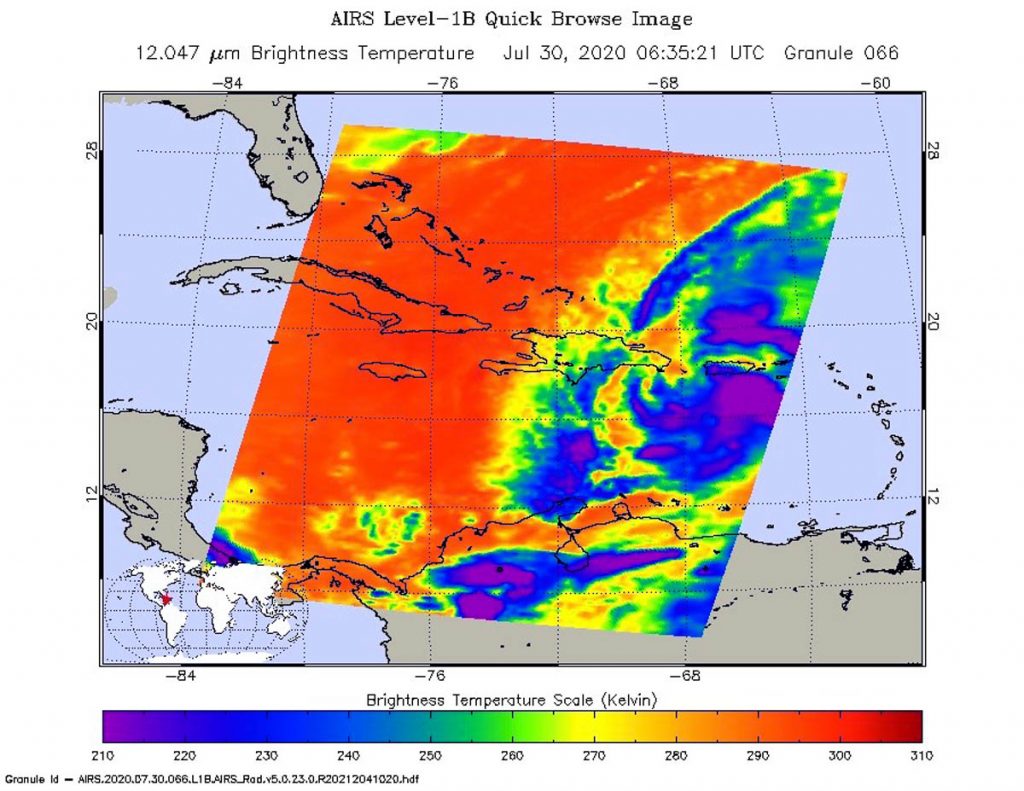
The AIRS instrument aboard NASA’s Aqua satellite captured a look at cloud top temperatures in Isaias and gave insight into the size of the large storm and its rainfall potential.
On July 30 at 2:35 a.m. EDT (0635 UTC) NASA’s Aqua satellite analyzed Isaias and found cloud top temperatures as cold as or colder than (purple) minus 63 degrees Fahrenheit (minus 53 degrees Celsius). Credit: NASA JPL/Heidar Thrastarson
Cloud top temperatures provide information to forecasters about where the strongest storms are located within a tropical cyclone. Tropical cyclones do not always have uniform strength, and some sides have stronger sides than others. The stronger the storms, the higher they extend into the troposphere, and the colder the cloud temperatures. NASA provides that data to forecasters at NOAA’s National Hurricane Center or NHC so they can incorporate in their forecasting.
On July 30 at 2:35 a.m. EDT (0635 UTC) NASA’s Aqua satellite analyzed the storm using the Atmospheric Infrared Sounder or AIRS instrument. AIRS found coldest cloud top temperatures as cold as or colder than minus 63 degrees Fahrenheit (minus 53 degrees Celsius). NASA research has shown that cloud top temperatures that cold indicate strong storms that have the capability to create heavy rain.
Rainfall Forecast from NHC
NASA’s AIRS data, combined with other data is used by NHC in their forecasts. NHC said Isaias is expected to produce the following rain accumulations:
In Puerto Rico, the Dominican Republic and northern Haiti: 4 to 8 inches, with isolated maximum totals of 10 inches.
In the Bahamas, Turks and Caicos: 4 to 8 inches.
In Cuba: 1 to 2 inches, with isolated maximum totals of 4 inches.
These rainfall amounts will lead to life-threatening flash flooding and mudslides, as well as river flooding. Urban and small stream flooding is expected for the U.S. Virgin Islands, eastern and southwestern Puerto Rico, and Hispaniola. Heavy rains associated with Isaias may begin to affect South Florida Saturday morning. This rain could result in isolated flash and urban flooding, especially in low-lying and poorly drained areas.
Isaias’ Status on July 30
By 11 a.m. EDT on July 30, Isaias had moved northwest and was bringing heavy rain and gusty winds to Puerto Rico. The rainfall was producing life-threatening flash flooding. Heavy rains and gusty winds were also spreading over the Dominican Republic.
The center of Tropical Storm Isaias was located near latitude 18.1 degrees north and longitude 68.9 degrees west. That is 50 miles (75 km) southwest of Punta Cana, Dominican Republic. Isaias was moving toward the northwest near 20 mph (31 kph), and a west-northwestward to northwestward motion with some decrease in forward speed is expected over the next couple of days.
Maximum sustained winds are near 60 mph (95 kph) with higher gusts. Some slight weakening is possible as Isaias moves over Hispaniola today. Re-strengthening is forecast on Friday into Friday night. Tropical-storm-force winds extend outward up to 310 miles (500 km) primarily to the north of the center. Tropical-storm-force winds are occurring along the southern coast of Puerto Rico. The estimated minimum central pressure is 1003 millibars.
Forecast for Isaias
On the forecast track, the center of Isaias will move over Hispaniola today, July 30, and move near the Southeastern Bahamas by tonight or early Friday. Isaias is forecast to be near the Central Bahamas Friday night and approach the Northwest Bahamas or southern Florida Friday night and Saturday, August 1.
For more than five decades, NASA has used the vantage point of space to understand and explore our home planet, improve lives and safeguard our future. NASA brings together technology, science, and unique global Earth observations to provide societal benefits and strengthen our nation. Advancing knowledge of our home planet contributes directly to America’s leadership in space and scientific exploration