Sep. 01, 2019 – Update #2 – 10:35 am EDT – Dorian Intensifying Again With Winds Picking Up Speed
The National Hurricane Center (NHC) put out another update advisory at 9:30 am EDT on Sep. 01, 2019 as Hurricane Dorian intensified again.
Data from an Air Force Reserve Hurricane Hunter aircraft indicate
that Dorian has continued to intensify, and now has maximum
sustained winds near 175 mph (280 km/h) and wind gusts over 200 mph. Storm surge of 15 to 20 feet above normal tides with higher destructive waves. There is a minimum central pressure of 922 mb (27.23 inches).
The eyewall of catastrophic Hurricane Dorian is currently reaching
the Abaco Islands. This is a life-threatening situation. Residents
there should take immediate shelter. The NHC urges: “Do not venture into the eye if it passes over your location. These hazards will cause extreme destruction in the affected areas. and will continue for several hours.”
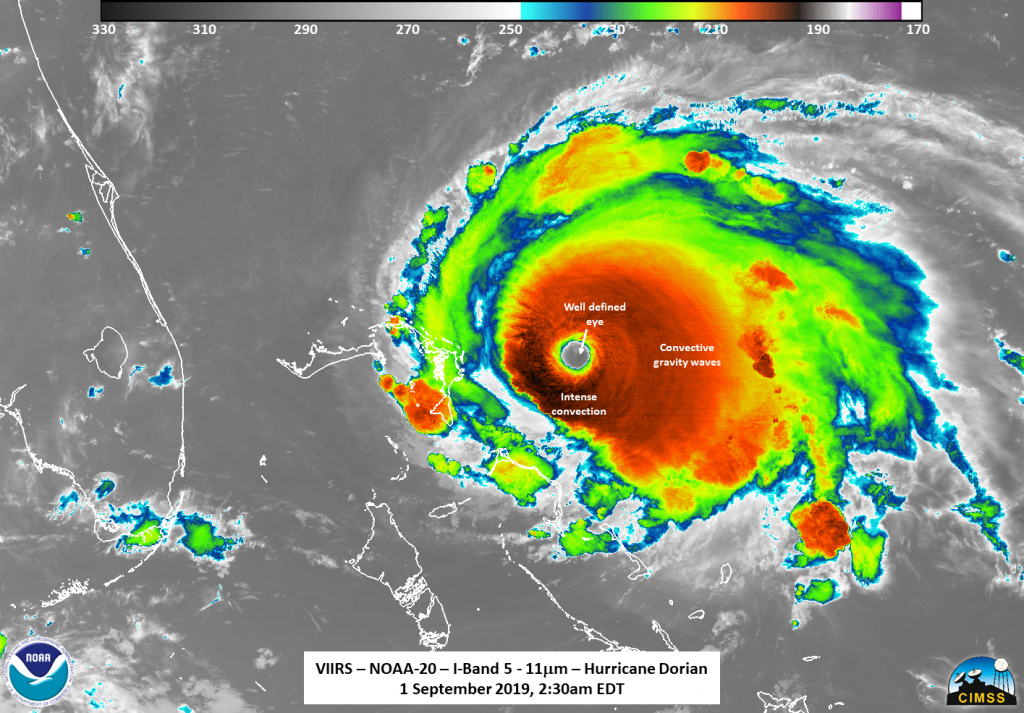
The NOAA-20 satellite observed Dorian’s continued intensification in this satellite image which was captured on Sep. 01, 2019 at 2:30 am EDT.
NOAA-20 flew over Dorian not quite looking straight down. As with previous nights, the infrared imagery continued to show convective gravity waves and a well-defined eye. However, unlike previous nights, the cirrus blowoff was not present. Rather it was replaced by the classic “buzzsaw” type cloud commonly seen in very intense tropical storms. This Day Night Band imagery continues to show the structure of Dorian quite well along with mesospheric gravity waves being flung far away from the storm as well as a lone lightning streak well on the southern part of the storm. Credit: NASA/NOAA/UWM-SSEC-CIMSS/William Straka III
Sept. 01, 2019 – Update #1 – NASA Satellites Monitor Progress as Hurricane Dorian Reaches Dangerous Category 5 Status
The National Hurricane Center’s (NHC) 8:00 am EDT advisory reports that Hurricane Dorian has reached Category 5 status on the Saffir-Simpson Hurricane Wind scale. Data from an Air Force Hurricane Hunter plane which just penetrated the eye of Dorian indicate that the maximum sustained winds have increased to near 160 mph (260 km/h) with higher gusts. Devastating hurricane conditions are expected in the Abacos Islands very soon and these conditions will spread across Grand Bahama Island later today.
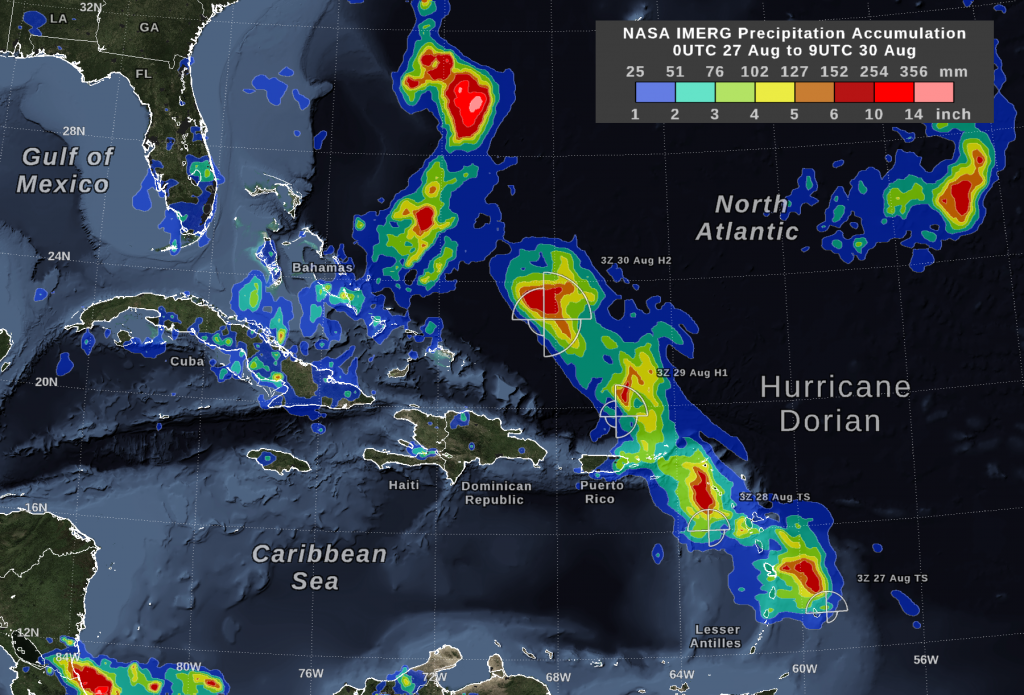
As of Saturday, August 31, Hurricane Dorian’s (still a Category 4 storm at the time) rain field had changed. During its early days near Puerto Rico, Dorian’s inner-core rain rate had peaked once every 24 hours, but during the most recent two days, Dorian’s rain rate has been persistently heavy. Heavy precipitation under the eyewall suggests that a great deal of energy is being released in the atmosphere, which is the fuel that allows a hurricane to sustain or increase its wind intensity. The graphic also shows the distance that tropical-storm force (39 mph) winds extend from Hurricane Dorian’s low-pressure center, as reported by the National Hurricane Center. The symbols H and TS represent a hurricane of various Saffir-Simpson categories or a tropical storm, respectively. Visualization by NASA Goddard.
As of Saturday, August 31, Hurricane Dorian’s rain field had changed. During its early days near Puerto Rico, Dorian’s inner-core rain rate had peaked once every 24 hours, but during the most recent two days, Dorian’s rain rate has been persistently heavy. Heavy precipitation under the eyewall suggests that a great deal of energy is being released in the atmosphere,
which is the fuel that allows a hurricane to sustain or increase its wind intensity.
These rain estimates come from the Global Precipitation Measurement mission (GPM)’s NASA IMERG algorithm, which combines observations from a fleet of satellites, in near-realtime, to provide global estimates of precipitation every 30 minutes. The storm-total rainfall at a particular location varies with the forward speed of the hurricane, with the size of the hurricane’s wind field, and with how vigorous the updrafts are inside of the hurricane’s eyewall.
NASA’s Aqua satellite also was providing scientists with data about the storm when it passed overhead on Aug. 31, 2019.
On Aug. 31 at 2:17a.m. EDT (0617 UTC), the AIRS instrument aboard NASA’s Aqua satellite analyzed cloud top temperatures of Tropical Storm Dorian in infrared light. AIRS found coldest cloud top temperatures (purple) of strongest thunderstorms were as cold as or colder than minus 63 degrees Fahrenheit (minus 53 degrees Celsius). The area of very cold temperatures is extremely large around the eye indicating greater intensity. Credit: NASA JPL/Heidar Thrastarson
This image, captured by NASA’s Aqua satellite at 2:17 am EDT the morning of the 31st, shows incredibly cold temperatures in the cloudtops of the storm. The area of purple, the coldest temperatures, extends out widely from the very distinct eye of the hurricane. The stronger the storms, the higher they extend into the troposphere, and the colder the cloud temperatures become so the AIRS instrument gives a good picture to scientists of the strength of the storm.
The NHC has reported that hurricane-force winds extend outward up to 30 miles (45 km) from the center, and tropical-storm-force winds extend outward up to 105 miles (165 km). Elbow Cay in the Abaco Islands just reported winds of 35 mph (56 km/h). The minimum central pressure just measured by an Air Force plane has dropped to 927 mb (27.37 inches).
The following information is directly from the National Hurricane Center’s 8:00 am EDT advisory:
“A Hurricane Warning is in effect for…* Northwestern Bahamas excluding Andros Island
A Hurricane Watch is in effect for…* Andros Island
A Tropical Storm Warning is in effect for…* North of Deerfield Beach to Sebastian Inlet
A Tropical Storm Watch is in effect for…* North of Golden Beach to Deerfield Beach
A Hurricane Warning means that hurricane conditions are expected
somewhere within the warning area. Preparations to protect life and
property should be rushed to completion.
A Hurricane Watch means that hurricane conditions are possible within the watch area.
A Tropical Storm Warning means that tropical storm conditions re expected within the warning area within 36 hours.
A Tropical Storm Watch means that tropical storm conditions are possible within the watch area, generally within 48 hours.
Interests elsewhere in southern and central Florida should continue to monitor the progress of Dorian. Additional watches or warnings may be required for portions of the east coast of Florida today.
For storm information specific to your area in the United States, including possible inland watches and warnings, please monitor products issued by your local National Weather Service forecast office. For storm information specific to your area outside of the United States, please monitor products issued by your national meteorological service.
Tropical storm conditions are expected within the tropical storm warning area on Monday.
Tropical storm conditions are possible within the tropical storm watch area by Monday night.
STORM SURGE: A life-threatening storm surge will raise water levels by as much as 15 to 20 feet above normal tide levels in areas of onshore winds on the Abaco Islands and Grand Bahama Island. Near the coast, the surge will be accompanied by large and destructive waves.
RAINFALL: Dorian is expected to produce the following rainfall totals through late this week:
Northwestern Bahamas…12 to 24 inches, isolated 30 inches.
Coastal Carolinas…5 to 10 inches, isolated 15 inches.
Central Bahamas and the Atlantic Coast from the Florida peninsula
through Georgia…2 to 4 inches, isolated 6 inches.
This rainfall may cause life-threatening flash floods.
SURF: Large swells will affect the east-facing shores of the Bahamas, the Florida east coast, and the southeastern United States coast during the next few days. These swells are likely to cause life-threatening surf and rip current conditions. Please consult products from your local weather office.”
Aug. 31, 2019 – Update #2 – NASA Watches as Category 4 Hurricane Dorian Still Heads for Northwestern Bahamas
The latest National Hurricane Center (NHC) advisory has Hurricane Dorian on a collision course with the northwestern Bahamas sometime on Sunday and moving near the Florida east coast late Monday into Tuesday. Still a Category 4 some fluctuations in intensity are likely within the storm, but Dorian is expected to remain a powerful hurricane during the next
few days.
NOAA-NASA’s Suomi NPP satellite, GCOM-W1 and NOAA-20 all passed over Dorian in that order, right around the 2:00 am EDT NHC advisory, each observing unique features.
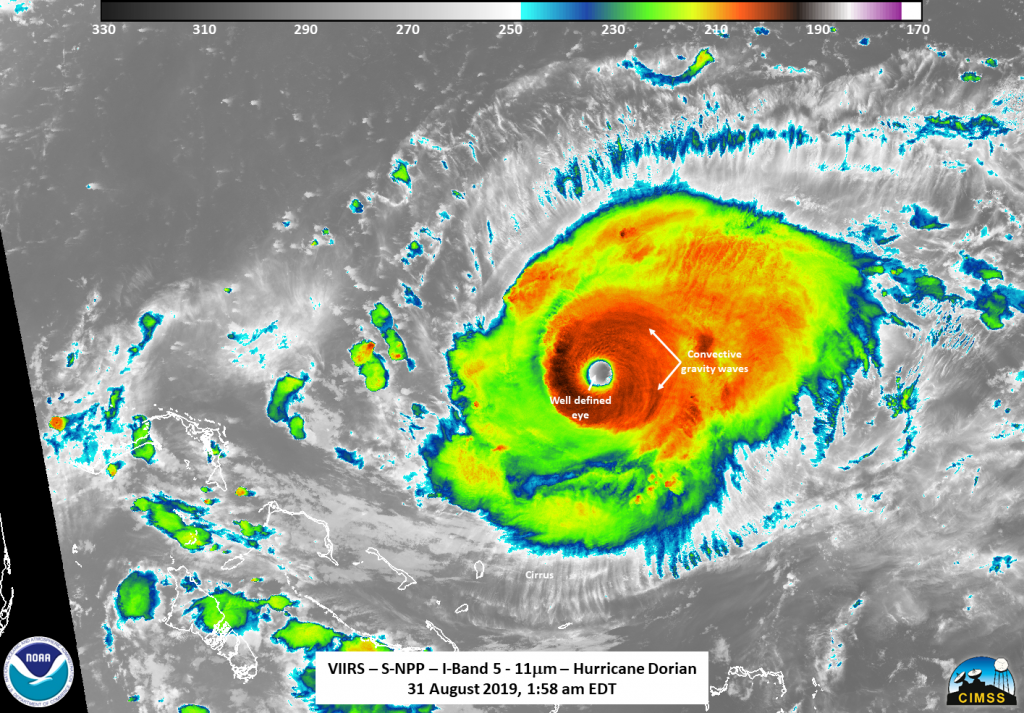
At 1:58 am EDT (0558 UTC) Suomi NPP caught Dorian on the west side of the scan showing a well-defined eye that can be easily seen along with different cloud bands as well as a lone lightning strike within the storm in the southern portion. Infrared imagery also spotted tropospheric convective gravity waves flowing away from the intense storm. Credit: NASA/NOAA/UWM-SSEC-CIMSS/William Straka III
At 1:58 am EDT (0558 UTC) on Aug. 31, 2019, Suomi NPP caught Dorian on the west side of the scan showing a well-defined eye that can be easily seen along with different cloud bands. A lone lightning strike is seen within the storm in the southern portion. Infrared imagery also spotted tropospheric convective gravity waves flowing away from the intense storm. The NHC remarked at 2:00 pm EDT (1800 UTC) that Hurricane Dorian was exhibiting a very distinct eye 15 nautical miles across.
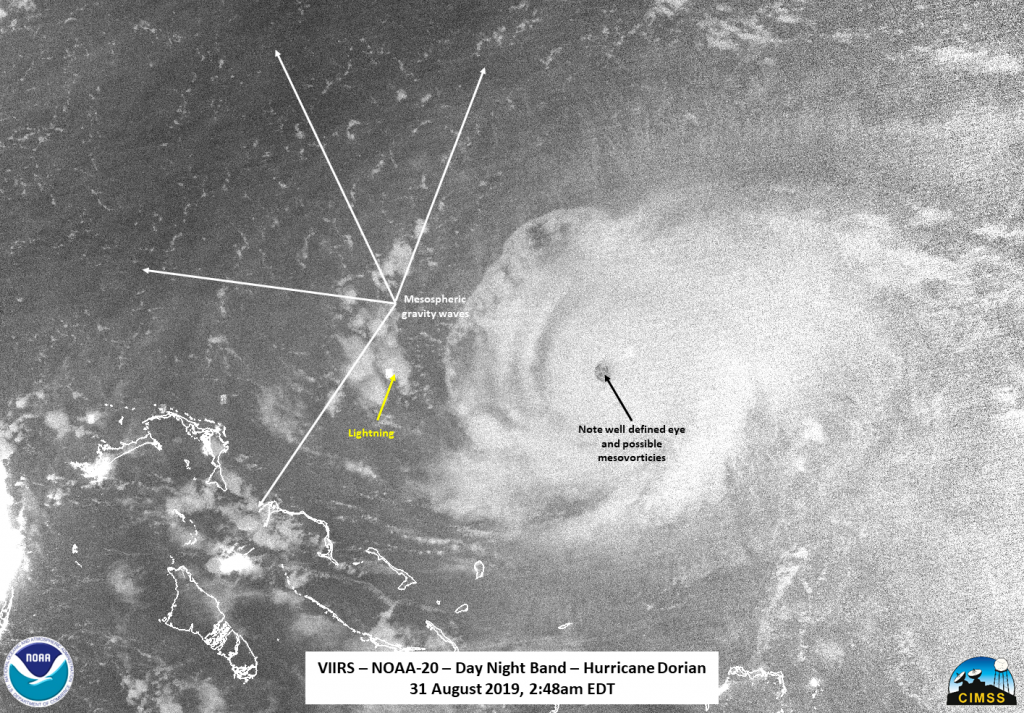
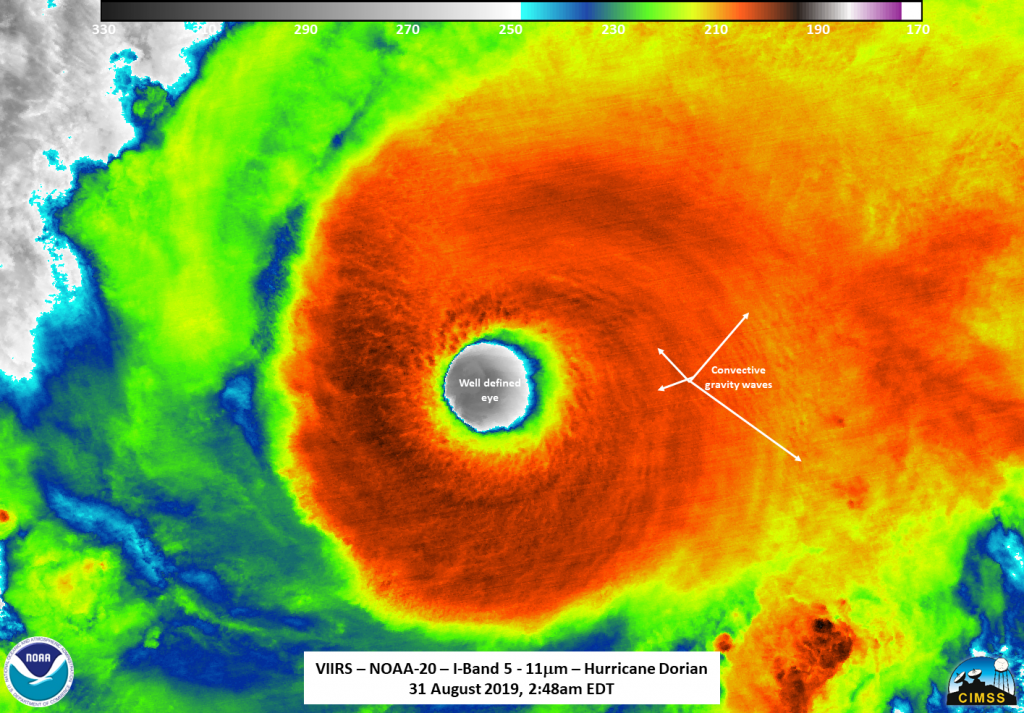
At 2:48 am EDT (0648 UTC), NOAA-20 flew over Dorian close to top down. The infrared imagery continues to show the convection gravity waves consistent with an intense storm. Lightning is also seen in this image as well as the mesospheric gravity waves of a powerful storm. Credit: NASA/NOAA/UWM-SSEC-CIMSS/William Straka III
Roughly 50 minutes later at 2:48 am EDT (0648 UTC), NOAA-20 flew over Dorian close to top-down. The infrared imagery continues to show convection gravity waves consistent with an intense storm. The successive passes showed the rotation of the storm at high resolution. The zoomed out Day Night Band imagery showed the structure of Dorian quite well, even though there was no moonlight present, along with mesospheric gravity waves being flung far away from the storm.
NOAA-20 shows the distinctive well-defined eye of a powerful Category 4 hurricane in this image taken at 2:48 am EDT on August 31, 2019. Credit: NASA/NOAA/UWM-SSEC-CIMSS/William Straka III
It is only when a storm is well developed that the refined eye appears giving forecasters an idea of the center of circulation. Aircraft and dropsonde information also provide crucial information about the surrounding environment of the storm, albeit at select points within the storm.
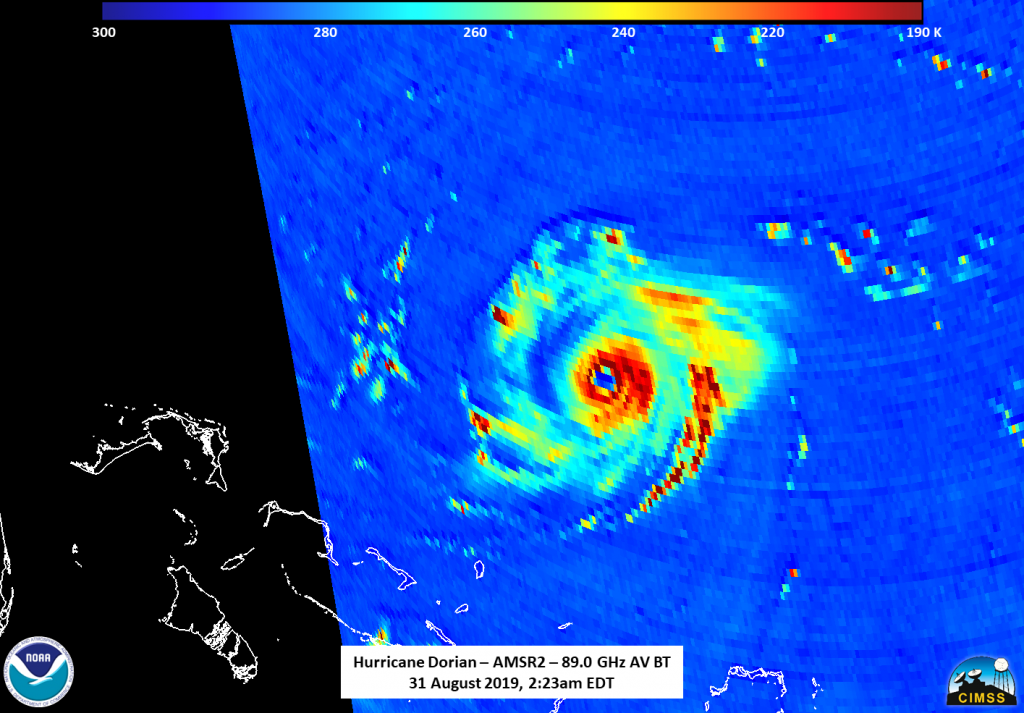
The Global Change Observation Mission – Water “Shizuku” satellite’s AMSR2 instrument captured this image of Dorian’s well-defined eye as well as hints of maybe a secondary set of convection about halfway around the inner eye, possibly catching one of the eyewall replacement cycles. Credit: NASA/NOAA/UWM-SSEC-CIMSS/William Straka III
At 2:23 am EDT the AMSR2 instrument on the Global Change Observation Mission – Water “Shizuku” satellite (GCOM-W1), a Japan Aerospace Exploration Agency satellite, caught Dorian on the western side of the scan and the well-defined eye was evident as well as hints of perhaps a secondary set of convection about halfway around the inner eye. While nothing was mentioned about an eyewall replacement occurring in the 5am NHC advisory it is possible that the Advanced Microwave Scanning Radiometer 2 (AMSR2) caught one of the eyewall replacement cycles.
Dorian is currently located latitude 26.1N and longitude 73.9W about 205 miles (325 hkm) east of Great Abaco in the Bahamas and about 385 miles (625 km) east of West Palm Beach, FL. The Air Force reconnaissance plane recorded the maximum sustained winds remain consistent at 150 mph (240 km/h). As a point of comparison Category 5 strength winds begin at 157 mph (251 km/h). Hurricane Dorian’s movement has slowed to 8 mph (13 km/h) which gives this storm more time over open warm waters to continue to gain strength. The barometric pressure is steady at 945 mb.
Hurricane-force winds extend outward up to 30 miles (45 km) from the center and tropical-storm-force winds extend outward up to 115 miles (185 km).
Aug. 31, 2019 – Update #1 – NASA Satellites Following Hurricane Dorian On Its Trek Westward
On Friday evening of Aug. 30, Dorian attained Category 4 status on the Saffir-Simpson Hurricane Wind Scale which means the storm is packing 130 – 156 mph (209-251 km/h) winds. The second change in the storm was the turn it took during the nighttime hours which now has the storm potentially not making direct landfall on Florida but rather Georgia and the Carolinas. However, it should be noted that this track could change once again. According to the National Hurricane Center (NHC): “Significant impacts could also occur even if the center of Dorian stays offshore. With the change in the forecast, the risk of strong winds and life-threatening storm surge is increasing along the coasts of Georgia and South Carolina during the middle of next week.”
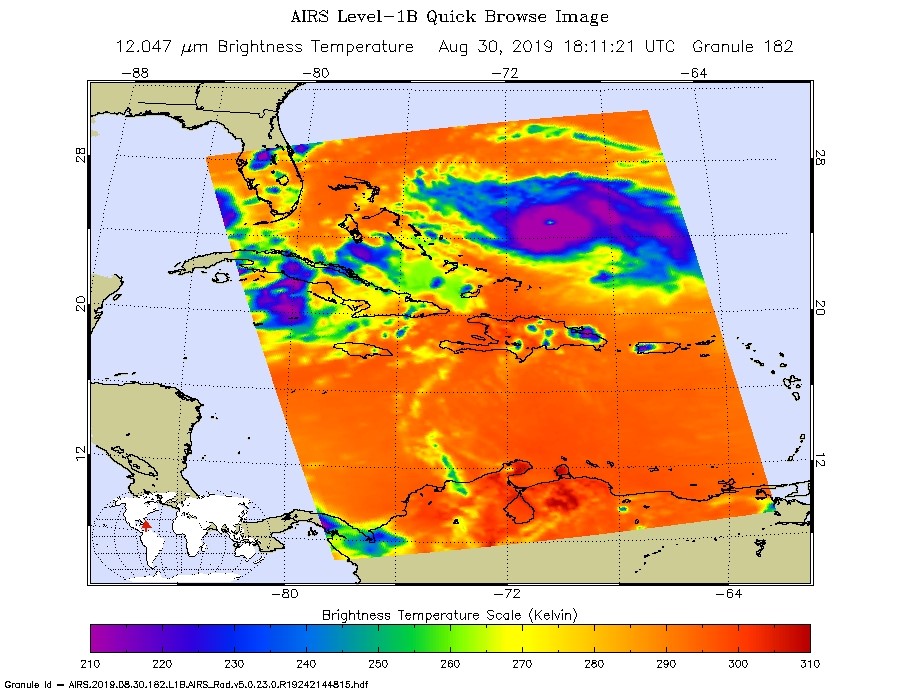
On Aug. 30 at 2:11 p.m. EDT (1811 UTC), the AIRS instrument aboard NASA’s Aqua satellite analyzed cloud top temperatures of Tropical Storm Dorian in infrared light. AIRS found coldest cloud top temperatures (purple) of strongest thunderstorms were as cold as or colder than minus 63 degrees Fahrenheit (minus 53 degrees Celsius). Credit: NASA JPL/Heidar Thrastarson
NASA’s Aqua satellite was on duty measuring the cloudtop temperatures in the powerful storm on Aug. 30, 2019. These very cold clouds with temperatures as cold or colder than minus 63 degrees Fahrenheit are tightly wound in a large area around the very well defined eye of the storm. Cloud top temperatures that cold indicate strong storms with the potential to generate heavy rainfall.
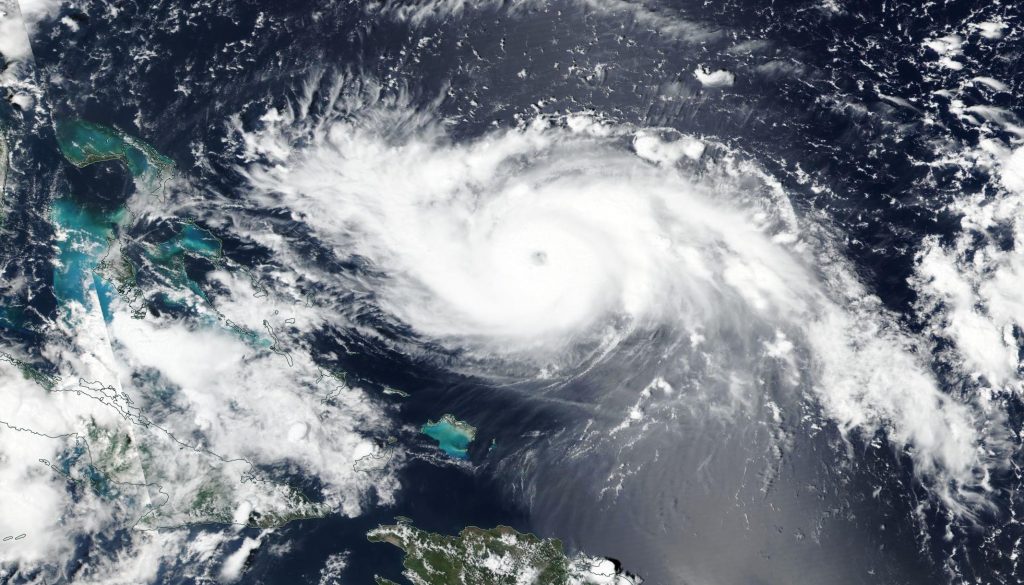
NOAA-NASA’s Suomi NPP satellite captured this visible light image of Hurricane Dorian on Aug. 30, 2019 as it was just north of Turks and Caicos and heading towards the northwestern Bahamas. Credit: NASA Worldview, Earth Observing System Data and Information System (EOSDIS).
NASA’s Earth Observing System Data and Information System (EOSDIS) Worldview application provides the capability to interactively browse over 700 global, full-resolution satellite imagery layers and then download the underlying data. Many of the available imagery layers are updated within three hours of observation, essentially showing the entire Earth as it looks “right now.” This natural-color image was collected by NOAA-NASA’s Suomi NPP satellite on Aug. 30, 2019.
The NHC’s analysis of the storm which was released it 8am on Aug. 31, 2019 has Dorian gaining strength and moving westward. Its current location is latitude 25.8N and longitude 73.0W which is about 445 miles (713 km) east of West Palm Beach, FL and 280 miles (450 km) east of the northwestern Bahamas. Its maximum sustained winds are 145 mph (230 km/h) which puts it well into Category 4 status. Dorian is moving west at 12 mph. The barometric pressure inside the storm has dropped to 944 mb.
Hurricane-force winds extend outward up to 30 miles (45 km) from the center and tropical-storm-force winds extend outward up to 105 miles (165 km).
The International Space Station captured this stunning image of Hurricane Dorian from space on August 30, 2019. Credit: NASA
A Hurricane Warning is in effect for…
* Northwestern Bahamas excluding Andros Island
A Hurricane Watch is in effect for…
* Andros Island
Hurricane conditions are expected in the hurricane warning area across the northwestern Bahamas by Sunday, with tropical storm winds beginning tonight.
The NHC will release its next complete advisory at 11am EDT. For more information on this storm visit: https://www.nhc.noaa.gov
Aug. 30, 2019 – Update #3 -NASA Satellites On-Hand As Dorian Becomes a Category 3 Hurricane
As Hurricane Dorian was upgraded to a Category 3 hurricane on the Saffir-Simpson Hurricane Wind Scale, NASA’s fleet of satellites were gathering data during the day to assist weather forecasters and scientists. At 2:oo pm EDT the National Hurricane Center (NHC) posted a supplemental advisory. NHC reports that “extremely dangerous Hurricane Dorian poses a significant threat to Florida and the northwestern Bahamas. The Hurricane Hunter plane finds Dorian is now a major hurricane.”
As of early on August 30, Hurricane Dorian has been producing 2 to 6 inches of rain along the path of its inner core for several days. This estimate come from the NASA IMERG algorithm, which combines observations from a fleet of satellites, in near-realtime, to provide global estimates of precipitation every 30 minutes. The storm-total rainfall at a particular location varies with the forward speed of the hurricane, with the size of the hurricane’s wind field, and with how vigorous the updrafts are in the hurricane’s eyewall. The graphic also shows the distance that tropical-storm force (39 mph) winds extend from the Hurricane Dorians low-pressure center, as reported by the National Hurricane Center. The symbols H2, H1, and TS represent category 2 hurricane, category 1 hurricane, and tropical storm, respectively. Visualization by NASA Goddard.
NASA’s Global Precipitation Measurement mission satellite uses its IMERG algorithm with data from a fleet of satellites to provide global estimates of the precipitation within the storm every 30 minutes. This map displays the estimated rainfall accumulation for the region from August 27th – August 30th, prior to Dorian becoming a Category 3 storm.
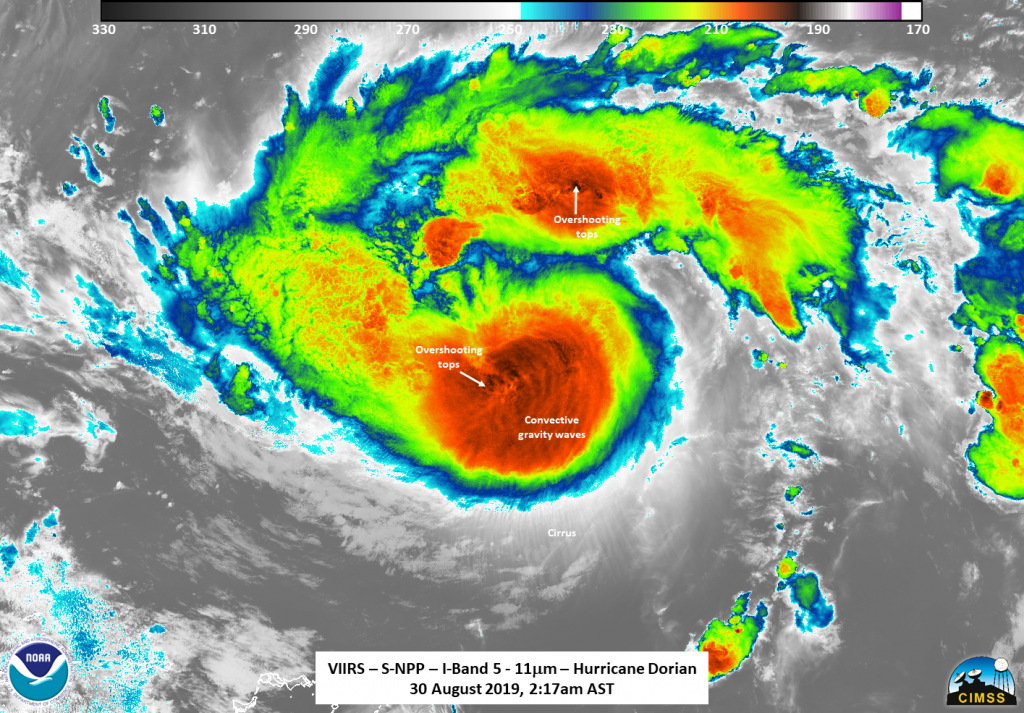
NOAA-NASA’s Suomi NPP satellite uses its complement of instruments onboard to dissect storms and provide information on many different aspects of the hurricane including storm strength, cloudtop temperature, circulation, and rainfall, among others, within the structure of the storm. The next three images are all from the Suomi NPP satellite and its instruments which help scientists figure out the intensity of the storm and help predict where it will ultimately end up.
NASA/NOAA’s Suomi NPP satellite was in an ideal position for observing Dorian at 0617 UTC (2:17 am EDT) at an almost nadir view (right over the storm). The infrared imagery showed a somewhat circular storm, though a bit lopsided. However, the convection was strong enough to result in several overshooting tops and tropospheric gravity waves are atmospheric waves (in this observation from the troposphere) that are produced by strong thunderstorms near the eye and radiate outward in expanding spirals giving forecasters and scientists a good indicator of the strength of the storm. This top-down view of Dorian allowed the microwave sounder to observe the inner structure of the storm. Credit: NASA/NOAA/UWM-SSEC-CIMSS/William Straka III
Hurricane Dorian is currently at latitude 24.8N and longitude 70.3W which is about 445 miles (715 km) east of the northwestern Bahamas and about 625 miles (1005 km) east of West Palm Beach, FL. The NHC forecast is: “A slower west-northwestward to westward motion should begin tonight and continue into early next week. On this track, the core of Dorian should move over the Atlantic well north of the southeastern and central Bahamas today and tomorrow, be near or over the northwestern Bahamas on Sunday, and be near the Florida peninsula late Monday.”
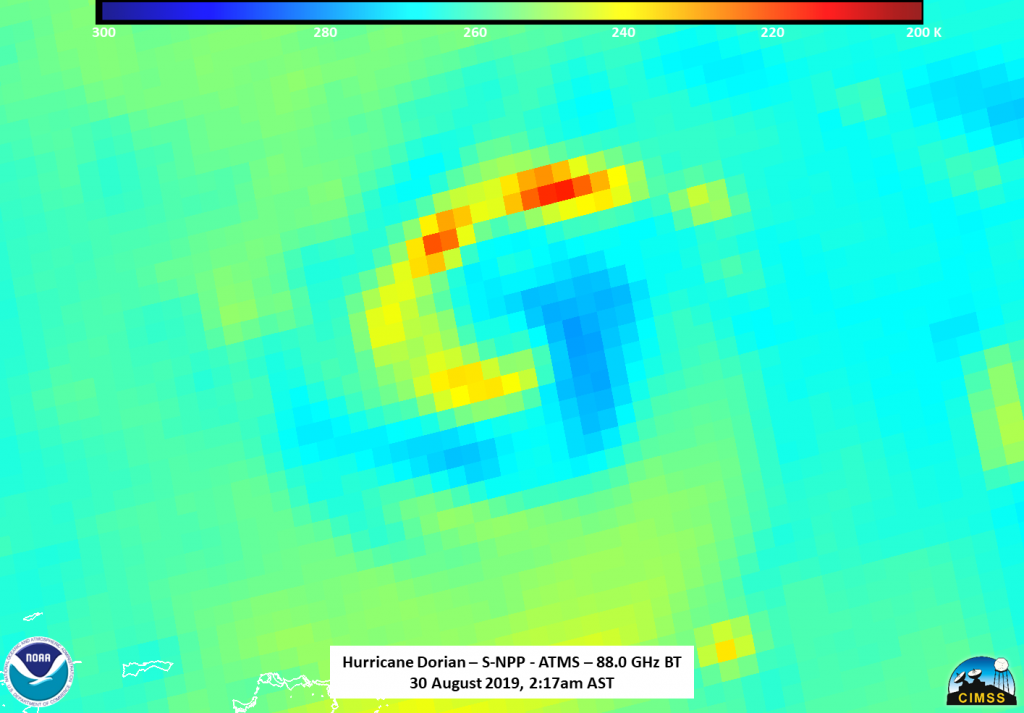
From the 88.2GHz BT, the circulation of the storm is easily seen with the convection showing colder temperatures. Credit: NASA/NOAA/UWM-SSEC-CIMSS/William Straka III
Currently the storm’s maximum sustained winds are 115 mph (185 km/h) with higher gusts, and is moving northwest at 10 mph (17 km/h). Hurricane-force winds extend outward up to 25 miles (35 km) from the center and tropical-storm-force winds extend outward up to 105 miles (165 km). The minimum central pressure is 970 mb.
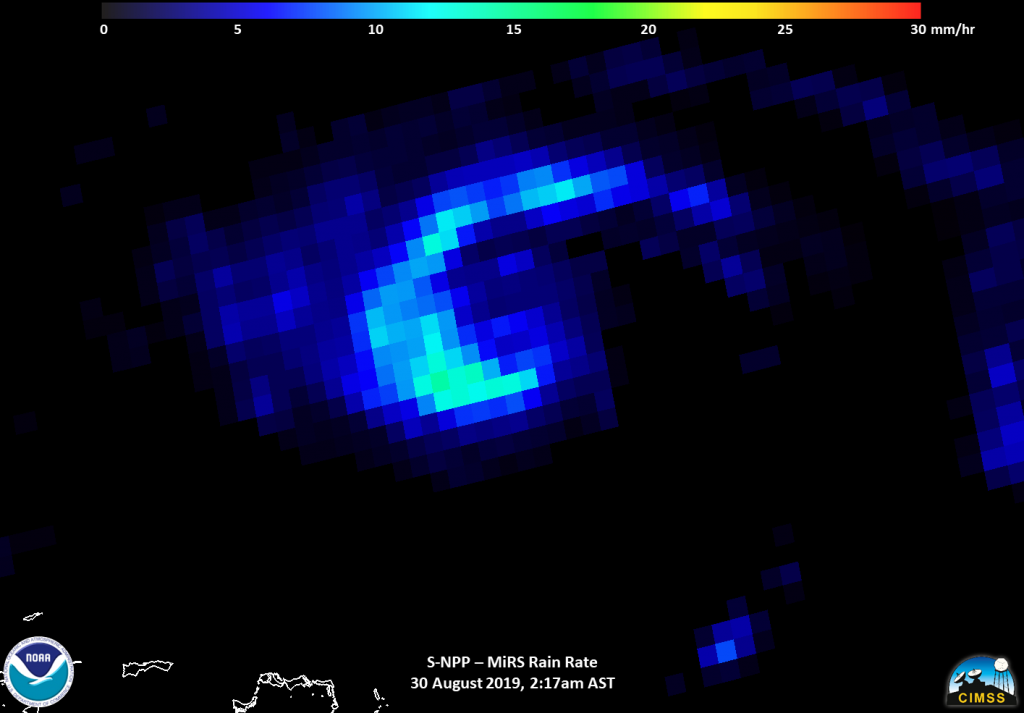
Suomi NPP’s MiRS instrument provided the rain rate and also showed the rain wrapping into the circulation center. Credit: NASA/NOAA/UWM-SSEC-CIMSS/William Straka III
The summary of watches and warnings in effect have not changed since the last NHC update at 11:00 am EDT.
Aug. 30, 2019 – Update #2 – Hurricane Dorian Marching Slowly Across Atlantic
The National Hurricane Center (NHC) in Miami reports that an Air Force plane is finding Dorian a “little stronger” as of the 8:00am EDT advisory put out today, Aug. 30, 2019. Data from an Air Force Reserve reconnaissance aircraft indicate that maximum sustained winds have increased to near 110 mph (175 km/h) with higher gusts. That is in keeping with what weather forecasters are predicting for the storm.
On Aug. 29 at 1:29 p.m. EDT (1729 UTC), the AIRS instrument aboard NASA’s Aqua satellite analyzed cloud top temperatures of Tropical Storm Dorian in infrared light. AIRS found coldest cloud top temperatures (purple) of strongest thunderstorms were as cold as or colder than minus 63 degrees Fahrenheit (minus 53 degrees Celsius). Credit: NASA JPL/Heidar Thrastarson
On Aug. 29, 2019, NASA’s Aqua satellite captured this infrared image with the AIRS instrument which analyzed cloud top temperatures in the storm. The coldest temperatures AIRS found were in the center of the storm where the strongest thunderstorms are found. These storms were as cold as or colder than minus 63 degrees Fahrenheit (minus 53 degrees Celsius). NASA research has found that cloud top temperatures that cold indicate strong storms with the potential to generate heavy rainfall.
At 8:00 am EDT (1200 UTC), the NHC reported that “the the center of Hurricane Dorian was located near latitude 24.2 North, longitude 69.4 West. Dorian is moving toward the northwest near 12 mph (19 km/h), and this motion is expected to continue through today. A slower west-northwestward to westward motion is forecast to begin tonight and continue through the weekend. On this track, Dorian should move over the Atlantic well east of the southeastern and central Bahamas today, approach
the northwestern Bahamas Saturday, and move near or over portions of
the northwestern Bahamas on Sunday.”
Dorian is expected to strengthen during the next few days, and become a major hurricane later today (Aug. 30). Dorian is likely to remain an extremely dangerous hurricane while it moves near the northwestern Bahamas and approaches the Florida peninsula through the weekend.
Currently hurricane-force winds extend outward up to 25 miles (35 km) from the center, and tropical-storm-force winds extend outward up to 105
miles (165 km). Yesterday the barometric pressure inside the storm was 991 mb. Today the minimum central pressure just reported by the Air Force reconnaissance plane was 972 mb (28.70 inches). The lower the barometric pressure in hurricanes, the higher the wind speeds— and the more dangerous the storm.
Hurricane conditions are possible within the watch area by Sunday, with tropical storm conditions possible by Saturday night or Sunday morning.
A life-threatening storm surge will raise water levels by as much as 10 to 15 feet above normal tide levels in areas of onshore winds in the northwestern Bahamas. Near the coast the surge will be accompanied by large and destructive waves.
Dorian is expected to produce the following rainfall accumulations this weekend into the middle of next week:
Northwestern Bahamas and coastal sections of the Southeast United States…6 to 12 inches, isolated 15 inches.
Central Bahamas…1 to 2 inches, isolated 4 inches.
This rainfall may cause life-threatening flash floods.
Swells are likely to begin affecting the east-facing shores of the Bahamas and the southeastern United States coast during the next few days. These swells are likely to cause life-threatening surf and rip current conditions.
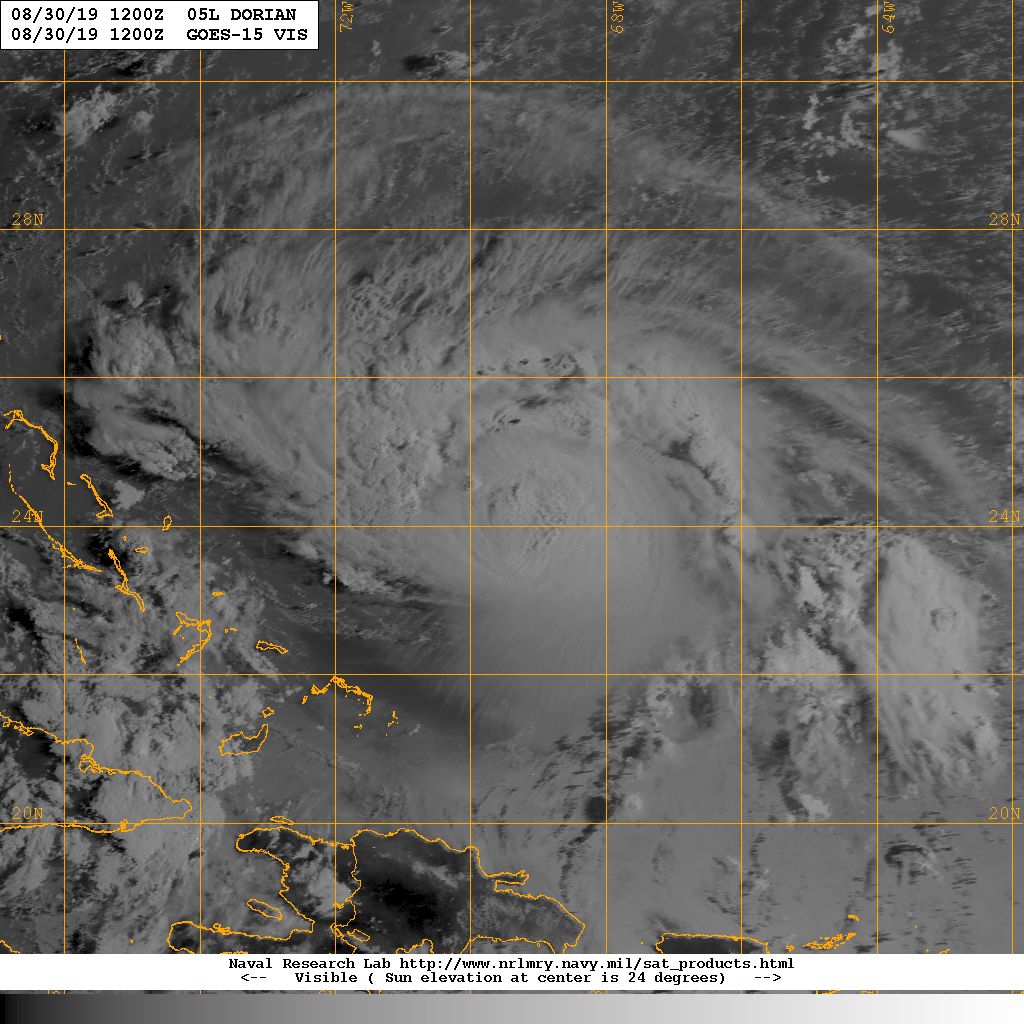
Aug 30, 2019 – Update #1 – NOAA’s GOES-East and GOES-15 Capture Dorian’s Movement in the Atlantic
This short animated GIF shows night and day movement of Dorian across the Atlantic from Aug. 29, 2019 at 11:30 pm (EDT) to Aug. 30, 2019 at 9:00 am (EDT).
NOAA’s GOES-East satellite shows Dorian’s progression towards the U.S. in this animated GIF.
A second image provided by the U.S. Naval Research Laboratory shows a visible satellite image of Dorian taken by NOAA’s GOES-15 at 8:00 am EDT.
NOAA’s GOES-15 visible image of Dorian at 8:00am EDT.
Ongoing coverage of this storm will be provided by NASA during the day today and over the Labor Day weekend.
Aug. 29, 2019 – NASA Tracks Tropical Storm Podul’s Landfall Approach to Vietnam
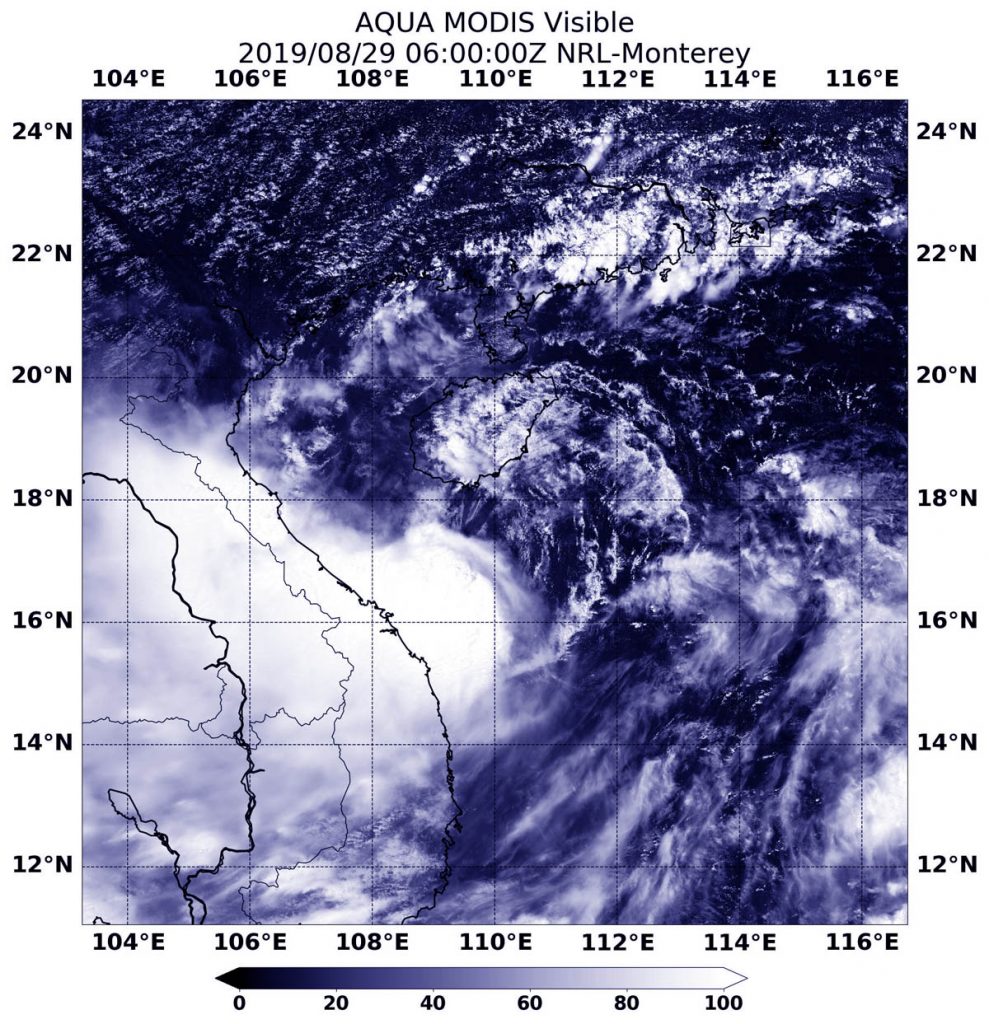
NASA’s Aqua satellite passed over the South China Sea and provided forecasters with a visible image of Tropical Storm Podul as it moved closer to the coast of north and central Vietnam where it is expected to make landfall on August 29.
On Aug. 29, 2019 at 2 a.m. EDT (0600 UTC), the MODIS instrument aboard NASA’s Aqua satellite provided a visible image of Podul in the South China Sea. Podul had already started its landfall in central Vietnam and appeared somewhat elongated. Credit: NASA/NRL
On Aug. 29, 2019 at 2 a.m. EDT (0600 UTC), the Moderate Resolution Imaging Spectroradiometer or MODIS instrument aboard NASA’s Aqua satellite provided a visible image of Podul in the South China Sea. Podul had already started its landfall in central Vietnam and appeared somewhat elongated because northerly winds outside the storm are pushing clouds south of the center.
At 5 a.m. EDT (0900 UTC) on Aug. 29, Tropical storm Podul was centered near 17.8 degrees north latitude and 108.3 degrees east longitude, about 108 nautical miles north of Da Nang, Vietnam. Podul continued moving west and had maximum sustained winds 35 knots (40 mph/65 kph).
The Vietnam National Centre for Hydro-Meteorological Forecasting (NCHMF) is a governmental organization belonging Vietnam Meteorological Hydrological Administration (VMHA) with authority to issue forecasting/warning information for weather, climate, hydrology, water resource, marine weather (i.e. hydrometeorology) and provide hydro-meteorology services. NHCMF has issued a Tropical Storm Warning for central Vietnam with the approach of Podul.
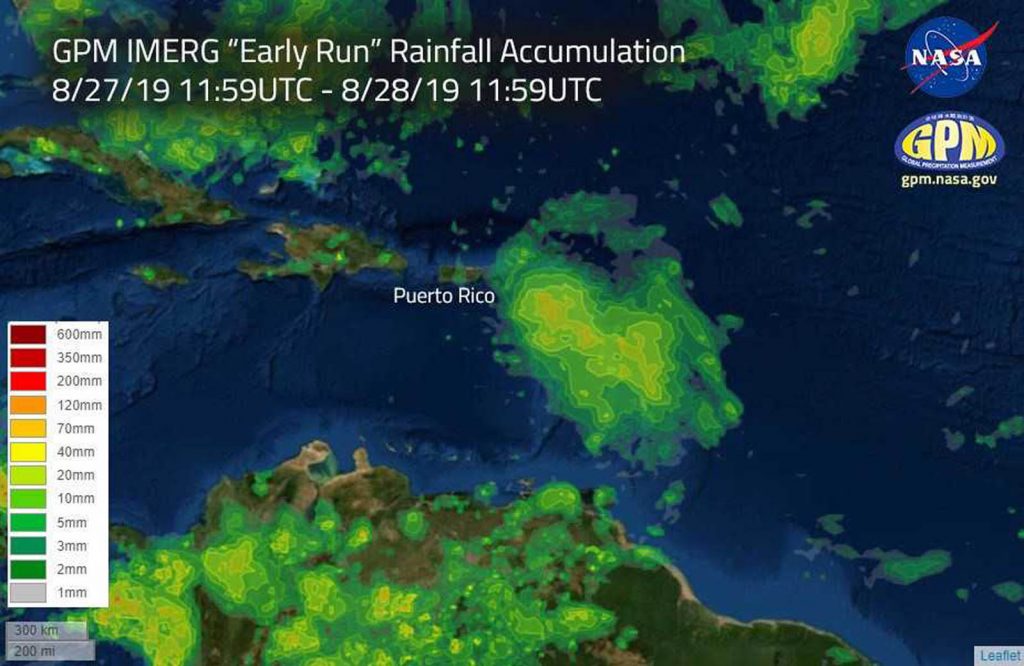
Aug. 29, 2019 – NASA Estimates Heavy Rainfall in Hurricane Dorian
Hurricane Dorian is packing heavy rain as it moves toward the Bahamas as predicted by NOAA’s NHC or National Hurricane Center. NASA analyzed the storm and found heavy rainfall in the storm.
This image shows estimated rainfall accumulations for the region affected by Hurricane Dorian over the 24 hour period of Aug.27 11:59 UTC to Aug. 28 11:59 UTC. The imagery was generated using the Integrated Multi-satEllite Retrievals for GPM (IMERG) “early run” product. The data indicates that up to 120 mm (4.72 inches) of rainfall accumulated in certain regions during the 24 hour period. Credit: NASA/Jacob Reed
NASA has the ability to peer under the “hood” or clouds of a tropical cyclone and estimate the rainfall rates occurring. After looking into Dorian’s clouds, imagery was generated using the Integrated Multi-satEllite Retrievals for GPM or IMERG “early run” product, at NASA’s Goddard Space Flight Center in Greenbelt, Maryland. IMERG uses a constellation of satellites united by the GPM Core Observatory to provide global observations of Earth’s precipitation every 30 minutes.
IMERG estimated rainfall accumulations for the region affected by Hurricane Dorian over the 24 hour period of August 27 at (7:59 a.m. EDT) 11:59 UTC to August 28 at (7:59 a.m. EDT) 11:59 UTC. “The data indicates that up to 120 mm (4.72 inches) of rainfall accumulated in certain regions during the 24 hour period,” said Jacob Reed of NASA Disasters Program, GPM at NASA Goddard.
NHC said that Dorian is expected to produce the following rainfall accumulations this weekend into early next week: The central Bahamas…2 to 4 inches, isolated 6 inches; the northwestern Bahamas and coastal sections of the Southeastern United States…4 to 8 inches, isolated 12 inches. This rainfall may cause life-threatening flash flood.
On Aug. 29 at 5 a.m. EDT (0900 UTC), NOAA’s NHC said the center of Hurricane Dorian was located near latitude 20.5 degrees north and longitude 66.6 degrees west. That puts Dorian’s center about 150 miles (240 km) north-northwest of San Juan, Puerto Rico and about 425 miles (685 km) east-southeast of the southeastern Bahamas.
Dorian is moving toward the northwest near 13 mph (20 kph), and this general motion is expected to continue through Friday. A west-northwestward motion is forecast to begin Friday night and continue into the weekend.
Maximum sustained winds are near 85 mph (140 kph) with higher gusts. Strengthening is forecast during the next few days, and Dorian is expected to become a major hurricane on Friday. The minimum central pressure based on earlier Air Force Reserve Hurricane Hunter data is 991 mb (29.27 inches).
NHC said “On this track, Dorian should move over the Atlantic well east of the southeastern and central Bahamas today and on Friday, and approach the northwestern Bahamas on Saturday.”
Interests in the northwestern and central Bahamas should monitor the progress of Dorian. Swells are likely to begin affecting the east-facing shores of the Bahamas and the southeastern United States coast during the next few days. These swells are likely to cause life-threatening surf and rip current conditions.
Aug. 29, 2019 – NASA Sees a Transitioned, Merging Extra-Tropical Storm Erin Off U.S. East Coast
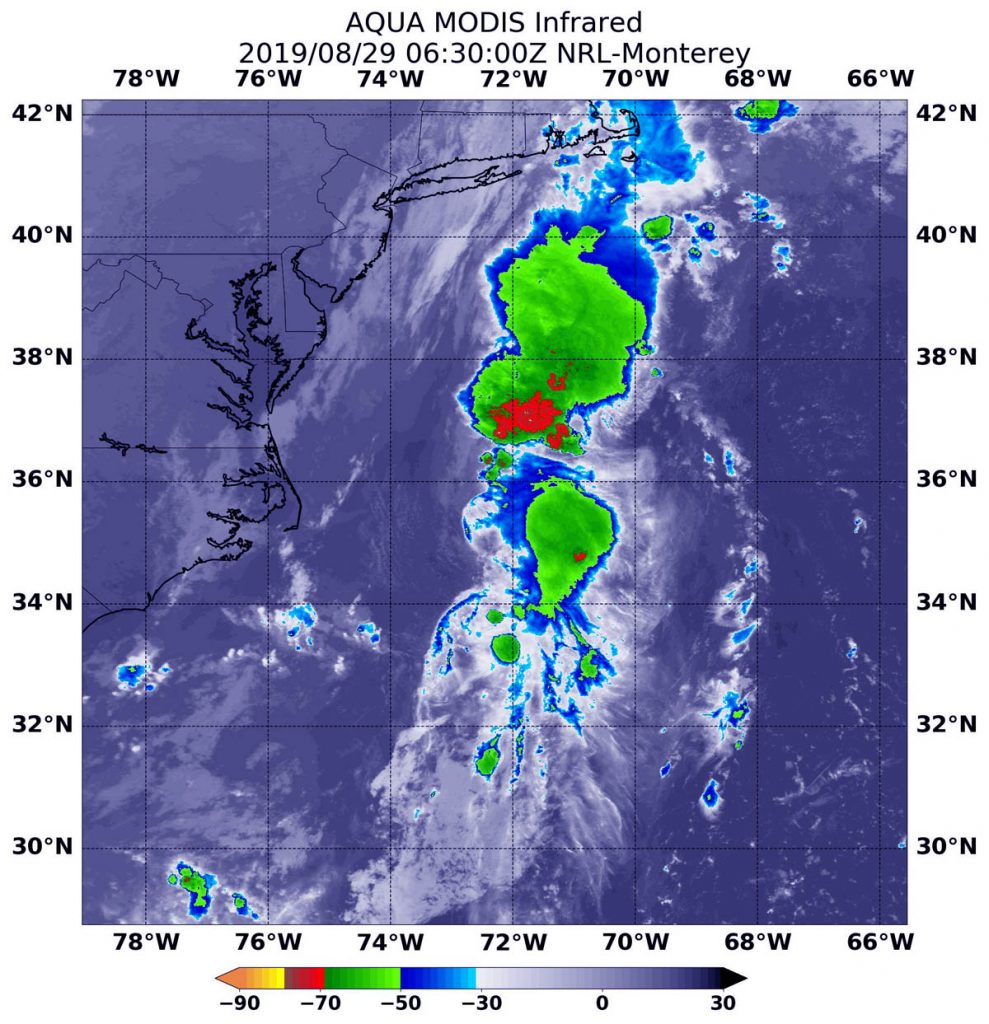
Former tropical depression Erin has made the transition into an extra-tropical system off the eastern coast of the U.S. Infrared imagery from NASA’s Aqua satellite provided temperature data on storms associated with Erin and the weather system it is merging with.
NOAA’s National Hurricane Center or NHC issued the final advisory on Erin on Aug. 29 at 5 a.m. EDT.
On Aug. 29 at 2:30 a.m. EDT (630 UTC), the MODIS instrument that flies aboard NASA’s Aqua satellite found Erin’s strongest thunderstorms (yellow circle) confined to a small area around the center. Cloud top temperatures were as cold as minus 50 degrees Fahrenheit (minus 45.5 degrees Celsius). Storms with colder cloud top temperatures were located far to the north of Erin’s center and are associated with the frontal system of which Erin is merging. Those storms had cloud top temperatures as cold as minus 70F degrees (minus 56.6C). Cloud top temperatures that cold indicate strong storms with the potential to generate heavy rainfall. Credit: NASA/NRL
On Aug. 29 at 2:30 a.m. EDT (630 UTC), the Moderate Imaging Spectroradiometer or MODIS instrument that flies aboard NASA’s Aqua satellite used infrared light and found strongest thunderstorms associated with Erin where confined to a small area around the center. There, cloud top temperatures were as cold as minus 50 degrees Fahrenheit (minus 45.5 degrees Celsius). Infrared data provides temperature information, and the strongest thunderstorms that reach high into the atmosphere have the coldest cloud top temperatures.
Storms with colder cloud top temperatures were located far to the north of Erin’s center and are associated with the frontal system of which Erin is merging. Those storms had cloud top temperatures as cold as minus 70 degrees Fahrenheit (minus 56.6 Celsius). Cloud top temperatures that cold indicate strong storms with the potential to generate heavy rainfall.
Satellite imagery and scatterometer (wind) data indicate that Erin is merging with a frontal system and is now an extratropical low pressure area. On Aug. 30, Erin is expected to be absorbed by a larger extratropical low pressure area over eastern Canada.
When a storm becomes extra-tropical, it means that a tropical cyclone has lost its “tropical” characteristics. The National Hurricane Center defines “extra-tropical” as a transition that implies both poleward displacement (meaning it moves toward the north or south pole) of the cyclone and the conversion of the cyclone’s primary energy source from the release of latent heat of condensation to baroclinic (the temperature contrast between warm and cold air masses) processes. It is important to note that cyclones can become extratropical and still retain winds of hurricane or tropical storm force.
At 5 a.m. EDT (0900 UTC), NHC noted that the center of Post-Tropical Cyclone Erin was located near latitude 36.1 degrees north and longitude 71.6 degrees west. That puts the center of Erin about 225 miles (365 km) east-northeast of Cape Hatteras, North Carolina. The post-tropical cyclone is moving toward the north-northeast near 15 mph (24 kph). A turn toward the northeast and a faster forward motion are expected later today, with this motion continuing through Friday. Maximum sustained winds are near 35 mph (55 kph) with higher gusts.
The post-tropical cyclone is expected to strengthen a little on Friday, Aug. 30, before it is absorbed by a larger extratropical low over eastern Canada Friday night.