Ivo (was 10E) – Eastern Pacific

Aug. 22, 2019 – NASA Satellite Finds Tropical Storm Ivo’s Center

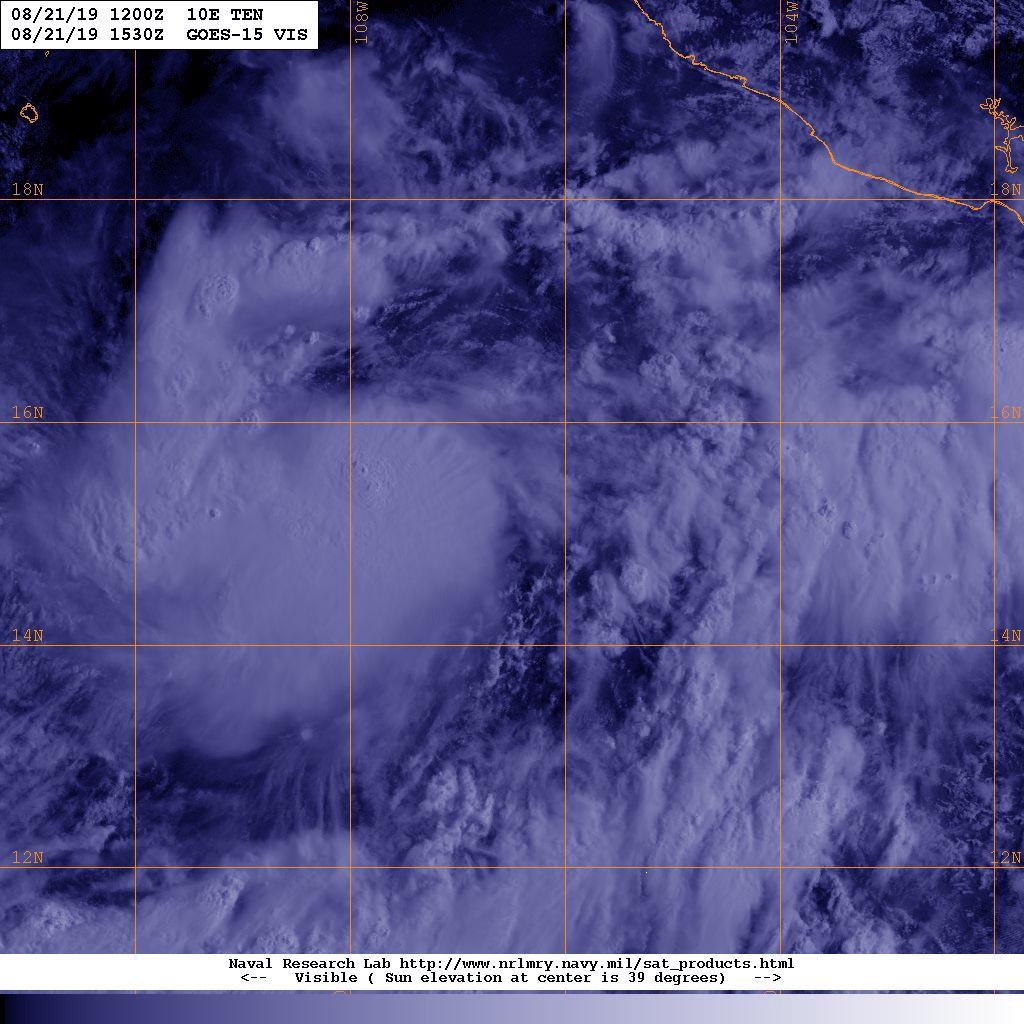
Infrared imagery from NASA’s Aqua satellite revealed the strongest thunderstorms within Tropical Storm Ivo were just north of the center of the storm’s circulation. Tropical Depression 10E strengthened into Tropical Storm Ivo by 5 p.m. EDT on August 21.

Aqua image of Ivo
On August 22 at 5:45 a.m. EDT (0945 UTC), the MODIS instrument that flies aboard NASA’s Aqua satellite showed strongest storms in Tropical Storm Ivo were just north of the center of circulation. Cloud top temperatures in the strong area were as cold as minus 80 degrees Fahrenheit (minus 62.2 Celsius). Credit: NASA/NRL

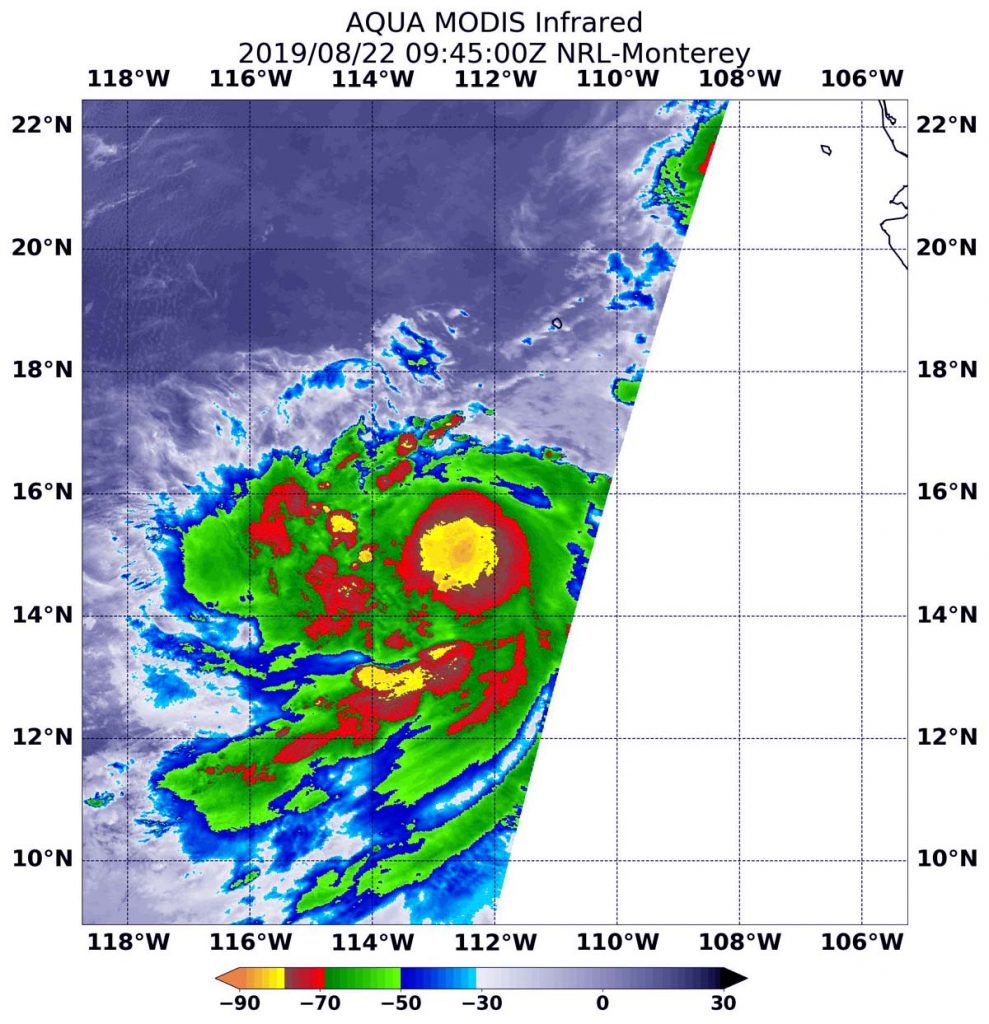
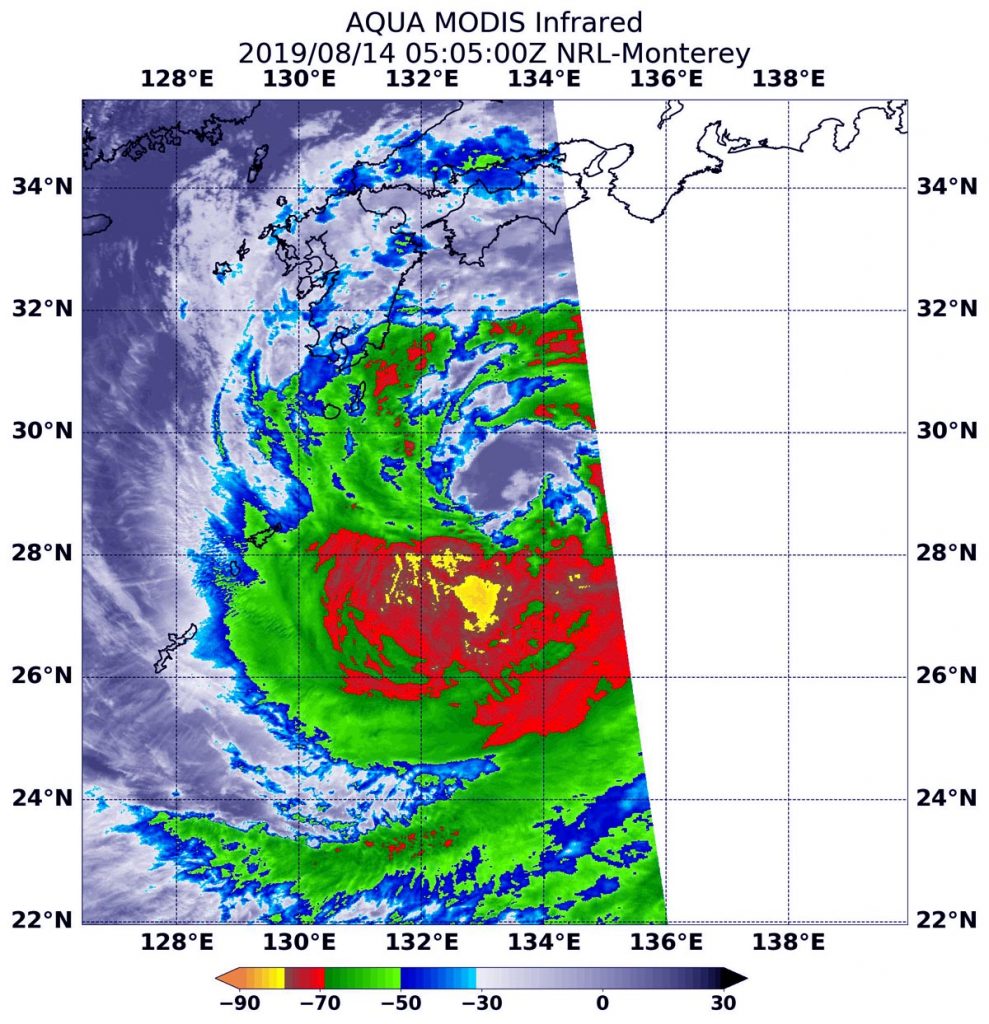
NASA’s Aqua satellite used infrared light to analyze the strength of storms. Infrared data provides temperature information, and the strongest thunderstorms that reach high into the atmosphere have the coldest cloud top temperatures. On August 22 at 5:45 a.m. EDT (0945 UTC), the Moderate Imaging Spectroradiometer or MODIS instrument that flies aboard NASA’s Aqua satellite found those strongest storms just north of the center of circulation and in a fragmented band, extending south of the center. Those areas had cloud top temperatures as cold as minus 80 degrees Fahrenheit (minus 62.2 Celsius). NASA research has shown storms with cloud top temperatures that cold indicate strong storms with the potential to generate heavy rainfall.

NOAA’s National Hurricane Center or NHC noted, “The cyclone continues to gradually improve in organization. Microwave data show that there is a small eye trying to form beneath Ivo’s small central dense overcast, and satellite intensity estimates are rising.”

At 11 a.m. EDT (1500 UTC), the center of Tropical Storm Ivo was located near latitude 15.7 degrees north and longitude 113.6 degrees west. That is about 55 miles (890 km) south-southwest of the southern tip of Baja California, Mexico. Ivo is moving toward the west near 12 mph (19 kph), and a turn to the northwest is expected by tomorrow. Ivo is anticipated to move generally north-northwestward this weekend. Maximum sustained winds have increased to near 65 mph (100 kph) with higher gusts.  The estimated minimum central pressure is 996 millibars.

NHC noted, “Further strengthening is anticipated in the short term since Ivo has a developing inner core and is over very warm waters with moderate wind shear.” Ivo could become a hurricane later tonight or tomorrow, but should begin to weaken on Saturday, August 24.

For updated forecasts, visit: https://www.nhc.noaa.gov

By Rob Gutro
NASA’s Goddard Space Flight Center

Bailu – Northwestern Pacific Ocean

Aug. 21, 2019 – NASA Finds Tropical Depression Bailu Forms East of Philippines

NASA’s Terra satellite passed over the Northwestern Pacific Ocean and captured an image of newly developed Tropical Depression Bailu, east of the Philippines.

Terra image of Bailu
On Aug. 20, 2019, the MODIS instrument aboard NASA’s Terra satellite provided a visible image of Tropical Depression Bailu in the Northwestern Pacific Ocean. Credit: NASA Worldview, Earth Observing System Data and Information System (EOSDIS)

On Aug. 20, 2019, the Moderate Resolution Imaging Spectroradiometer or MODIS instrument aboard NASA’s Terra satellite provided a visible image of Bailu in the Philippine Sea. The storm appeared somewhat elongated.

At 11 a.m. EDT (1500 UTC), the center of Bailu was located near latitude 15.9 degrees north and longitude 130.7 degrees east. Bailu was about 674 nautical miles south-southwest of Kadena Air Base, Okinawa, Japan. Bailu was moving to the northwest and had maximum sustained winds near 30 knots (34.5 mph/55.5 kph).

The Joint Typhoon Warning Center expects Bailu to move northwest and make landfall in Taiwan, then proceed to a second landfall in southeastern China.

By Rob Gutro
NASA’s Goddard Space Flight Center

10E (Eastern Pacific Ocean)

Aug. 21, 2019 – Satellite Sees Eastern Pacific Depression 10E Form

Tropical Depression 10E has formed in the Eastern Pacific Ocean and the GOES-West satellite caught its formation far from the Baja Peninsula.

GOES image of 10E
NOAA’s GOES-West satellite provided a visible image of the newly developed depression on August 21, 2019 at 11:30 a.m. EDT (1530 UTC). The system appears more organized and circular on satellite imagery. Credit: NOAA/NRL

NOAA’s GOES-West satellite provided a visible image of the newly developed depression on August 21, 2019. The system appears more organized and circular on satellite imagery. In addition, An early morning scatterometer instrument overpass that looks at winds in a system, showed a nearly closed surface low pressure area.

At 11 a.m. EDT (1500 UTC), the center of Tropical Depression Ten-E was located near latitude 15.4 degrees north and longitude 107.3 degrees west.  That’s about 545 miles (875 km) south-southeast of the southern tip of Baja California, Mexico.

NOAA’s National Hurricane Center or NHC said the depression is moving toward the west-northwest near 18 mph (30 kph). A turn to the northwest along with a decrease in forward speed is expected by Thursday, Aug. 22. Maximum sustained winds are near 35 mph (55 kph) with higher gusts. The estimated minimum central pressure is 1007 millibars.

NHC said, “Steady strengthening is forecast for the next couple of days and the depression is expected to become a tropical storm by tonight, and a hurricane by Friday.”

For updated forecasts visit: www.nhc.noaa.gov

By Rob Gutro
NASA’s Goddard Space Flight Center

Chantal (Atlantic Ocean)

Aug. 21, 2019 – NASA Sees a Lopsided Atlantic Tropical Storm Chantal Form

NASA’s Aqua satellite provided a view of newly formed Tropical Storm Chantal in the North Atlantic Ocean. The image revealed that the storm formed despite being battered by outside winds.

Aqua image of Chantal
On Aug. 21 at 8:20 a.m. EDT (1220 UTC), the MODIS instrument that flies aboard NASA’s Aqua satellite showed strongest storms (yellow) in Tropical Storm Chantal were east of center, where cloud top temperatures in those areas were as cold as minus 50 degrees Fahrenheit (minus 45.5 Celsius). Credit: NASA/NRL

The third named storm of the Atlantic Ocean hurricane season formed around 11 p.m. EDT on Aug. 20, far from land and almost 500 miles southeast of Halifax, Nova Scotia, Canada.

NASA’s Aqua satellite obtained an infrared view of the storm nine hours later. An instrument aboard Aqua uses infrared light to analyze the strength of storms by providing temperature information about the system’s clouds. The strongest thunderstorms that reach high into the atmosphere have the coldest cloud top temperatures.

On Aug. 21 at 8:20 a.m. EDT (1220 UTC), the Moderate Imaging Spectroradiometer or MODIS instrument that flies aboard NASA’s Aqua satellite gathered infrared data on Chantal. The strongest storms were east of the center of circulation and indicative of vertical wind shear, outside westerly winds pushing against the storm. Storms east of the center had cloud top temperatures as cold as minus 50 degrees Fahrenheit (minus 45.5 Celsius).

In general, wind shear is a measure of how the speed and direction of winds change with altitude. Tropical cyclones are like rotating cylinders of winds. Each level needs to be stacked on top each other vertically in order for the storm to maintain strength or intensify. Wind shear occurs when winds at different levels of the atmosphere push against the rotating cylinder of winds, weakening the rotation by pushing it apart at different levels.

At 11 a.m. EDT (1500 UTC), the center of Tropical Storm Chantal was located near latitude 40.2 degrees north and longitude 51.6 degrees west. The center of Chantal is about 455 miles (730 km) south of Cape Race, Newfoundland, Canada.

Chantal is moving toward the east near 20 mph (31 kph).  A turn toward the southeast with a decrease in forward speed is expected by Thursday, August 22. Chantal is forecast to slow further and turn southward on Friday. Maximum sustained winds are near 40 mph (65 kph) with higher gusts. The estimated minimum central pressure is 1009 millibars.

NOAA’s National Hurricane Center anticipates gradual weakening and Chantal is forecast to become a tropical depression in a couple of days.

For updated forecasts, visit: www.nhc.noaa.gov

By Rob Gutro
NASA’s Goddard Space Flight Center

Krosa – Northwestern Pacific Ocean

Aug. 16, 2019 – Satellite View of Tropical Storm Krosa Transition in Sea of Japan

Tropical Storm Krosa continued to erode after it moved into the Sea of Japan and satellite data showed it as a ragged and shapeless storm on August 16, 2019.

NOAA-20 image of Krosa
NOAA’s NOAA-20 satellite provided a look at Tropical Storm Krosa as it was becoming extra-tropical in the Sea of Japan on Aug 16 at 12:12 a.m. EDT (0412 UTC). Credit: NOAA/NRL

The center of Tropical Storm Krosa’s circulation was difficult to pinpoint in the Aug. 16 visible image from the Visible Infrared Imaging Radiometer Suite (VIIRS) instrument aboard the NOAA-20 satellite. NOAA-20 passed over the Sea of Japan at 12:12 a.m. EDT (0412 UTC) and the VIIRS instrument provided a view of the shapeless storm. The bulk of clouds associated with the storm was north of the center.

The Joint Typhoon Warning Center or JTWC issued their final bulletin on Krosa at 0300 UTC on Aug. 16 (11 p.m. EDT on Aug. 15). At that time Tropical Storm Krosa was located near 39.4 degrees north latitude and 134.9 east longitude, about 296 miles west-southwest of Misawa, Japan. Krosa was moving to the north-northeast and had maximum sustained winds 35 knots (40 mph).

During this time Krosa was becoming extra-tropical. That means that a tropical cyclone has lost its “tropical” characteristics. The National Hurricane Center defines “extra-tropical” as a transition that implies both poleward displacement (meaning it moves toward the north or south pole) of the cyclone and the conversion of the cyclone’s primary energy source from the release of latent heat of condensation to baroclinic (the temperature contrast between warm and cold air masses) processes. It is important to note that cyclones can become extratropical and retain winds of hurricane or tropical storm force.

Krosa is veering northeast and will become fully extra-tropical during the day on Aug. 16.

By Rob Gutro
NASA’s Goddard Space Flight Center

Krosa – Northwestern Pacific Ocean

Aug. 15, 2019 – NASA Pinpointed Tropical Storm Krosa’s Strength Before Japan Landfall

NASA’s Aqua satellite provided forecasters at the Joint Typhoon Warning Center with infrared data and cloud top temperature information for Tropical Storm Krosa as it was making landfall in southern Japan.

AIRS image of Krosa
On Aug. 15, at 12:05 a.m. EDT (0405 UTC) the AIRS instrument aboard NASA’s Aqua satellite analyzed cloud top temperatures of Tropical Storm Krosa in infrared light. AIRS found coldest cloud top temperatures (purple) of strongest thunderstorms were as cold as or colder than minus 63 degrees Fahrenheit (minus 53 degrees Celsius) south of the center. Credit: NASA JPL/Heidar Thrastarson

Cloud top temperatures provide information to forecasters about where the strongest storms are located within a tropical cyclone. The stronger the storms, the higher they extend into the troposphere, and they have the colder cloud temperatures. NASA’s Aqua satellite took Tropical Storm Krosa’s cloud top temperatures to get that information and found the strongest storms south of the storm’s center.

NASA’s Aqua satellite analyzed the storm on Aug. 15, at 12:05 a.m. EDT (0405 UTC) using the Atmospheric Infrared Sounder or AIRS instrument. AIRS found coldest cloud top temperatures as cold as or colder than minus 63 degrees Fahrenheit (minus 53 degrees Celsius) south of the center and over the waters of the Northwestern Pacific Ocean. Cloud top temperatures that cold indicate strong storms that have the capability to create heavy rain.

Over the next 10 hours, the center of Krosa crossed southern Japan and emerged into the Sea of Japan. By 11 a.m. EDT (1500 UTC), satellite imagery showed the system continued to erode and unravel as it exited into the Sea of Japan.

At 11 a.m. EDT (01500 UTC) Tropical Storm Krosa was centered near 25.9 degrees north latitude and 133.1 degrees east longitude. That’s about 108 miles north-northeast of Iwakuni, Japan. It was moving to the northeast and had maximum sustained winds 40 knots (46 mph/74 kph).

Krosa is moving to the northeast through the Sea of Japan. The storm is forecast to become extra-tropical within 24 hours.

By Rob Gutro
NASA’s Goddard Space Flight Center  

Krosa – Northwestern Pacific Ocean

Aug. 14, 2019 – NASA Follows Tropical Storm Krosa’s Approach to Landfall in Southern Japan

Infrared imagery from NASA’s Aqua satellite shows that Tropical Storm Krosa contains powerful thunderstorms with heavy rain capabilities as it moves toward landfall in southern Japan.  Krosa’s center is expected to make landfall in the western part of Shikoku Island, Japan.

Aqua image of Krosa
On Aug. 14 at 12:05 a.m. EDT (0505 UTC), NASA’s Aqua satellite found strongest thunderstorms (yellow) in Krosa in a small area southwest of the center where cloud top temperatures were as cold as minus 80 degrees Fahrenheit (minus 62.2 Celsius). That area was surrounded by a much larger area (red) with powerful storms as cold as minus 70 degrees Fahrenheit (minus 56.6 Celsius). Credit: NASA/NRL

On Aug. 14, 2019, the Japan Meteorological Agency has issued warnings for Kyushu, Shikoku and southeastern portions of Honshu. Because Krosa is such a large storm, it is expected to affect all of the big islands of Japan.

At 12:05 a.m. EDT (0505 UTC), the Moderate Imaging Spectroradiometer or MODIS instrument that flies aboard NASA’s Aqua satellite used infrared light to examine the storm. Infrared data provides temperature information, and the strongest thunderstorms that reach high into the atmosphere have the coldest cloud top temperatures.

Aqua’s MODIS found strongest thunderstorms in a small area southwest of the center where cloud top temperatures were as cold as minus 80 degrees Fahrenheit (minus 62.2 Celsius). That area was surrounded by a much larger area with powerful storms as cold as minus 70 degrees Fahrenheit (minus 56.6 Celsius). Cloud top temperatures that cold indicate strong storms with the potential to generate heavy rainfall.

The Joint Typhoon Warning Center or JTWC noted at 11 a.m. EDT (1500 UTC) that Krosa had maximum sustained winds near 45 knots (52 mph/83 kph). Krosa was centered near 31.0 degrees north latitude and 132.7 degrees east longitude. Tropical storm Krosa was located approximately 237 nautical miles south of Iwakuni, Japan. Krosa has tracked north-northwestward.

After the storm makes landfall in Kyushu, Japan, it is forecast to pass to the south of the Korean peninsula, and turn to the northeast as it becomes extra-tropical over the Sea of Japan.

For updated warnings from the Japan Meteorological Agency, visit: https://www.jma.go.jp/en/typh/

By Rob Gutro
NASA’s Goddard Space Flight Center

Krosa – Northwestern Pacific Ocean

Aug. 13, 2019 – NASA Sees Wide Center in Tropical Storm Krosa

NASA’s Aqua satellite passed over the Northwestern Pacific Ocean and captured a good shot of the wide, ragged center of circulation in Tropical Storm Krosa.

Aqua image of Krosa
On Aug. 13, 2019, the MODIS instrument aboard NASA’s Aqua satellite provided a visible image of Tropical Storm Krosa in the Northwestern Pacific Ocean. Credit: NASA/NRL

On Aug. 13 at 12:20 a.m. EDT (0420 UTC), the Moderate Resolution Imaging Spectroradiometer or MODIS instrument aboard NASA’s Aqua satellite provided a visible image of Krosa that showed a large center of circulation, surrounded by fragmented bands of thunderstorms.

At 5 a.m. EDT (0900 UTC), the center of Krosa was located near latitude 28.2 degrees north and longitude 133.9 degrees east. Krosa was about 397 nautical miles south-southeast of Iwakuni, Japan. Krosa was moving to the west-northwest and had maximum sustained winds near 45 knots (52 mph/83 kph).

The Japan Meteorological Agency has issued warnings for storm surge, heavy rains and tropical storm-force winds along coastal areas in southeastern Japan.

The Joint Typhoon Warning Center said that Krosa is expected to intensify to 50 knots (58 mph/92 kph) as it approaches landfall in southwestern Japan on August 14.

For updated warnings from the Japan Meteorological Agency, visit: https://www.jma.go.jp/jma/indexe.html

By Rob Gutro
NASA’s Goddard Space Flight Center

Henriette – Eastern Pacific Ocean

Aug. 13, 2019 – NASA Finds Henriette Fading

Infrared imagery from NASA’s Terra satellite found just a few scattered areas of cold clouds in the Eastern Pacific Ocean’s Tropical Depression Henriette on August 13.

Terra image of Henrietta
On August 13 at 1:30 a.m. EDT (0530 UTC), the MODIS instrument that flies aboard NASA’s Terra satellite showed strongest thunderstorms in Tropical Depression Henriette were fragmented. Coldest cloud top temperatures were as cold as minus 50 degrees Fahrenheit (minus 45.5 Celsius). Credit: NASA/NRL

NASA’s Terra satellite uses infrared light to analyze the strength of storms by providing temperature information about the system’s clouds. The strongest thunderstorms that reach high into the atmosphere have the coldest cloud top temperatures.

On August 13 at 1:30 a.m. EDT (0530 UTC), the Moderate Imaging Spectroradiometer or MODIS instrument that flies aboard NASA’s Terra satellite gathered infrared data on Henriette.

MODIS found just a few scattered areas of cold clouds in thunderstorms in the depression. Those thunderstorms had cloud top temperatures as cold as minus 50 degrees Fahrenheit (minus 45.5 Celsius).

NOAA’s National Hurricane Center (NHC) noted that Henriette was weakening quickly. At 5 a.m. EDT (0900 UTC), the center of Tropical Depression Henriette was located near latitude 21.1 degrees north and longitude 115.2 degrees west. That’s about 360 miles (580 km) west-southwest of the southern tip of Baja California, Mexico. The depression is moving toward the west-northwest near 13 mph (20 km/h) and this general motion should continue through tonight.

Maximum sustained winds have decreased to near 30 mph (45 kph) with higher gusts.

The estimated minimum central pressure is 1008 mb (29.77 inches).

NHC said, “Additional weakening is expected during the next 24 hours, and the depression is forecast to degenerate into a remnant low later today [Aug. 13, 2019].”

For updated forecasts, visit: https://www.nhc.noaa.gov

By Rob Gutro
NASA’s Goddard Space Flight Center

Krosa – Northwestern Pacific Ocean

Aug. 12, 2019 – NASA-NOAA Satellite Views Massive Tropical Storm Krosa

Tropical Storm Krosa is a large tropical cyclone. When NASA-NOAA’s Suomi NPP satellite passed over the Northwestern Pacific Ocean, it captured a visible image of the massive storm.

Suomi NPP image of Krosa
On Aug. 12, 2019, NASA-NOAA’s Suomi NPP satellite passed over the Northwestern Pacific Ocean and captured a visible image of Krosa that showed a very large tropical storm. Credit: NASA/NRL

The Visible Infrared Imaging Radiometer Suite (VIIRS) instrument aboard Suomi NPP provided a visible image of Tropical Storm Krosa on Aug. 12 at 12:30 a.m. EDT (0430 UTC). The VIIRS image showed that the storm appeared to be almost as wide as the length of the Philippines. For comparison, the Philippines’ length is 1,851 km (1,150 miles) from south-southeast to north-northwest. Thunderstorms wrapped around the low-level center and a band of fragmented thunderstorms stretched far to the south of the center of circulation.

The Joint Typhoon Warning Center noted in their discussion on Aug. 12, “Animated enhanced infrared satellite imagery shows a very expansive system deep but widely fragmented convective bands spiraling in mostly from the southwest into a large, ragged and fully exposed low-level circulation.”

At 11 a.m. EDT (1500 UTC) on Monday, August 12, 2019, the Joint Typhoon Warning Center found Krosa’s maximum sustained winds near 55 knots (63 mph/102 kph). Krosa’s large eye was centered near 26.1 degrees north latitude and 136.7 degrees east longitude. That’s about 236 nautical miles west-northwest of Iwo To island, Japan. Krosa was moving to the northwest.

Krosa is expected to make landfall over western Shikoku, Japan in two and a half days, on August 15. Shikoku is the smallest of Japan’s major islands.

By Rob Gutro 
NASA’s Goddard Space Flight Center