Oct. 06, 2020 – What Happened to Gamma’s Remnants?
The remnant low-pressure area of Gamma was located off the north coast of Yucatan at 8 a.m. EDT. Gamma has since moved inland and is forecast to dissipate on Wednesday.
By Rob Gutro
NASA’s Goddard Space Flight Center
Oct. 05, 2020 – NASA Imagery Reveals Tropical Storm Gamma Battered by Wind Shear
NASA’s Terra satellite obtained visible imagery of Tropical Storm Gamma being battered by outside winds in the south central Gulf of Mexico. Over the weekend of Oct. 3 and 4, Gamma tracked over Mexico’s Yucatan Peninsula.
Tropical Depression 25 formed on Oct. 2 by 11 a.m. EDT over the northwestern Caribbean Sea. At the time of formation, NOAA’s National Hurricane Center (NHC) issued warnings and watches for a portion of the Yucatan Peninsula of Mexico. By 8 p.m. EDT, the depression strengthened into a tropical storm and re-named Gamma.
Gamma brought heavy rainfall to the Yucatan Peninsula over the weekend of Oct. 3 and 4. On Oct. 3, NHC noted, “Surface observations and satellite images indicate that the center of Tropical Storm Gamma made landfall in the northeast Yucatan Peninsula near Tulum, Mexico, around 11:45 a.m. CDT (12:45 p.m. EDT). The storm was very close to hurricane strength at landfall, with maximum sustained winds near 70 mph (110 mph) with higher gusts.”
The storm had weakened after tracking over the peninsula. By 5 p.m. EDT, Gamma’s center had moved off the northern coast of the Yucatan Peninsula and appeared to be stalled. The storm did not move much by Oct. 5.
Watches and Warnings on Oct. 5
On Oct. 5, the NHC posted a warning and a watch. A Tropical Storm Warning is in effect for north and west of Cancun to Dzilam, Mexico A Tropical Storm Watch is in effect from west of Dzilam to Campeche, Mexico.
Gamma’s Wind Shear Troubles
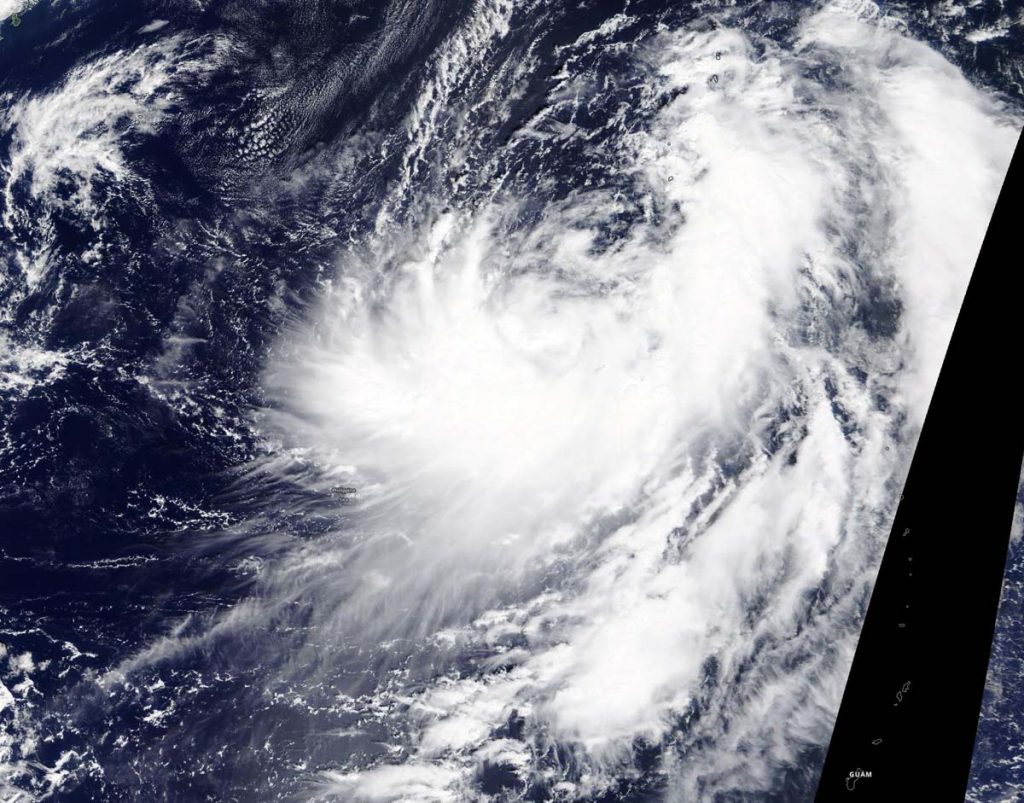
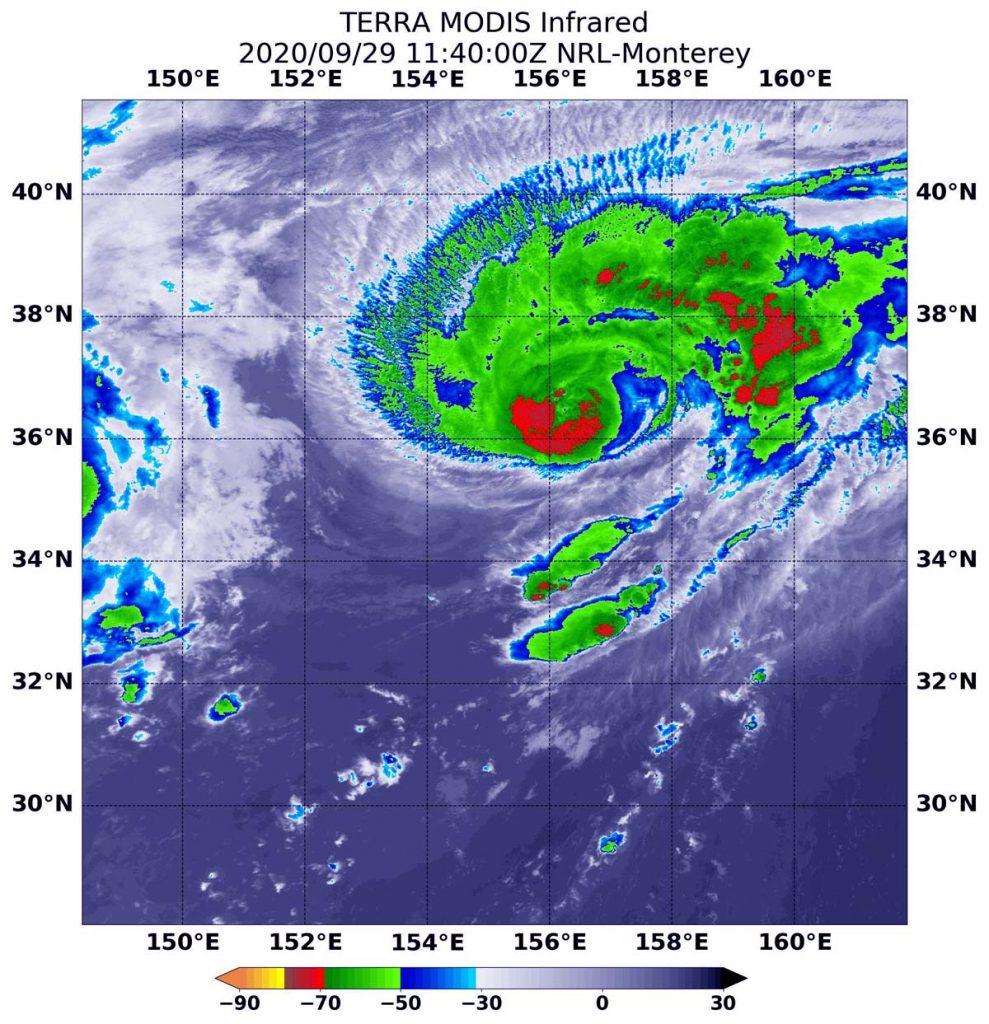
The Moderate Resolution Imaging Spectroradiometer or MODIS instrument that flies aboard NASA’s Terra satellite captured a visible image of Tropical Storm Gamma on Oct. 5.
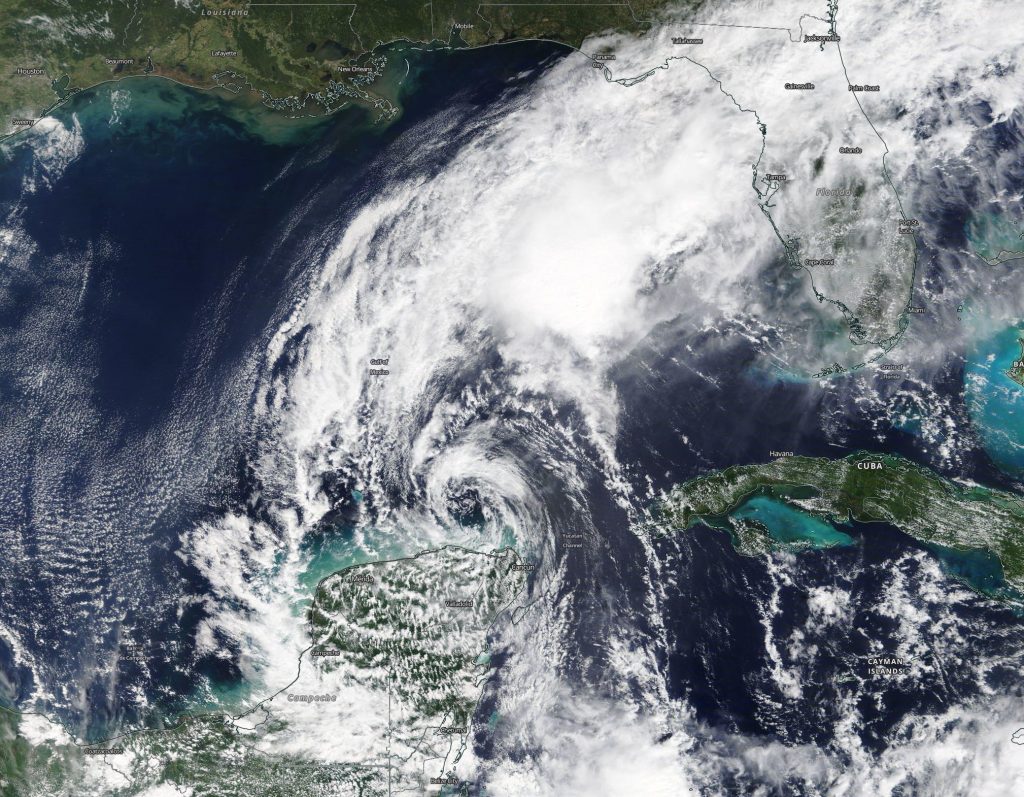
Gamma is a strongly sheared tropical storm that has been meandering just north of the northern coast of the Yucatan Peninsula of Mexico. The MODIS image revealed the strongest thunderstorms were pushed far to the north of the center of circulation by those outside winds (wind shear) from the south.
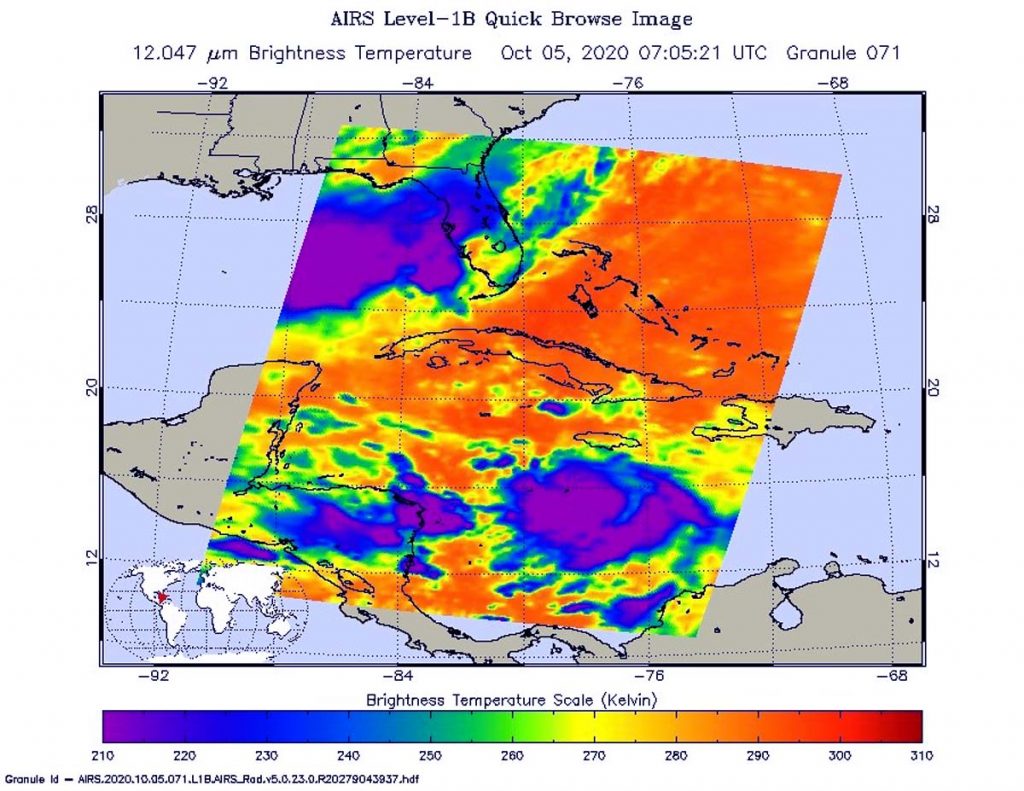
Infrared imagery showed that strong convective cloud tops colder than minus 80 degrees Celsius were more than 60 nautical miles north and northeast of the well-defined and fully exposed low-level circulation center. That southerly wind shear was pushing those strong storms north of the center.
NHC noted that the Decay SHIPS intensity computer forecast model does indicate a very brief period of decreasing wind shear magnitude just prior to landfall around the 24-hour period. Afterward, the shear, once again, increases and the storm will weaken.
The satellite imagery was created using NASA’s Worldview product at NASA’s Goddard Space Flight Center in Greenbelt, Md.
Gamma’s Status on Oct. 5
At 2 p.m. EDT (1800 UTC), the center of Tropical Storm Gamma was located near latitude 22.3 degrees north and longitude 87.9 degrees west. It was centered about 135 miles (220 km) north-northwest of Cozumel, Mexico.
Gamma is moving toward the southwest near 4 mph (7 kph), and this general motion is expected to continue through Wednesday morning. Maximum sustained winds have decreased to near 40 mph (65 kph) with higher gusts. The estimated minimum central pressure is 1003 millibars.
Key Messages
NHC issued two key messages about Gamma, as the storm is expected to continue affecting the Yucatan Peninsula:
Through midweek, Gamma is expected to produce an additional 3 to 6 inches of rainfall with isolated maximum amounts of 8 inches across portions of the Mexican states of Yucatan, Campeche, and Tabasco. This rainfall may produce significant flash flooding.
Tropical storm conditions are likely in portions of the Tropical Storm Warning area along the northern coast of the Yucatan Peninsula for a brief period this afternoon. Tropical Storm conditions are possible within the Tropical Storm Watch area.
Gamma’s Forecast
On the forecast track, the center of Gamma should move inland over the northwest coast of the Yucatan Peninsula Tuesday night and remain inland through Thursday. Gradual weakening is forecast, and Gamma is expected to become a depression this evening and degenerate to a post-tropical remnant low tonight.
About NASA’s Worldview and Terra Satellite
NASA’s Earth Observing System Data and Information System (EOSDIS) Worldview application provides the capability to interactively browse over 700 global, full-resolution satellite imagery layers and then download the underlying data. Many of the available imagery layers are updated within three hours of observation, essentially showing the entire Earth as it looks “right now.”
NASA’s Terra satellite is one in a fleet of NASA satellites that provide data for hurricane research.
Tropical cyclones/hurricanes are the most powerful weather events on Earth. NASA’s expertise in space and scientific exploration contributes to essential services provided to the American people by other federal agencies, such as hurricane weather forecasting.