NASA’s Aqua satellite provided an infrared view of Tropical Storm Lowell that revealed the effects of outside winds battering the storm.
Wind shear occurs when winds at different levels of the atmosphere push against the rotating cylinder of winds, weakening the rotation by pushing it apart at different levels.
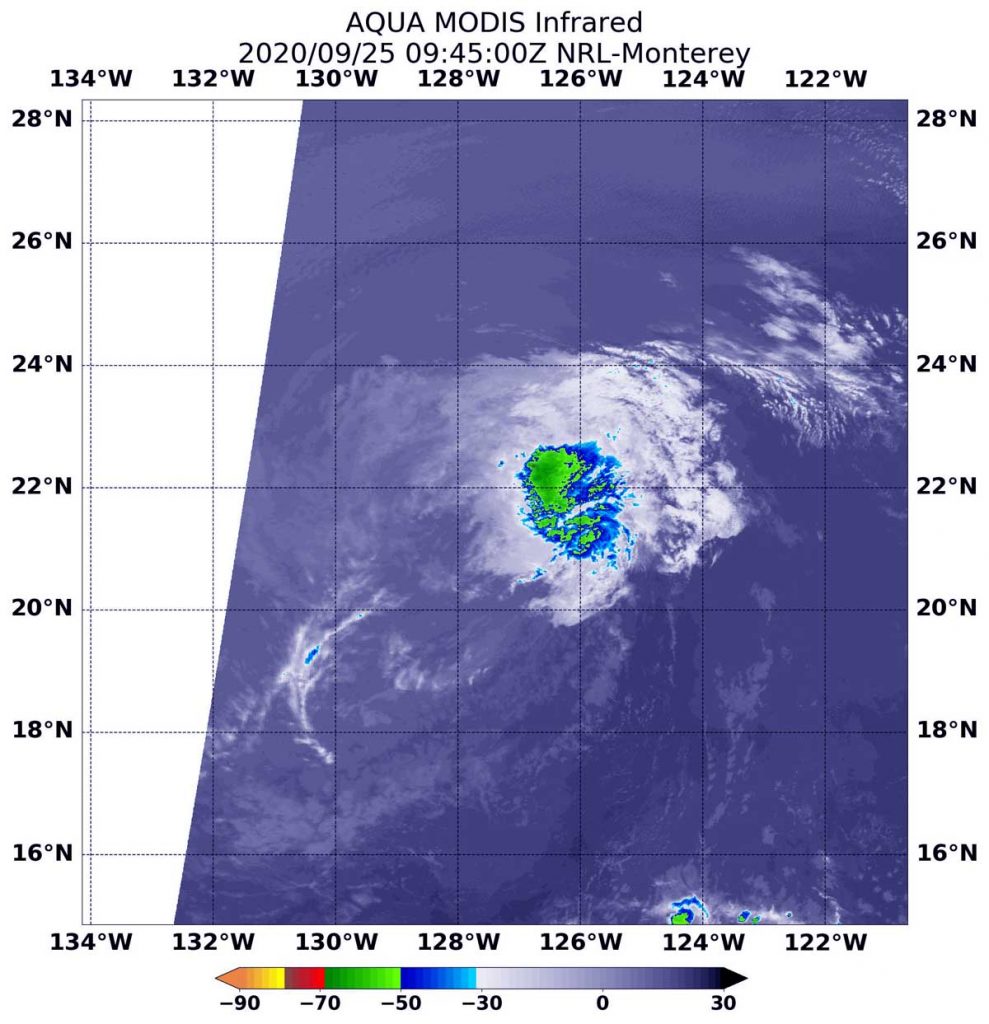
On Sept. 25 at 5:45 a.m. EDT (0945 UTC), the MODIS instrument that flies aboard NASA’s Aqua satellite gathered infrared data on Lowell that confirmed wind shear was adversely affecting the storm. Persistent westerly vertical wind shear showed strongest storms (yellow) pushed east of the center where cloud top temperatures were as cold as minus 50 degrees Fahrenheit (minus 45.5 Celsius). Credit: NASA/NRL
NASA’s Aqua Satellite Reveals Effects of Wind Shear
Infrared light is a tool used to analyze the strength of storms in tropical cyclones by providing temperature information about a system’s clouds. The strongest thunderstorms that reach highest into the atmosphere have the coldest cloud top temperatures. This temperature information can also tell forecasters if the strongest storms in a tropical cyclone are pushed away from the center, indicating wind shear.
On Sept. 25 at 5:45 a.m. EDT (0945 UTC), the Moderate Resolution Imaging Spectroradiometer or MODIS instrument that flies aboard NASA’s Aqua satellite gathered infrared data on Lowell that confirmed wind shear was adversely affecting the storm. Westerly vertical wind shear pushed strongest storms east of the center where cloud top temperatures are as cold as minus 50 degrees Fahrenheit (minus 45.5 Celsius). That small area of strongest storms was located 100 nautical miles east of Lowell’s center.
NOAA’s National Hurricane Center noted in their discussion today, “The areal coverage of Lowell’s convection and its distance from the center already put it on the margins of what is considered organized deep convection.”
Status of Tropical Storm Lowell
At 5 a.m. EDT (0900 UTC), the center of Tropical Storm Lowell was located near latitude 21.6 degrees north and longitude 128.0 degrees west. That is about 1,160 miles (1,865 km) west of the southern tip of Baja California, Mexico. Lowell was moving toward the west near 12 mph (19 kph), and this general motion, with some increase in forward speed, is expected to continue into early next week.
Maximum sustained winds are near 40 mph (65 kph) with higher gusts. Gradual weakening is forecast, and Lowell is expected to become a remnant low today, Sept. 25.
Forecast for Lowell
“Cold waters and increasing west-to-southwesterly wind shear expected over the next 24 hours should finally do the convection in,” noted Robbie Berg, a hurricane specialist at NOAA’s National Hurricane Center in Miami, Fla. That should cause Lowell to lose tropical cyclone status on Friday. “Even stronger [wind] shear is forecast to cause the remnant low to gradually weaken through the end of the 5-day forecast period.”
NASA Researches Tropical Cyclones
Hurricanes/tropical cyclones are the most powerful weather events on Earth. NASA’s expertise in space and scientific exploration contributes to essential services provided to the American people by other federal agencies, such as hurricane weather forecasting.
For more than five decades, NASA has used the vantage point of space to understand and explore our home planet, improve lives and safeguard our future. NASA brings together technology, science, and unique global Earth observations to provide societal benefits and strengthen our nation. Advancing knowledge of our home planet contributes directly to America’s leadership in space and scientific exploration.
Sep. 24, 2020 – NASA Nets Dolphin as an Extratropical Storm
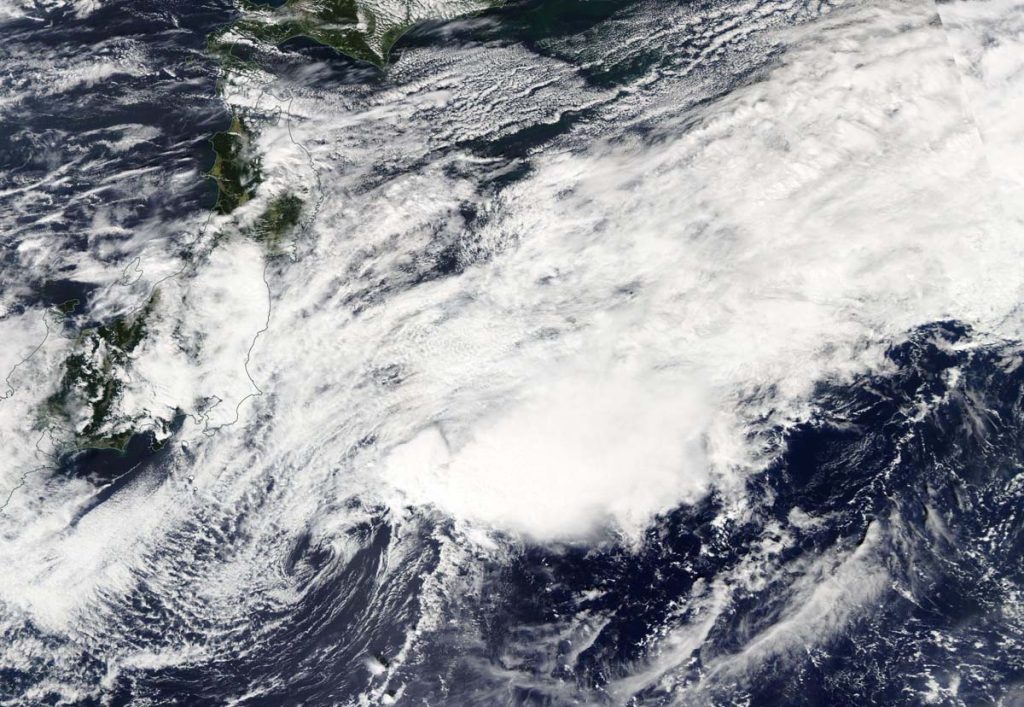
NASA’s Aqua satellite caught a visible image of Dolphin after it passed east central Japan on Sept. 24, where it became an extratropical storm in the Northwestern Pacific Ocean.
NASA’s Aqua satellite provided a visible image of Extratropical Storm Dolphin in the Northwestern Pacific Ocean at 11:35 p.m. EDT on Sept. 23 (0335 UTC on Sept. 24). Image Courtesy: NASA Worldview, Earth Observing System Data and Information System (EOSDIS).
At 11 p.m. EDT on Sept. 23 (0300 UTC on Sept. 24) the Joint Typhoon Warning Center (JTWC) noted, “Animated multispectral satellite imagery shows the ragged low level circulation has become quasi-stationary and fully exposed as the rapidly decaying central convection sheared 140 plus nautical miles to the east-northeast. Analysis indicates that tropical cyclone Dolphin now fully embedded in the baroclinic zone and has become extra-tropical.”
Strong vertical wind shear from the west-southwest was battering Dolphin and pushing the bulk of clouds to the east-northeast. Wind shear occurs when winds outside of a tropical cyclone blow against it and adversely affect its circulation by displacing clouds and precipitation and weakening the system.
Dolphin on Sept. 24
At 11 p.m. EDT on Sept. 23 (0300 UTC on Sept. 24) the center of Dolphin was located near latitude 33.1 degrees north and longitude 141.8 degrees east. That is about 175 nautical miles southeast of Yokosuka, Japan. Dolphin was barely moving to the south at 1 knot and had maximum sustained winds near 30 knots (35 mph/55 kph).
NASA’s Aqua Satellite View
The Moderate Resolution Imaging Spectroradiometer or MODIS instrument that flies aboard NASA’s Aqua satellite captured a visible image of Dolphin at 11:35 p.m. EDT on Sept. 23 (0335 UTC on Sept. 24). The image showed the storm appeared more elongated. That is an indication that the storm was weakening and it had become extratropical.
What is an Extra-tropical Storm?
Often, a tropical cyclone will transform into an extra-tropical cyclone as it recurves toward the poles (north or south, depending on the hemisphere the storm is located in). An extra-tropical cyclone is a storm system that primarily gets its energy from the horizontal temperature contrasts that exist in the atmosphere.
Tropical cyclones have their strongest winds near the earth’s surface, while extra-tropical cyclones have their strongest winds near the tropopause – about eight miles (12 km) up. Also, tropical cyclones, in contrast, typically have little to no temperature differences across the storm at the surface and their winds are derived from the release of energy due to cloud/rain formation from the warm moist air of the tropics.
Dolphin’s Final Forecast
Forecasters at the JTWC noted, “The remnant storm-force cold-core low [pressure area] will drift slowly poleward [north] and deeper into the cold polar air mass. There is also a distinct possibility that the cyclone will remain quasi-stationary and dissipate.”
About NASA’s Worldview and Aqua Satellite
NASA’s Earth Observing System Data and Information System (EOSDIS) Worldview application provides the capability to interactively browse over 700 global, full-resolution satellite imagery layers and then download the underlying data. Many of the available imagery layers are updated within three hours of observation, essentially showing the entire Earth as it looks “right now.”
NASA’s Aqua satellite is one in a fleet of NASA satellites that provide data for hurricane research.
Hurricanes/tropical cyclones are the most powerful weather events on Earth. NASA’s expertise in space and scientific exploration contributes to essential services provided to the American people by other federal agencies, such as hurricane weather forecasting.
Sep. 24, 2020 – NASA Estimating Beta’s Rains Moving into the Tennessee Valley
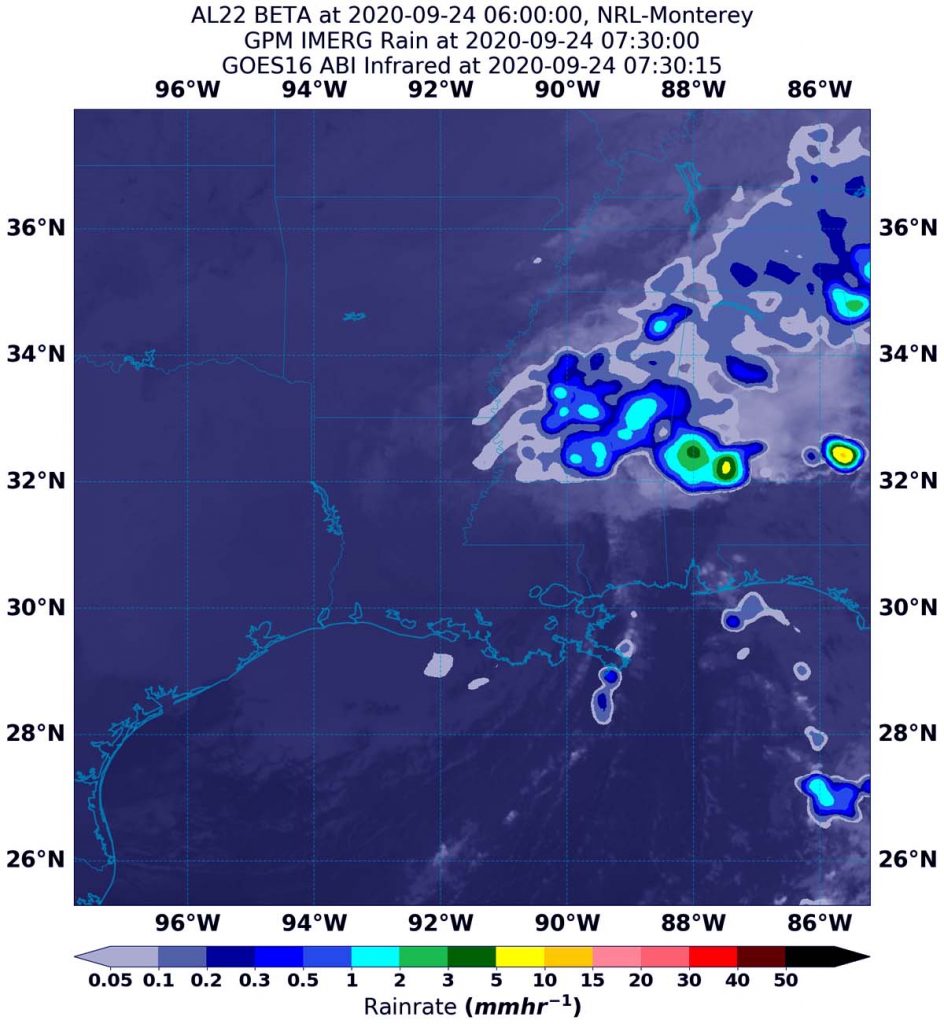
Using a NASA satellite rainfall product that incorporates data from satellites and observations, NASA estimated Post-tropical Cyclone Beta’s rainfall rates as it moved over Mississippi, Alabama and Tennessee. Beta continues a steady northeast track into Mississippi, bringing heavy rainfall across Mississippi into the Tennessee Valley.
NASA’s IMERG estimated on Sept. 24 at 3:30 a.m. EDT (0730 UTC), that Beta was generating as much as 10 to 15 mm (0.40 to 0.60 inches) of rain per hour over Alabama. Lighter rainfall rates were occurring over Mississippi and Tennessee at the time of the image. Rainfall throughout most of the storm was estimated as falling at a rate between 0.2 and 1 mm (0.007 to 0.4 inches) per hour. The rainfall data was overlaid on infrared imagery from NOAA’s GOES-16 satellite. Credit: NASA/NOAA/NRL
Beta’s Status on Sept. 24
NOAA’s National Weather Service Weather Prediction Center (WPC) in College Park, Md. noted that at 5 a.m. EDT (0900 UTC) the center of Post-Tropical Cyclone Beta was located near latitude 31.9 degrees north and longitude 91.0 degrees west. The post-tropical cyclone is moving toward the northeast near 12 mph (19 kph). Maximum sustained winds are near 30 mph (45 kph) with higher gusts.
Estimating Beta’s Rainfall Rates from Space
NASA’s Integrated Multi-satellitE Retrievals for GPM or IMERG, which is a NASA satellite rainfall product, estimated on Sept. 24 at 3:30 a.m. EDT (0730 UTC), Beta was generating as much as 10 to 15 mm (0.40 to 0.60 inches) of rain per hour over Alabama. Lighter rainfall rates were occurring over Mississippi and Tennessee at the time of the image. Rainfall throughout most of the storm was estimated as falling at a rate between 0.2 and 1 mm (0.007 to 0.4 inches) per hour.
At the U.S. Naval Laboratory in Washington, D.C., the IMERG rainfall data was overlaid on infrared imagery from NOAA’s GOES-16 satellite to provide a full extent of the storm.
Watches and Warnings
On Sept. 24, Flash Flood Watches were in effect from southwestern Mississippi to parts of northern Alabama, and southern Middle Tennessee.
NOAA’s WPC said, “Rainfall totals of 2 to 4 inches are expected through early Friday from central to northern Mississippi, across the Middle Tennessee Valley and into the Southern Appalachians. Isolated flash and urban flooding is possible, as well as isolated minor river flooding on smaller rivers. An isolated tornado or two are possible this afternoon across Southern Alabama.”
Beta’s Forecast
Beta is expected to continue moving in a northeasterly direction for the next day and a half. Some weakening is forecast for the next 36 hour before weakening into a frontal system.
What Does IMERG Do?
This near-real time rainfall estimate comes from the NASA’s IMERG, which combines observations from a fleet of satellites, in near-real time, to provide near-global estimates of precipitation every 30 minutes. By combining NASA precipitation estimates with other data sources, we can gain a greater understanding of major storms that affect our planet.
What the IMERG does is “morph” high-quality satellite observations along the direction of the steering winds to deliver information about rain at times and places where such satellite overflights did not occur. Information morphing is particularly important over the majority of the world’s surface that lacks ground-radar coverage. Basically, IMERG fills in the blanks between weather observation stations.
NASA Researches Tropical Cyclones
Hurricanes/tropical cyclones are the most powerful weather events on Earth. NASA’s expertise in space and scientific exploration contributes to essential services provided to the American people by other federal agencies, such as hurricane weather forecasting.
For more than five decades, NASA has used the vantage point of space to understand and explore our home planet, improve lives and safeguard our future. NASA brings together technology, science, and unique global Earth observations to provide societal benefits and strengthen our nation. Advancing knowledge of our home planet contributes directly to America’s leadership in space and scientific exploration.
Sep. 24, 2020 – Post-Tropical Storm Teddy in NASA Newfoundland Nighttime View
NASA-NOAA’s Suomi NPP satellite provided an infrared image of Post-tropical cyclone Teddy over the province of Newfoundland, Canada in the early morning hours of Sept. 24.
NASA-NOAA’s Suomi NPP satellite provided a nighttime view of Post-Tropical Cyclone Teddy over Newfoundland, Canada at 1:40 a.m. EDT (0540 UTC) on Sept. 24. The nighttime lights of Newfoundland can be seen somewhat through Teddy’s clouds, and the nighttime lights of Nova Scotia were visible, revealing the Teddy had moved past the province. Credit: NASA Worldview, Earth Observing System Data and Information System (EOSDIS)
Teddy’s Last Advisory
At 11 p.m. EDT on Sept. 23 (0300 UTC on Sept. 24), NOAA’s National Hurricane Center (NHC) issued the final advisory on Post-Tropical Cyclone Teddy. At that time, the center of Post-Tropical Cyclone Teddy was located near latitude 51.0 degrees north and longitude 57.3 degrees west based on the Marble Mountain, Newfoundland, radar and surface observations along the west coast of Newfoundland. The post-tropical cyclone was moving toward the north-northeast near 32 mph (52 kph), and this general motion is expected to continue through Thursday. Maximum sustained winds were near 50 mph (85 kph) with higher gusts. The estimated minimum central pressure is 975 millibars.
The center of Teddy moved closer to the northwestern Newfoundland coast overnight.
NASA’s Night-Time View
The Visible Infrared Imaging Radiometer Suite (VIIRS) instrument aboard Suomi NPP provided a nighttime image of Post-Tropical Storm Teddy over Newfoundland, Canada. The image was taken at 1:40 a.m. EDT (0540 UTC) on Sept. 24. The nighttime lights of Newfoundland can be seen somewhat through Teddy’s clouds, and the nighttime lights of Nova Scotia were visible, revealing that Teddy had moved past the province.
The image was created using the NASA Worldview application at NASA’s Goddard Space Flight Center in Greenbelt, Md.
Teddy’s Final Fate
On the forecast track, Teddy is expected to move into the Labrador Sea today, Sept. 24 before merging with a larger extratropical low-pressure area.
About NASA’s EOSDIS Worldview
NASA’s Earth Observing System Data and Information System (EOSDIS) Worldview application provides the capability to interactively browse over 700 global, full-resolution satellite imagery layers and then download the underlying data. Many of the available imagery layers are updated within three hours of observation, essentially showing the entire Earth as it looks “right now.”
NASA Researches Earth from Space
For more than five decades, NASA has used the vantage point of space to understand and explore our home planet, improve lives and safeguard our future. NASA brings together technology, science, and unique global Earth observations to provide societal benefits and strengthen our nation. Advancing knowledge of our home planet contributes directly to America’s leadership in space and scientific exploration.
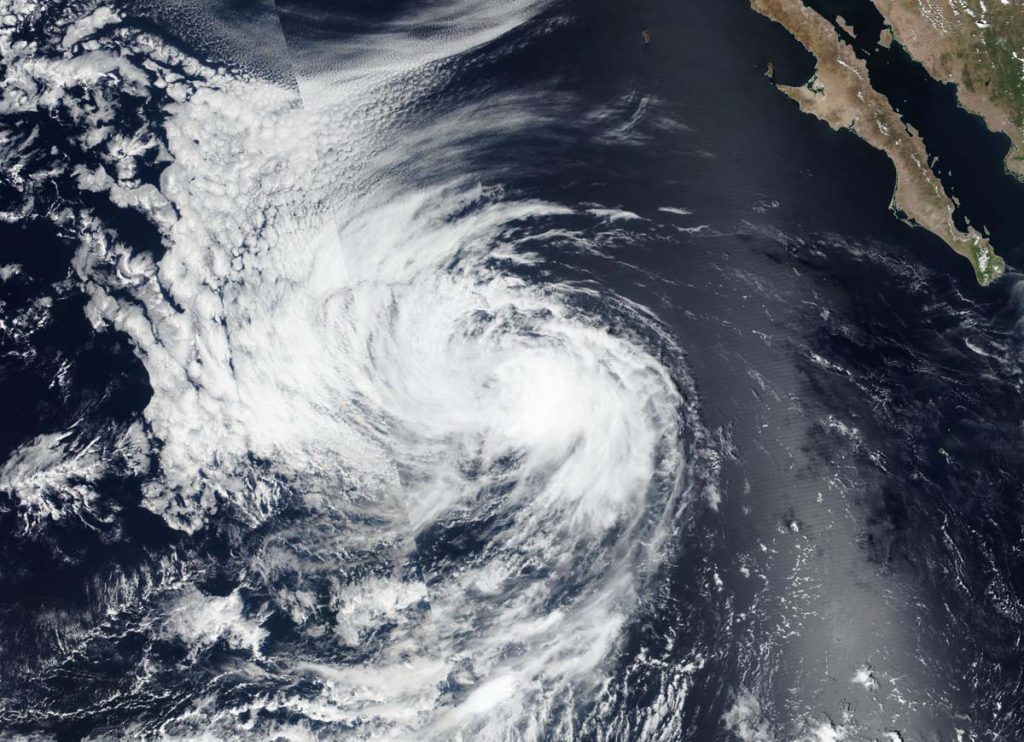
NASA-NOAA’s Suomi NPP satellite passed over the Eastern North Pacific Ocean and captured a visible image of Tropical Storm Lowell that revealed the storm was dealing with wind shear.
NASA-NOAA’s Suomi NPP satellite captured a visible image of Tropical Storm Lowell on Sept. 23 as it continued moving west through the open waters of the Eastern North Pacific Ocean. Credit: NASA Worldview, Earth Observing System Data and Information System (EOSDIS)
Wind shear is caused by winds outside of a tropical cyclone that are blowing against it at different altitudes and directions. Wind shear weakens tropical cyclones by adversely affecting their circulation. Wind shear can elongate a storm and make it spin more slowly, leading to weakening.
The Visible Infrared Imaging Radiometer Suite (VIIRS) instrument aboard Suomi NPP provided a visible image of Lowell on Sept. 23. Around the time of the Suomi NPP image, the National Hurricane Center noted a band of deep convection and thunderstorms had continued over the eastern quadrant of the storm, but the center was exposed and was located west of that band of thunderstorms. Lowell was being affected by moderate northwesterly wind shear which is not expected to abate much.
By 5 p.m. EDT on Sept. 23, Lowell was maintaining strength with a few bands of deep convection and developing thunderstorms located 30 nautical miles or more to the east of the exposed center.
Lowell’s Status on Sept. 24
At 5 a.m. EDT (0900 UTC) on Sept.24, the center of Tropical Storm Lowell was located near latitude 21.2 degrees north and longitude 123.7 degrees west. That is about 890 miles (1,435 km) west of the southern tip of Baja California, Mexico.
Lowell was moving toward the west-northwest near 10 mph (17 kph). Maximum sustained winds are near 45 mph (75 kph) with higher gusts. Gradual weakening is forecast to begin by late Thursday.
Lowell’s Forecast
NHC said a turn toward the west is expected Thursday morning, with that heading and a gradual increase in forward speed continuing through early next week. Lowell is expected to weaken to a tropical depression by late Friday and become a remnant low by early Saturday.
NASA Researches Tropical Cyclones
Hurricanes/tropical cyclones are the most powerful weather events on Earth. NASA’s expertise in space and scientific exploration contributes to essential services provided to the American people by other federal agencies, such as hurricane weather forecasting.
For more than five decades, NASA has used the vantage point of space to understand and explore our home planet, improve lives and safeguard our future. NASA brings together technology, science, and unique global Earth observations to provide societal benefits and strengthen our nation. Advancing knowledge of our home planet contributes directly to America’s leadership in space and scientific exploration.
Sep. 23, 2020 – NASA’s Terra Satellite Confirms Paulette’s Second Post-Tropical Transition
NASA’s Terra satellite passed over post-tropical storm Paulette after it had transitioned for a second time. Using infrared imagery, Terra found no strong storms remained.
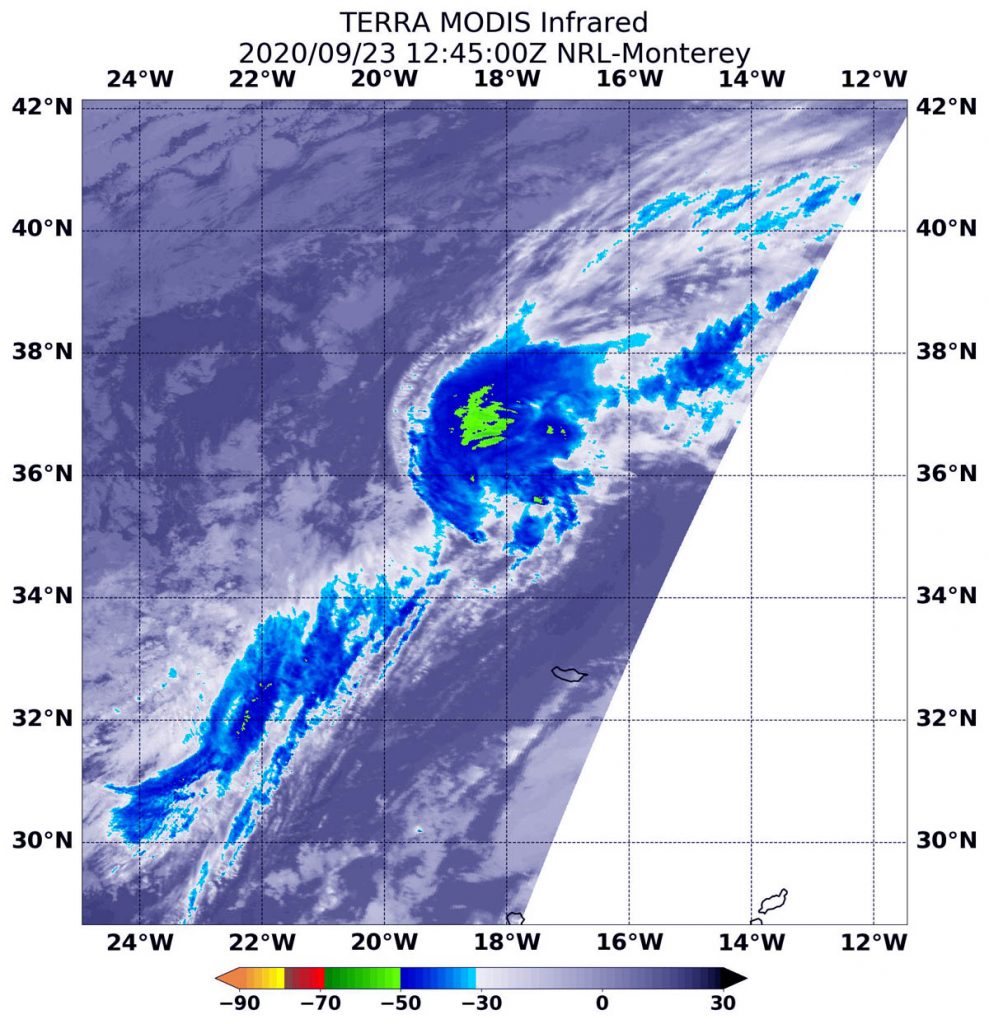
On Sept. 23 at 8:45 a.m. EDT (1245 UTC), the MODIS instrument that flies aboard NASA’s Terra satellite gathered infrared data on Paulette and showed it was devoid of strong storms. Imagery revealed a small area of convection (yellow) where cloud top temperatures are as cold as minus 50 degrees Fahrenheit (minus 45.5 Celsius). Credit: NASA/NRL
Paulette has had quite a history. Paulette formed in the Central Atlantic Ocean on Sept. 6 as Tropical Depression Seventeen and became a tropical storm the next day. Paulette became a hurricane on Sept. 12. As a hurricane, Paulette’s eye passed directly over Bermuda, then weakened and became a post-tropical cyclone on Sept. 16 in the North Atlantic Ocean when it was located 450 miles (725 km) east-southeast of Cape Race Newfoundland, Canada. A Post-Tropical Storm is a generic term for a former tropical cyclone that no longer possesses sufficient tropical characteristics to be considered a tropical cyclone. Then on Sept. 22, the remnants of Paulette organized and re-formed into a tropical storm. Only to devolve again to a post-tropical storm later that day.
At 11 p.m. EDT on Sept. 22 (0300 UTC on Sept. 23), Dan Brown, Warning Coordination Meteorologist, Senior Hurricane Specialist at NOAA’s National Hurricane Center in Miami, Fla. noted, “Paulette had been devoid of deep convection since early Tuesday and the shallow convection mentioned in the previous advisory has also waned. Therefore, Paulette has again become a post-tropical cyclone.”
NASA’s Terra Satellite Examines Paulette
NASA’s Terra satellite uses infrared light to analyze the strength of storms by providing temperature information about the system’s clouds. The strongest thunderstorms that reach high into the atmosphere have the coldest cloud top temperatures.
On Sept. 23 at 8:45 a.m. EDT (1245 UTC), the Moderate Resolution Imaging Spectroradiometer or MODIS instrument that flies aboard NASA’s Terra satellite gathered infrared data on Paulette. There were no strong storms on the infrared MODIS imagery. The imagery found only one small area of convection where cloud top temperatures are as cold as minus 50 degrees Fahrenheit (minus 45.5 Celsius).
Final Status of Paulette
The last public advisory issued by the National Hurricane Center on Paulette was posted on Sept. 22 at 11 p.m. EDT (0300 UTC). At that time, the center of Post-Tropical Cyclone Paulette was located near latitude 34.8 degrees north and longitude 20.0 degrees west. That is about 445 miles (720 km) east-southeast of the Azores Islands. The Azores Islands are a Portuguese archipelago in the North Atlantic Ocean. They are located about 930 miles (1,500 km) from Lisbon, Portugal.
Maximum sustained winds are near 40 mph (65 kph) with higher gusts. Slow weakening is forecast. The post-tropical cyclone was moving toward the east near 12 mph (19 kph). An eastward to east-northeastward motion is forecast through midday Wednesday. A decrease in the forward motion along with turns to the southeast then south are expected late Wednesday through Thursday. A west-southwestward motion is forecast to begin by late this week.
Paulette’s Final Forecast
Post-tropical cyclone Paulette is expected to become a remnant low later today, Sept. 23.
NASA Researches Tropical Cyclones
Hurricanes/tropical cyclones are the most powerful weather events on Earth. NASA’s expertise in space and scientific exploration contributes to essential services provided to the American people by other federal agencies, such as hurricane weather forecasting.
For more than five decades, NASA has used the vantage point of space to understand and explore our home planet, improve lives and safeguard our future. NASA brings together technology, science, and unique global Earth observations to provide societal benefits and strengthen our nation. Advancing knowledge of our home planet contributes directly to America’s leadership in space and scientific exploration.
Sep. 23, 2020 – NASA Finds Dolphin Swimming Against Wind Shear
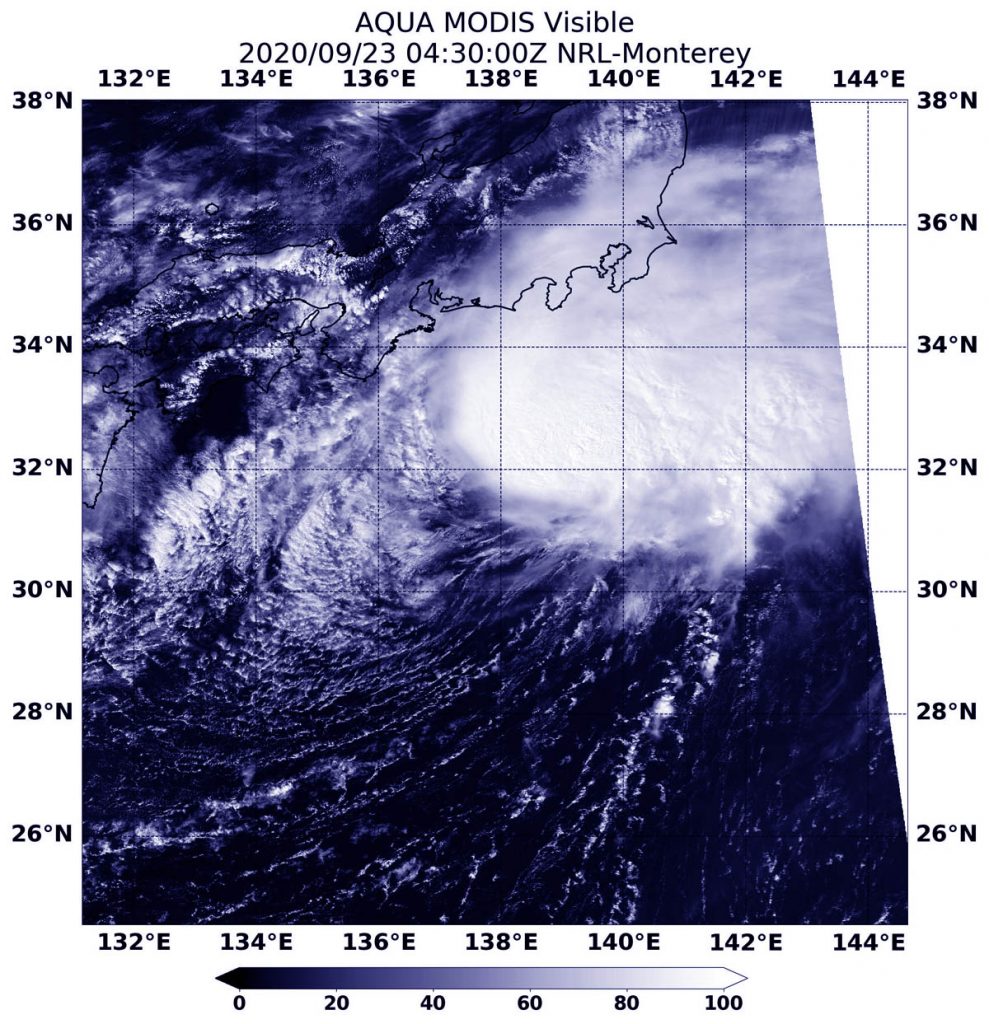
NASA’s Terra satellite provided a visible image of a slightly elongated Tropical Storm Dolphin as it battled wind shear upon its approach to east central Japan.
On Sept. 23, NASA’s Terra satellite provided a visible image of Tropical Storm Dolphin approaching east central Japan. Image Courtesy: NASA/NRL
A Visible Satellite Image
The Moderate Resolution Imaging Spectroradiometer or MODIS instrument that flies aboard NASA’s Terra satellite captured a visible image of Tropical Storm Dolphin on Sept. 23 at 12:30 a.m. EDT (0430 UTC). Dolphin appeared somewhat elongated from west to east likely from the strong vertical wind shear the storm has been battling.
However, despite the increasing vertical wind shear of 30 knots (35 mph/56 kph), animated multispectral satellite imagery shows that Dolphin is a consolidated system with strong thunderstorms banding and wrapping into the low-level circulation center.
Wind Shear Affecting Dolphin
The shape of a tropical cyclone provides forecasters with an idea of its organization and strength. When outside winds batter a storm, it can change the storm’s shape. Winds can push most of the associated clouds and rain to one side of a storm.
In general, wind shear is a measure of how the speed and direction of winds change with altitude. Tropical cyclones are like rotating cylinders of winds. Each level needs to be stacked on top each other vertically in order for the storm to maintain strength or intensify. Wind shear occurs when winds at different levels of the atmosphere push against the rotating cylinder of winds, weakening the rotation by pushing it apart at different levels.
Dolphin on Sept. 23
On Sept. 23 at 5 a.m. EDT (0900 UTC). Tropical Storm Dolphin was located near latitude 32.0 degrees north and longitude 138.6 degrees east. That is about 205 nautical miles south-southwest of Yokosuka, Japan. Dolphin was moving to the northeast and had maximum sustained winds of 50 knots (58 mph/92 kph).
Dolphin is forecast to move northeast and will gradually weaken before becoming extra-tropical near Tokyo.
NASA Researches Tropical Cyclones
Hurricanes/tropical cyclones are the most powerful weather events on Earth. NASA’s expertise in space and scientific exploration contributes to essential services provided to the American people by other federal agencies, such as hurricane weather forecasting.
NASA’s Terra satellite is one in a fleet of NASA satellites that provide data for hurricane research.
For more than five decades, NASA has used the vantage point of space to understand and explore our home planet, improve lives and safeguard our future. NASA brings together technology, science, and unique global Earth observations to provide societal benefits and strengthen our nation. Advancing knowledge of our home planet contributes directly to America’s leadership in space and scientific exploration.
Sep. 23, 2020 – NASA Finds Tropical Storm Lowell’s Center North of Strongest Side
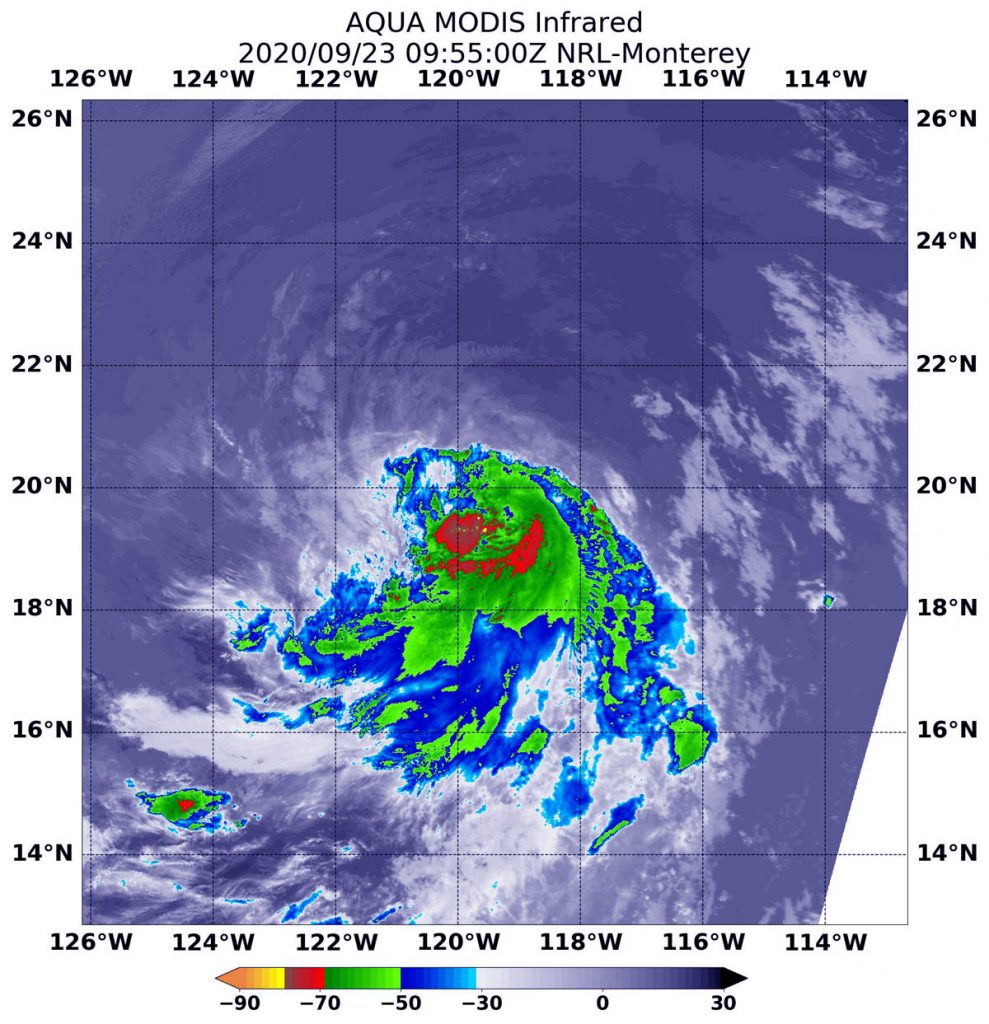
NASA’s Aqua satellite used infrared light to identify strongest storms and coldest cloud top temperatures in Tropical Storm Lowell and found them south of the center of circulation.
Lowell is moving through the Eastern Pacific Ocean and far from land areas. There are no coastal watches or warnings in effect.
On Sept. 23 at 5:55 a.m. EDT (0955 UTC), the MODIS instrument aboard NASA’s Aqua satellite gathered temperature information about Tropical Storm Lowell’s cloud tops. MODIS found the most powerful thunderstorms (red) were east and south of the center, where temperatures were as cold as or colder than minus 70 degrees Fahrenheit (minus 56.6 Celsius). Credit: NASA/NRL
Infrared Data Reveals Powerful Storms
On Sept. 23 at 5:55 a.m. EDT (0955 UTC), the Moderate Resolution Imaging Spectroradiometer or MODIS instrument aboard NASA’s Aqua satellite gathered temperature information about Lowell’s cloud tops. Infrared data provides temperature information, and the strongest thunderstorms that reach high into the atmosphere have the coldest cloud top temperatures.
MODIS found the most powerful thunderstorms were south of the center, where temperatures were as cold as or colder than minus 70 degrees Fahrenheit (minus 56.6 Celsius). Cloud top temperatures that cold indicate strong storms with the potential to generate heavy rainfall.
Lowell’s center is located near the northern edge of a band of strong thunderstorms and deep convection which extends over the eastern and southern portion of the circulation due to moderate northwesterly wind shear in the mid-levels below the cirrus layer (high cloud).
Lowell’s Status on Sept. 23
At 5 a.m. EDT (0900 UTC) on Sept. 23, the center of Tropical Storm Lowell was located near latitude 19.8 degrees north and longitude 119.9 degrees west. Lowell is centered about 680 miles (1,090 km) west-southwest of the southern tip of Baja California, Mexico.
Lowell is moving toward the west-northwest near 12 mph (19 kph), and this general motion is expected to continue today. Maximum sustained winds have increased to near 50 mph (85 kph) with higher gusts. The estimated minimum central pressure is 1001 millibars.
Lowell’s Forecast
NOAA’s National Hurricane Center expects Lowell to move in a westward motion beginning early Thursday, Sept. 24 and continue into the weekend. Little change in strength is forecast during the next few days.
NASA Researches Tropical Cyclones
Hurricanes/tropical cyclones are the most powerful weather events on Earth. NASA’s expertise in space and scientific exploration contributes to essential services provided to the American people by other federal agencies, such as hurricane weather forecasting.
For more than five decades, NASA has used the vantage point of space to understand and explore our home planet, improve lives and safeguard our future. NASA brings together technology, science, and unique global Earth observations to provide societal benefits and strengthen our nation. Advancing knowledge of our home planet contributes directly to America’s leadership in space and scientific exploration.
Sep. 23, 2020 – NASA Tracking Beta’s Heavy Rainfall into Lower Mississippi Valley
Slow-moving post-tropical storm Beta continues to drop large amounts of rainfall in Texas as it moves into the Lower Mississippi Valley on Sept. 23. A NASA satellite rainfall product that incorporates data from satellites and observations estimated Beta’s rainfall rates.
Flash Flood Watches in Effect on Sept. 23
NOAA’s National Weather Service issued warnings and watches for Beta on Sept. 23. There are Flash Flood Watches currently in effect across southeast Texas and southern Louisiana.
What is a Post-tropical Cyclone?
NHC defines a post-tropical cyclone as a former tropical cyclone. This generic term describes a cyclone that no longer possesses sufficient tropical characteristics to be considered a tropical cyclone. Post-tropical cyclones can continue carrying heavy rains and high winds. Former tropical cyclones that have become fully extratropical as well as remnant lows are both classes of post-tropical cyclones.
Beta’s Status on Sept. 23
At 5 a.m. EDT (0900 UTC), the center of Post-Tropical Cyclone Beta was located near latitude 29.5 degrees north and longitude 95.0 degrees west. That is about 30 miles (45 km) east-southeast of Houston, Texas and about 70 miles (115 km) west-southwest of Port Arthur, Texas.
The post-tropical cyclone is moving toward the east-northeast near 9 mph (15 kph) and this motion is expected to shift more toward the northeast during the next 48 hours.
Maximum sustained winds are near 30 mph (45 kph) with higher gusts. Slow weakening is forecast during the next 48 hours. The estimated minimum central pressure is 1007 millibars.
NASA’s IMERG rainfall product estimated on Sept. 23 at 3:30 a.m. EDT (0730 UTC) that Beta was generating between 1 and 5 mm (0.04 and 0.2 inches) of rain per hour around the center of circulation in east Texas and in areas extending northeast into Louisiana and out over the Gulf of Mexico. Rainfall throughout most of the storm was estimated as falling at a rate between 0.3 and 1 mm (0.01 to 0.04 inches) per hour. The rainfall data was overlaid on infrared imagery from NOAA’s GOES-16 satellite. Credit: NASA/NOAA/NRL
Estimating Beta’s Rainfall Rates from Space
NASA’s Integrated Multi-satellitE Retrievals for GPM or IMERG, which is a NASA satellite rainfall product, estimated on Sept. 23 at 3:30 a.m. EDT (0730 UTC) that Beta was generating between 1 and 5 mm (0.04 and 0.2 inches) of rain per hour. IMERG also found that rainfall was occurring around the center of circulation in east Texas and in areas extending northeast into Louisiana and out over the Gulf of Mexico. Rainfall throughout most of the storm was estimated as falling at a rate between 0.3 and 1 mm (0.01 to 0.04 inches) per hour.
At the U.S. Naval Laboratory in Washington, D.C., the IMERG rainfall data was overlaid on infrared imagery from NOAA’s GOES-16 satellite to provide a full extent of the storm.
NHC Key Messages
NOAA’s National Weather Service Weather Prediction Center in College Park, Md. issued two key messages about Beta on Sept. 23:
RAINFALL: For the upper Texas coast, additional rainfall of 3 to 5 inches with isolated storm totals up to 15 inches is expected through Wednesday afternoon. Significant urban flooding will continue as well as minor to isolated moderate river flooding. Flash flooding will remain possible through Wednesday afternoon. Rainfall totals of 2 to 5 inches are expected east into the Lower Mississippi Valley, portions of the Tennessee Valley, and the southern Appalachians through the end of the week. Flash and urban flooding is possible, as well as isolated minor river flooding on smaller rivers.
SURF: Swells generated by a combination of Beta and a stationary front over the northern Gulf of Mexico will continue from the Upper Coast of Texas to the Western Florida Panhandle during the next couple of days. These swells are likely to cause life-threatening surf and rip current conditions.
Beta is forecast to continue moving in an easterly direction into the Lower Mississippi Valley, portions of the Tennessee Valley, and the southern Appalachians through the end of the week.
What Does IMERG Do?
This near-real time rainfall estimate comes from the NASA’s IMERG, which combines observations from a fleet of satellites, in near-real time, to provide near-global estimates of precipitation every 30 minutes. By combining NASA precipitation estimates with other data sources, we can gain a greater understanding of major storms that affect our planet.
What the IMERG does is “morph” high-quality satellite observations along the direction of the steering winds to deliver information about rain at times and places where such satellite overflights did not occur. Information morphing is particularly important over the majority of the world’s surface that lacks ground-radar coverage. Basically, IMERG fills in the blanks between weather observation stations.
NASA Researches Tropical Cyclones
Hurricanes/tropical cyclones are the most powerful weather events on Earth. NASA’s expertise in space and scientific exploration contributes to essential services provided to the American people by other federal agencies, such as hurricane weather forecasting.
For more than five decades, NASA has used the vantage point of space to understand and explore our home planet, improve lives and safeguard our future. NASA brings together technology, science, and unique global Earth observations to provide societal benefits and strengthen our nation. Advancing knowledge of our home planet contributes directly to America’s leadership in space and scientific exploration.
Sep. 23, 2020 – NASA Sees Post-Tropical Storm Teddy Generating Heavy Rain Over Eastern Canada
Hurricane Teddy has transitioned to a large post-tropical cyclone over eastern Canada. Using a NASA satellite rainfall product that incorporates data from satellites and observations, NASA estimated Teddy’s rainfall rates. In addition to the heavy rainfall, Teddy causing destructive waves and strong winds today, Sept. 23, for portions of Atlantic Canada.
Teddy made landfall in the Sheet Harbour area of Nova Scotia on the province’s Eastern Shore around 7:30 a.m. EDT, Sept. 23.
Warnings and Watches in Effect on Sept. 23
NOAA’s National Hurricane Center (NHC) issued warnings and watches for Teddy on Sept. 23. Tropical Storm Warning is in effect for the south coast of Nova Scotia from Digby to Meat Cove, and for Port aux Basques to Francois, Newfoundland, Canada.
A Tropical Storm Watch is in effect for Meat Cove to Tidnish, Nova Scotia, and from north of Digby to Fort Lawrence, Nova Scotia, and for the Magdalen Islands, Quebec and Prince Edward Island.
On Sept. 22 at 1:53 a.m. EDT (0553UTC) NASA’s Aqua satellite analyzed Teddy using the Atmospheric Infrared Sounder or AIRS instrument. AIRS found coldest cloud top temperatures as cold as or colder than (purple) minus 63 degrees Fahrenheit (minus 53 degrees Celsius) north of the center. That’s where the heaviest rainmaking storms were located. Credit: NASA JPL/Heidar Thrastarson
What is a Post-tropical and Extra-tropical Cyclone?
At 11 p.m. EDT on Sept. 22, U.S. Navy Hurricane Specialist Dave Roberts at the NHC said, “Extratropical transition has been ongoing since last night, with the cyclone’s associated rain shield expanding over a great distance in the northern semicircle. In addition, multiple dropsonde observations from the Air Force Reserve hurricane hunters and buoy data show a sharp temperature gradient of nearly 20 degrees F from northwest quadrant to the southeast, indicative of the cyclone’s involvement with the strong baroclinic frontal zone. Accordingly, Teddy has become a strong post-tropical extratropical cyclone.”
NHC defines a post-tropical cyclone as a former tropical cyclone. This generic term describes a cyclone that no longer possesses sufficient tropical characteristics to be considered a tropical cyclone. Post-tropical cyclones can continue carrying heavy rains and high winds. Former tropical cyclones that have become fully extratropical or remnant lows are both classes of post-tropical cyclones.
What does Extra-tropical Mean?
When a storm becomes extra-tropical it means that a tropical cyclone has lost its “tropical” characteristics. The National Hurricane Center defines “extra-tropical” as a transition that implies both poleward displacement (meaning it moves toward the north or south pole) of the cyclone and the conversion of the cyclone’s primary energy source from the release of latent heat of condensation to baroclinic (the temperature contrast between warm and cold air masses) processes. It is important to note that cyclones can become extratropical and still retain winds of hurricane or tropical storm force.
Teddy’s Status on Sept. 23
At 8 a.m. EDT (1200 UTC), the center of Post-Tropical Cyclone Teddy was located near latitude 44.8 degrees north and longitude 62.3 degrees west. That is 65 miles (105 km) east-northeast of Halifax, Nova Scotia, Canada. The post-tropical cyclone is moving toward the north-northeast near 23 mph (37 kph), and this motion, with an increase in forward speed, is expected for the next day or so. On the forecast track, the center will move over eastern Nova Scotia soon, and then near or over Newfoundland by tonight, and be east of Labrador on Thursday.
Maximum sustained winds are near 65 mph (100 km/h) with higher, gusts. Some weakening is forecast during the next day or so, but Teddy should remain a strong post-tropical cyclone while passing over Nova Scotia and near Newfoundland. Teddy is a huge storm. Tropical-storm-force winds extend outward up to 520 miles (835 km) from the center. The estimated minimum central pressure is 963 millibars.
Estimating Teddy’s Rainfall Rates from Space
NASA’s Integrated Multi-satellitE Retrievals for GPM or IMERG, which is a NASA satellite rainfall product, estimated on Sept. 23 at 3:30 a.m. EDT (0730 UTC) that Teddy was generating between 5 and 15 mm (0.20 and 0.60 inches) of rain per hour around the center of circulation. Rainfall throughout most of the storm was estimated as falling at a rate between 0.3 and 2 mm (0.01 to 0.08 inches) per hour.
NASA’s IMERG rainfall product estimated on Sept. 23 at 3:30 a.m. EDT (0730 UTC) that Teddy was generating between 5 and 15 mm (0.20 and 0.60 inches) of rain per hour around the center of circulation. Rainfall throughout most of the storm was estimated as falling at a rate between 0.3 and 2 mm (0.01 to 0.08 inches) per hour. The rainfall data was overlaid on infrared imagery from NOAA’s GOES-16 satellite. Credit: NASA/NOAA/NRL
At the U.S. Naval Laboratory in Washington, D.C., the IMERG rainfall data was overlaid on infrared imagery from NOAA’s GOES-16 satellite to provide a full extent of the storm.
NHC Key Messages
The National Hurricane Center (NHC) issued three key messages about Teddy on Sept. 23:
Teddy is expected remain a powerful post-tropical cyclone while it moves near or over portions of Atlantic Canada through tonight. The most significant hazard expected from Teddy is large destructive waves forecast along the southern coast of Nova Scotia today.
Very large swells produced by Teddy are expected to affect portions of Bermuda, the Leeward Islands, the Greater Antilles, the Bahamas, the east coast of the United States, and Atlantic Canada during the next few days. These swells are expected to cause life-threatening surf and rip current conditions.
Tropical Storm Watches and Warnings are in effect for portions of Nova Scotia, Newfoundland, Prince Edward Island and the Magdalen Islands, and heavy rainfall across Atlantic Canada is expected through Thursday.
Teddy’s Fate in the Atlantic
NHC Senior Hurricane Specialist Richard Pasch said, “Teddy’s deep convection has been diminishing, but based on buoy observations the cyclone still has a strong circulation with a central pressure in the 950’s (millibars). Assuming a gradual spin down of the system since the earlier aircraft observations, the estimated maximum winds have dropped to just below hurricane strength. The system is expected to traverse Nova Scotia today as a strong extratropical cyclone, and move near Newfoundland by tonight. After passing east of Labrador on Thursday, the global models show Teddy merging with another large extratropical low over the north Atlantic.”
What Does IMERG Do?
This near-real time rainfall estimate comes from the NASA’s IMERG, which combines observations from a fleet of satellites, in near-real time, to provide near-global estimates of precipitation every 30 minutes. By combining NASA precipitation estimates with other data sources, we can gain a greater understanding of major storms that affect our planet.
What the IMERG does is “morph” high-quality satellite observations along the direction of the steering winds to deliver information about rain at times and places where such satellite overflights did not occur. Information morphing is particularly important over the majority of the world’s surface that lacks ground-radar coverage. Basically, IMERG fills in the blanks between weather observation stations.
NASA Researches Tropical Cyclones
Hurricanes/tropical cyclones are the most powerful weather events on Earth. NASA’s expertise in space and scientific exploration contributes to essential services provided to the American people by other federal agencies, such as hurricane weather forecasting.
For more than five decades, NASA has used the vantage point of space to understand and explore our home planet, improve lives and safeguard our future. NASA brings together technology, science, and unique global Earth observations to provide societal benefits and strengthen our nation. Advancing knowledge of our home planet contributes directly to America’s leadership in space and scientific exploration.