Sep. 06, 2019 – NASA Finds Akoni Already Post-Tropical
Tropical Storm Akoni had a quick life as a tropical storm before transitioning into a post-tropical storm. NASA captured a visible image of as it was becoming a tropical storm and an infrared image after it transitioned.
NASA’s Aqua satellite provided a visible image of Akoni when it was strengthening into a tropical storm. This image was taken at 4:30 p.m. EDT (2230 UTC) on Sept. 5, 2019. Credit: NASA/NRL
Akoni developed as Tropical Depression 12E on Sept. 4 in the far eastern Pacific Ocean. On Sept. 5 it strengthened into a tropical storm at 7 p.m. EDT. That’s when it became Akoni. By 5 a.m. EDT on Sept. 6, Akoni had transitioned into a post-tropical storm.
The Moderate Resolution Imaging Spectroradiometer or MODIS instrument aboard NASA’s Aqua satellite provided a visible image of Akoni as it was strengthening into a tropical storm. The image was taken at 4:30 p.m. EDT (2230 UTC) on Sept. 5, 2019 and it revealed a rounded storm.
An infrared image from MODIS was taken later on Sept. 6 at 6:45 a.m. EDT (1045 UTC) once Akoni had become Post-Tropical. That infrared MODIS image showed just a small area of strong storms located just southeast of center where cloud top temperatures were near minus 70 degrees Fahrenheit ( minus 56.6 degrees Celsius).
A Post-Tropical Storm is a generic term for a former tropical cyclone that no longer possesses sufficient tropical characteristics to be considered a tropical cyclone. Former tropical cyclones can become fully extratropical, subtropical, or remnant lows, and all three are classes of post-tropical cyclones. In any case, they no longer possesses sufficient tropical characteristics to be considered a tropical cyclone. However, post-tropical cyclones can continue carrying heavy rains and high winds.
NOAA’s National Hurricane Center (NHC) said, “Although showers and thunderstorms continue to pulse near Akoni’s elongated low-level circulation center (LLCC), they have not been sufficiently persistent or organized to continue to classify the system as a tropical cyclone, and Akoni is being downgraded to a post-tropical remnant low.”
At 5 a.m. EDT (0900 UTC), NHC reported in their final advisory on the system that “the center of Post-Tropical Cyclone Akoni was located near latitude 11.2 degrees north and longitude 149.7 degrees west. That’s about 690 miles (1,105 km) south-southeast of Hilo, Hawaii. Maximum sustained winds are near 35 mph (55 kph) with higher gusts. Little change in strength is forecast during the next couple of days. The estimated minimum central pressure is 1007 millibars.”
The post-tropical cyclone is moving toward the west near 16 mph (26 kph), and this motion is expected to continue the next couple of days, with some increase in forward speed over the weekend.
Sep. 06, 2019 – NASA Finds a Weaker Hurricane Juliette
Hurricane Juliette has been weakening and NASA-NOAA’s Suomi NPP satellite provided a look at the strength of storms within.
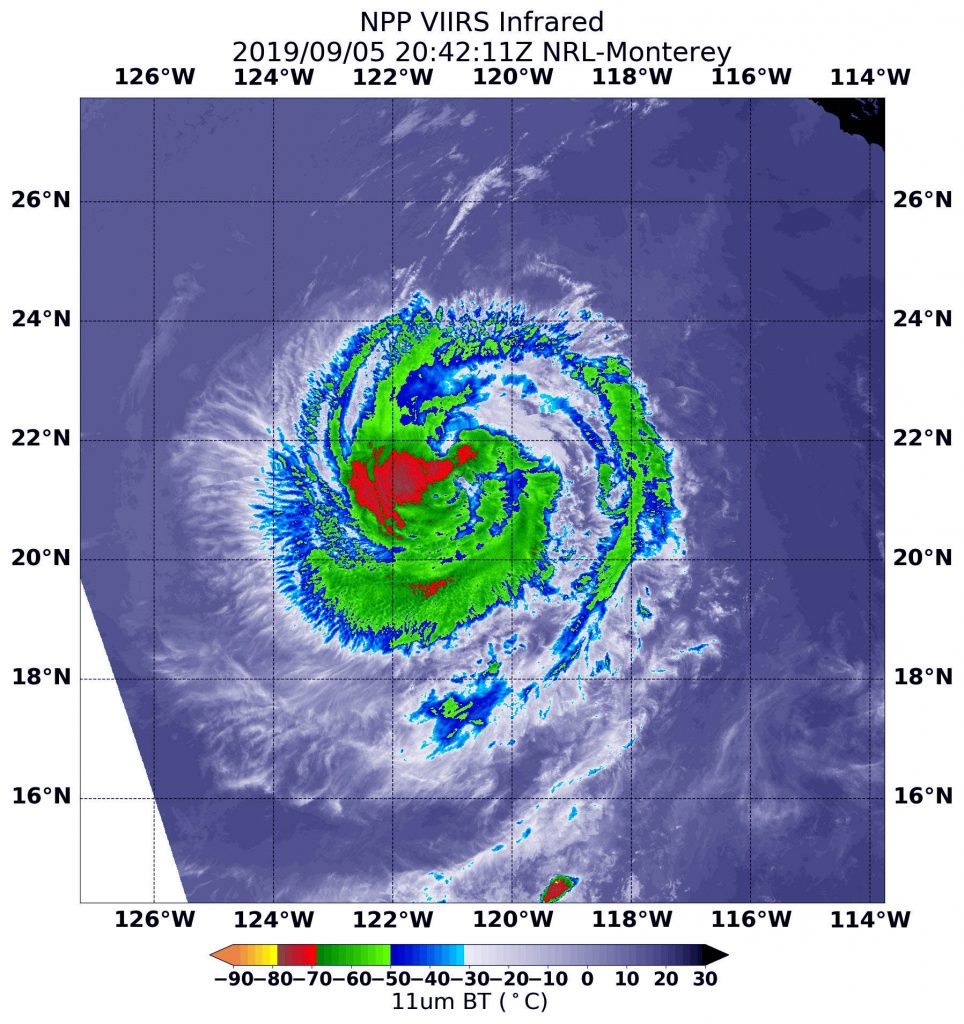
NASA-NOAA’s Suomi NPP satellite passed over Hurricane Juliette in the eastern Pacific Ocean and the VIIRS instrument aboard captured an image of the storm on Sept. 6 at 4:42 p.m. EDT (20:42 UTC). Coldest (red) cloud top temperatures were as cold as minus 70 degrees Fahrenheit (minus 56.6 Celsius). Credit: NASA/NOAA/NRL
At 5:00 a.m. EDT (11:00 PM HST) on Sept. 6, the National Hurricane Center (NHC) projected that Hurricane Juliette would decline to a tropical storm sometime on Friday and NASA had satellites hovering overhead revealed the hurricane’s slow decline.
The NOAA-NASA Suomi NPP satellite passed over the decaying storm on Sept. 5 at 4:42 p.m. EDT (20:42 UTC) and observed the storm using the Visible Infrared Imaging Radiometer Suite (VIIRS) instrument. VIIRS showed the strongest storms were located in the western quadrant of Juliette. The National Hurricane Center noted 18 minutes later, “Deep convection associated with Juliette has decreased in coverage over the past 24 hours, however, the remaining convection still wraps completely around the center.”
Infrared imagery reveals cloud top temperatures, and the higher the cloud top, the colder it is, and the stronger the storm. Coldest cloud top temperatures were as cold as minus 70 degrees Fahrenheit (minus 56.6 Celsius) and found west of the center of circulation. Storms with cloud tops that cold have been found to generate heavy rainfall. Probably due to the fact that Juliette is decaying, the eye is not well-defined in this image and the strongest storms are no longer ringing the eye.
The NHC reported that at 5 a.m. EDT “(0900 UTC), the center of Hurricane Juliette was located near latitude 22.4 degrees north and longitude 122.7 degrees west which is about 815 miles (1,315 km) west of the southern tip of Baja, California. The maximum sustained winds are 80 mph (130 kph). Juliette is moving toward the northwest near 10 mph (17 kph). A motion toward the west-northwest should begin later tonight or Friday. A turn toward the west is forecast on Saturday and a general westward motion should continue through the weekend. The estimated minimum central pressure is 984 millibars.”
NHC predicts that additional weakening during the next few days, and Juliette is expected to become a tropical storm by Friday night, and degenerate into a remnant low pressure area on Sunday.
Sep. 06, 2019 – NASA Examines Dorian’s Rainfall, Temperatures Along Carolina Coast
As Hurricane Dorian continued to lash the coast of the Carolinas NASA’s IMERG assessed the rainfall the storm generated and NASA’s Aqua satellite provided a look at the temperatures of the cloud tops to assess strength.
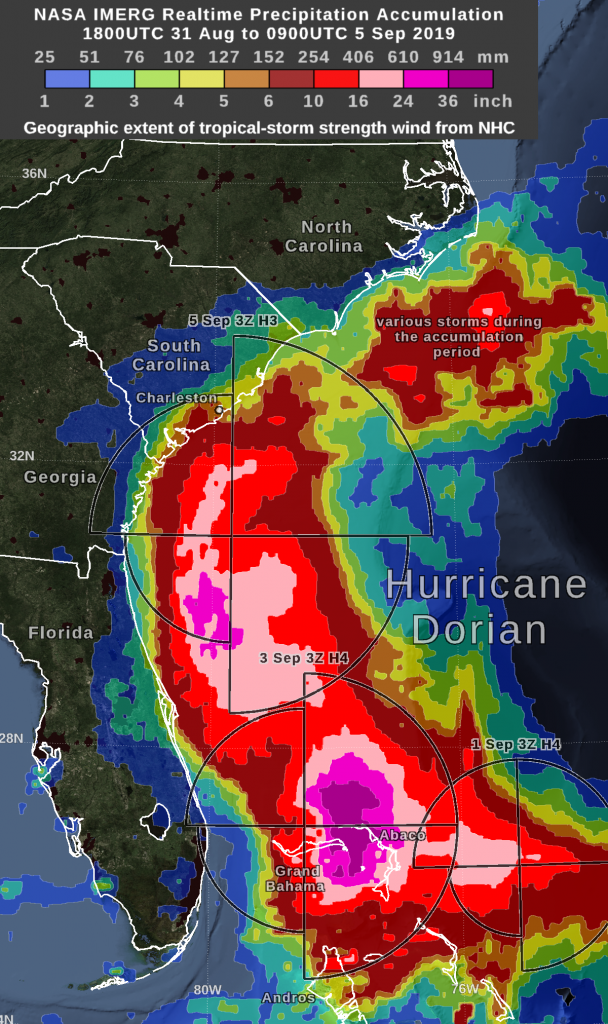
NASA’s IMERG Analyzes Rainfall
NASA’s IMERG showed during the past day, most of the areas experiencing over 10 inches of rain accumulation remained offshore, while Dorian did drop heavy rain on South Carolina and North Carolina. The graphic shows the distance that tropical-storm force (39 mph) winds extend from Hurricane Dorian’s low-pressure center, as estimated by the National Hurricane Center. The Saffir-Simpson intensity category is the number following the “H” in the label on the image. The preliminary reports of tornadoes were obtained from NOAA’s Storm Prediction Center, and are shown on the graphic as red circles. Visualization by NASA Goddard.
By Friday morning, September 6, Hurricane Dorian was located off the coast of North Carolina, having generated tornadoes the previous day as the northern rainband came ashore in North Carolina. NASA’s satellite-based real time precipitation estimates suggest that, during the past day, most of the areas experiencing over 10 inches of rain accumulation remained offshore, while Dorian did drop heavy rain on South Carolina and North Carolina.
IMERG showed largest rainfall amounts of more than 36 inches over the Bahamas and in an area off the coast of northeastern Florida. A large area of rainfall between 16 and 24 inches fell off the coast from South Carolina to the Bahamas and in a small area far off the North Carolina coast.
The National Weather Service in Charleston, South Carolina noted that 3.06” fell yesterday, Sept. 5. In Wilmington, North Carolina, a rainfall record was set when Dorian dropped 8.58 inches. New Bern, North Carolina also set a rainfall record, when Dorian dropped 2.95 inches there.
The near-realtime rain estimates come from the NASA’s IMERG algorithm, which combines observations from a fleet of satellites, in near-realtime, to provide global estimates of precipitation every 30 minutes. The storm-total rainfall at a particular location varies with the forward speed of the hurricane, with the size of the hurricane’s wind field, and with how vigorous the updrafts are inside the hurricane. This graphic only shows precipitation that fell starting at 0000 UTC on September 1, and therefore does not show the precipitation that fell in late August, prior to Hurricane Dorian’s approach to the Bahamas.
More Rainfall Forecast from NHC
Using data from the GPM and other satellites, forecasters can estimate rainfall that Dorian will generate along its path.
The NHC said Dorian is expected to produce the following rainfall totals through Saturday: In northeastern North Carolina and additional 3 to 8 inches is forecast with isolated storm totals to 15 inches. Far southeast Virginia can expect 3 to 8 inches, extreme southeastern New England…2 to 4 inches, Nova Scotia and Prince Edward Island…3 to 5 inches and Newfoundland…1 to 2 inches.
Tornado Possibilities
NHC said a few tornadoes were possible during the morning of Sept. 6 across eastern North Carolina into southeastern Virginia.
As Hurricane Dorian interacted with the U.S. East Coast, the only tornado reports occurred from 4:50 a.m. to 5 p.m. EDT on September 5 in North and South Carolina. Scientists think of a hurricane as a heat engine that converts the warmth of the sun-warmed ocean into the kinetic energy of the hurricane’s strong, horizontal wind. When these strong winds reach land, the increased friction of the land surface vs. the ocean surface can convert some of this kinetic energy into tornadoes within the hurricane.
For information about Dorian’s winds, dangerous surf and storm surge, visit www.nhc.noaa.gov.
NASA’s Aqua Satellite Double View
On Sept. 6 at 3:20 a.m. EDT (0720 UTC), NASA’s Aqua satellite provided temperature data on Hurricane Dorian to show where strongest storms were located (red) with cloud top temperatures as cold as minus 70 degrees Fahrenheit (minus 56.6 Celsius). Credit: NASA/NRL
Two instruments aboard NASA’s Aqua satellite used infrared light to analyze the strength of storms Dorian. Infrared data provides temperature information, and the strongest thunderstorms that reach high into the atmosphere have the coldest cloud top temperatures.
On Sept. 6 at 3:20 a.m. EDT (0720 UTC), NASA’s Aqua satellite provided temperature data on Hurricane Dorian to show where strongest storms were located with cloud top temperatures as cold as minus 70 degrees Fahrenheit (minus 56.6 Celsius).
On Sept. 5 at 8:15 a.m. EDT (1215 UTC), the Moderate Imaging Spectroradiometer or MODIS instrument that flies aboard NASA’s Aqua satellite found strongest thunderstorms had cloud top temperatures as cold as or colder than minus 70 degrees Fahrenheit (minus 56.6 Celsius). Those temperatures were in cloud tops of storms around the low-level center of circulation and in a thick band of thunderstorms that wrapped around the storm from west to north to east. Cloud top temperatures that cold indicate strong storms with the potential to generate heavy rainfall.
This false-colored infrared image of Dorian was generated from data taken from the AIRS instrument aboard NASA’s Aqua satellite on Sept. 6 at 3:17 a.m. EDT (0717 UTC). The purple areas indicate strongest storms which were mostly over the Atlantic Ocean and east of the center. Credit: NASA JPL/Heidar Thrastarson
A second instrument aboard NASA’s Aqua satellite called the Atmospheric Infrared Sounder or AIRS instrument also provided infrared data. That data was false-colored in an infrared image created at NASA’s Jet Propulsion Laboratory in Pasadena, Calif. AIRS gathered that data on Sept. 6 at 3:17 a.m. EDT (0717 UTC). The strongest storms were mostly over the Atlantic Ocean and east of the center.
Warnings and Watches on Sept. 6
The NHC posted many warnings and watches on Sept. 6. A Storm Surge Warning is in effect for Salter Path, NC to Poquoson, VA, for the Pamlico and Albemarle Sounds, the Neuse and Pamlico Rivers and the Hampton Roads area of Virginia. A Hurricane Warning is in effect from Surf City to the North Carolina/Virginia border and for the Pamlico and Albemarle Sounds. A Hurricane Watch is in effect for Nova Scotia, Canada.
A Tropical Storm Warning is in effect for the North Carolina/Virginia border to Fenwick Island, DE, for the Chesapeake Bay from Drum Point southward, for the Tidal Potomac south of Cobb Island, for Woods Hole to Sagamore Beach, MA, and for Nantucket and Martha’s Vineyard, MA. A Tropical Storm Watch is in effect for Prince Edward Island, Canada, the Magdalen Island, Fundy National Park to Shediac, and Francois to Boat Harbour.
The Hurricane Warning and the Tropical Storm Warning have been discontinued west of Surf City, North Carolina. The Storm Surge Warning south of Salter Path, North Carolina has been discontinued.
Hurricane Dorian’s Eye Near Cape Hatteras on Sept. 6
At 8 a.m. EDT on Sept. 6, the National Hurricane Center said the eye of Dorian was near Cape Hatteras, North Carolina. It was located near latitude 35.2 degrees north and longitude 75.7 degrees west. Dorian is moving toward the northeast near 14 mph (22 km/h) and this general motion with an increase in forward speed is expected through Saturday, Sept. 7.
Maximum sustained winds are near 90 mph (150 kph) with higher gusts. Dorian is forecast to become a post-tropical cyclone with hurricane-force winds by Saturday night as it approaches Nova Scotia, Canada.
The estimated minimum central pressure based on data from the Air Force Hurricane Hunters and surface observations is 956 millibars.
On the NHC forecast track, the center of Dorian should move to the southeast of extreme southeastern New England tonight and Saturday morning, and then across Nova Scotia late Saturday or Saturday night.
Sep. 06, 2019 – NASA Sees Gabrielle Go “Post-Tropical…” for Now
The Global Precipitation Measurement mission or GPM core satellite passed over the Eastern Atlantic Ocean and observed that Tropical Storm Gabrielle had become post-tropical. GPM also gathered data on rainfall rates occurring in transformed and elongated storm.
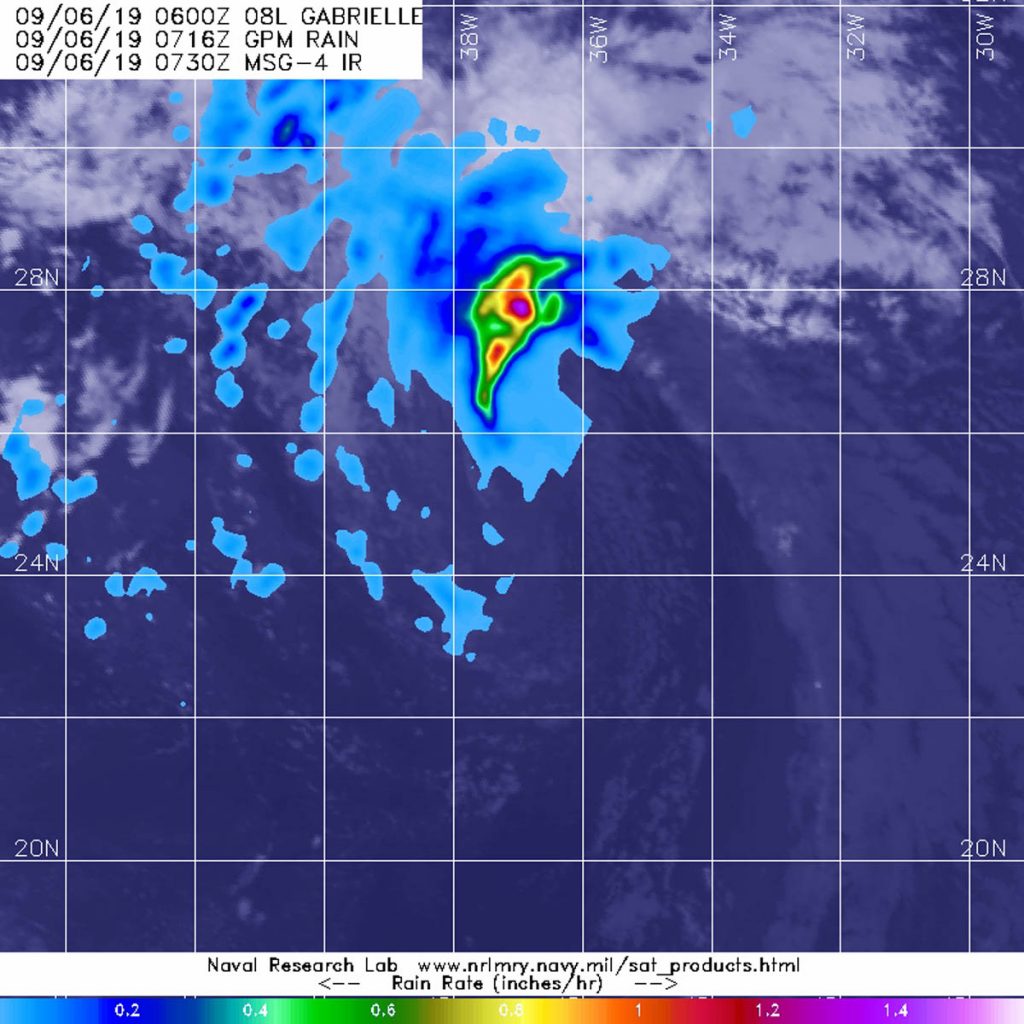
The GPM core satellite passed over Post-Tropical Storm Gabrielle on Sept. 6 at 3:30 a.m. EDT (0730 UTC). GPM found the heaviest rainfall (purple) occurring nearly 200 miles north of the elongated center where it was falling at a rate of over 36 mm (about 1.4 inch) per hour. Areas of rainfall of about 25 mm (1 inch per hour) surrounded those stronger storms. Credit: NASA/JAXA/NRL
NOAA’s National Hurricane Center (NHC) said at 5 a.m. EDT on Sept. 6 that Gabrielle has become a post-tropical cyclone over the eastern Atlantic, because “Poorly defined Gabrielle has not produced any organized deep convection (strong thunderstorms) since Thursday morning.” However, regeneration into a tropical storm is expected to occur over the weekend.
A Post-Tropical Storm is a generic term for a former tropical cyclone that no longer possesses sufficient tropical characteristics to be considered a tropical cyclone. Former tropical cyclones that have become fully extratropical, subtropical, or remnant lows, are three classes of post-tropical cyclones. In any case, they no longer possesses sufficient tropical characteristics to be considered a tropical cyclone. However, post-tropical cyclones can continue carrying heavy rains and high winds.
The GPM satellite passed over Gabrielle on Sept. 6 at 3:30 a.m. EDT (0730 UTC). GPM found the heaviest rainfall in nearly 200 miles north of the elongated center, where it was falling at a rate of over 36 mm (about 1.4 inch) per hour. Areas of rainfall of about 25 mm (1 inch per hour) surrounded those stronger storms. GPM is a joint mission between NASA and the Japan Aerospace Exploration Agency, JAXA.
At 5 a.m. EDT (0900 UTC), NHC reported the center of Post-Tropical Cyclone Gabrielle was located near latitude 25.5 degrees north and longitude 37.6 degrees west. That is about 1,095 miles (1,760 km) northwest of the Cabo Verde Islands. The post-tropical cyclone is moving toward the northwest near 12 mph (19 kph). A turn to the west-northwest with a slight increase in forward speed is expected over the next couple of days. A decrease in forward speed and a turn to the north are forecast to occur by Sunday morning. Maximum sustained winds are near 40 mph (65 kph) with higher gusts.
Gabrielle is expected to weaken into a post-tropical remnant low by tonight. Thereafter, slow strengthening is expected to occur over the weekend, and the remnants of Gabrielle is forecast to regenerate into a tropical cyclone at that time.
Sep. 05, 2019 – NASA-NOAA Satellite Sees Typhoon Lingling’s Eye Near Miyako
Typhoon Lingling’s eye was passing near the island of Miyako when NASA-NOAA’s Suomi NPP satellite passed overhead on Sept. 5. Miyako is one of the Ryukyu Islands located in the Northwestern Pacific Ocean.
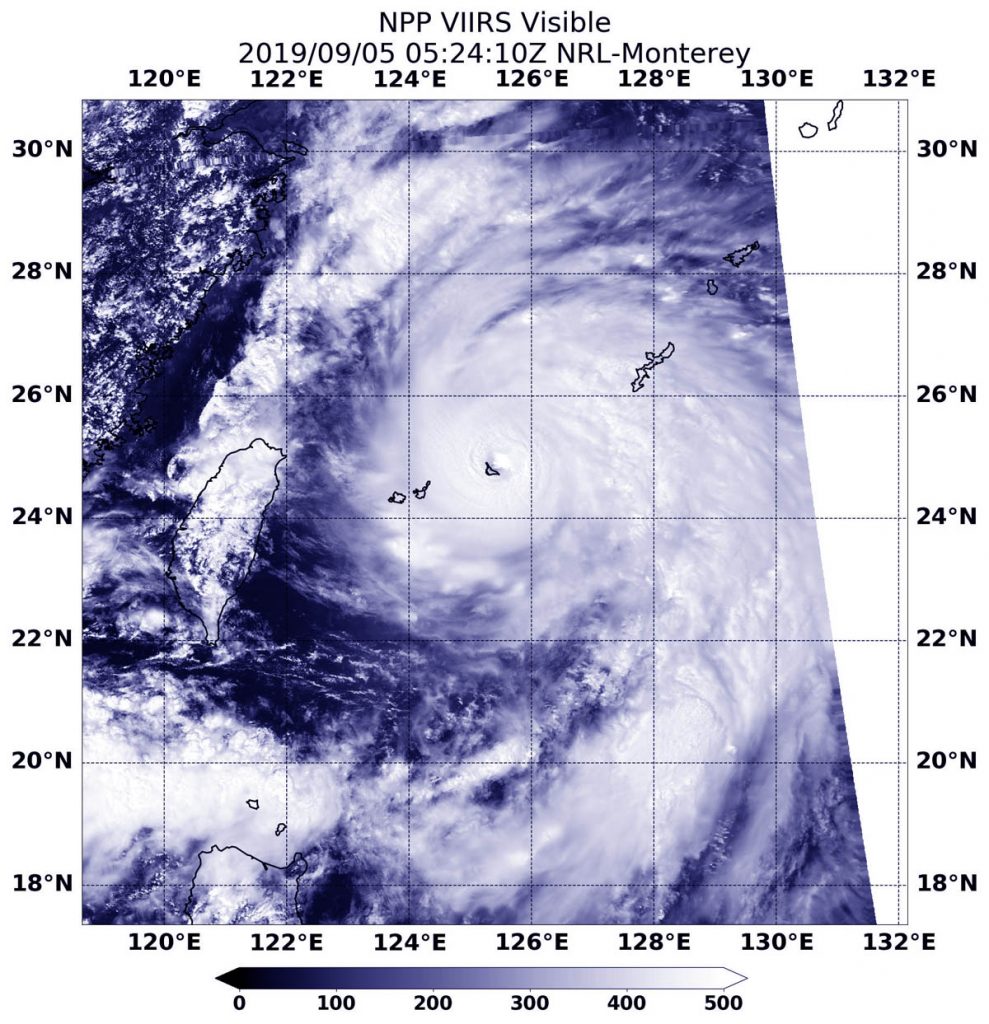
NASA-NOAA’s Suomi NPP satellite passed over Typhoon Lingling and the VIIRS instrument aboard captured this image of the storm on Sept. 5 at 1:24 a.m. EDT (0524 UTC) that showed the southwestern part of the eye near the Ryukyu Island chain’s Miyako Island. Credit: NASA/NOAA/NRL
The Ryukyu Islands are a chain of Japanese islands that stretch southwest from Kyushu to Taiwan.
On Sept. 5 at 1:24 a.m. EDT (0524 UTC), the Visible Infrared Imaging Radiometer Suite (VIIRS) instrument aboard Suomi NPP captured the visible image that showed the southwestern eyewall of Typhoon Lingling over the island of Miyako. In the image, Okinawa was being affected by the northeastern quadrant of the storm, and the islands of Senkaku and Yaeyama were experiencing winds and rain from the southwestern quadrant.
At 11 a.m. EDT (1500 UTC) on Sept. 5, the Joint Typhoon Warning Center (JTWC) noted that Lingling had maximum sustained winds near 115 knots. It was centered near 25.7 degrees north latitude and 125.3 degrees east longitude, about 143 miles west-southwest of Kadena Air Base, Okinawa Island, Japan. It was moving to the north.
Lingling is moving north and the JTWC forecasters noted it has reached peak intensity. The system is expected to weaken on approach to the Korean peninsula, but still be at typhoon strength at landfall near Pyongyang, North Korea.
Sep. 05, 2019 – Tropical Storm Faxai Gets a Name and NASA Gets an Infrared Picture
Tropical Storm 14W has been moving through the Northwestern Pacific Ocean for several days and has now been renamed Faxai. NASA’s Aqua satellite passed over the newly renamed storm and took the temperature of Faxai’s clouds and storms.
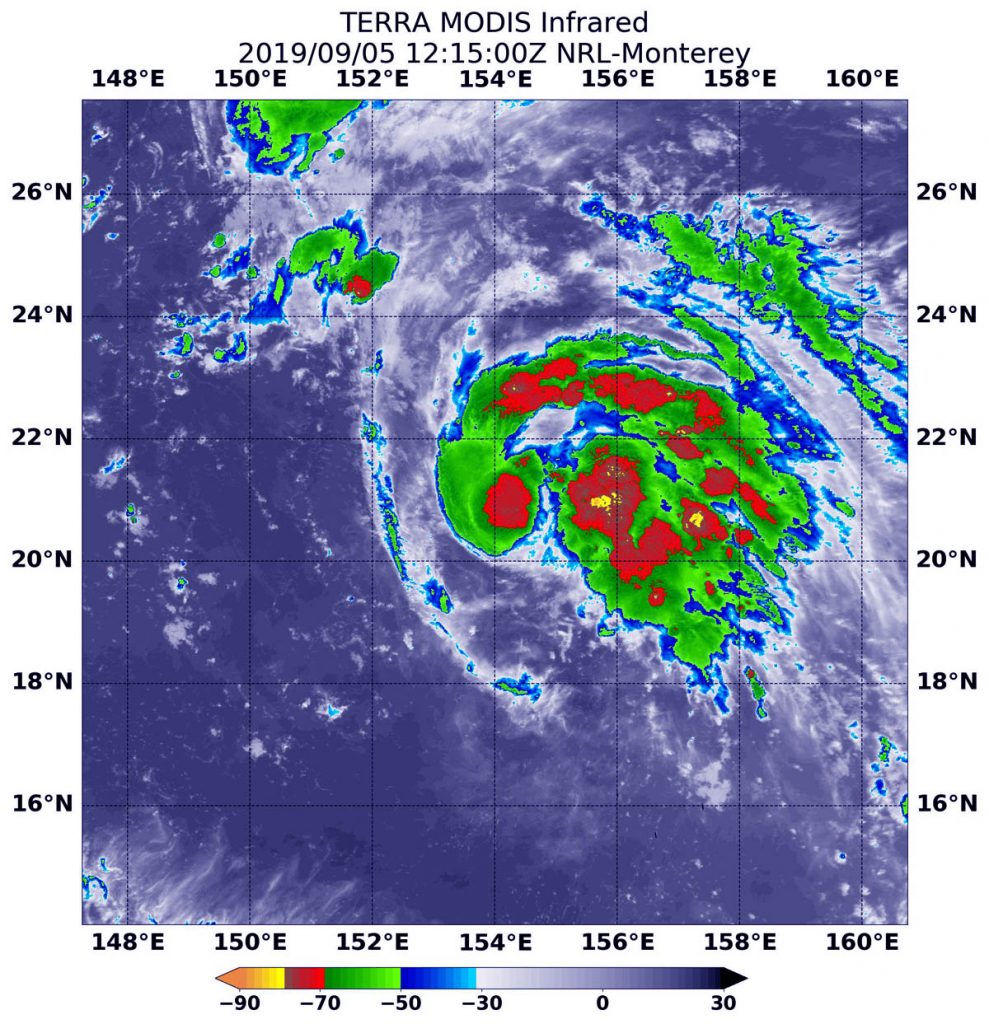
On Sept. 5 at 8:15 a.m. EDT (1215 UTC), the MODIS instrument that flies aboard NASA’s Aqua satellite showed strongest storms around Faxai’s center and in a curved band of thunderstorms from west to north to east. In those areas, cloud top temperatures were as cold as minus 70 degrees Fahrenheit (minus 56.6 Celsius). Credit: NASA/NRL
NASA’s Terra satellite used infrared light to analyze the strength of storms in the remnants of Tropical Storm Faxai. Infrared data provides temperature information, and the strongest thunderstorms that reach high into the atmosphere have the coldest cloud top temperatures.
On Sept. 5 at 8:15 a.m. EDT (1215 UTC), the Moderate Imaging Spectroradiometer or MODIS instrument that flies aboard NASA’s Terra satellite found strongest thunderstorms had cloud top temperatures as cold as or colder than minus 70 degrees Fahrenheit (minus 56.6 Celsius). Those temperatures were in cloud tops of storms around the low-level center of circulation and in a thick band of thunderstorms that wrapped around the storm from west to north to east. Cloud top temperatures that cold indicate strong storms with the potential to generate heavy rainfall.
The imagery also showed the southwestern side was cloud free, and that is because of sinking air, or subsidence, which prevents the development of thunderstorms. It is being caused by an elongated area of low pressure located to the south of the storm and a Tutt Cell to the north. A Tutt Cell is a Tropical Upper Tropospheric Trough (elongated area of low pressure).
On Sept. 5 at 11 a.m. EDT (1500 UTC), Tropical Storm Faxai, formerly known as 14W, was located near 20.8 degrees north latitude and 154.0 degrees east longitude. That is about 742 nautical miles east-southeast of Iwo To island, Japan. Faxai was moving to the north-northwest and had maximum sustained winds 40 knots (46 mph/74 kph).
The Joint Typhoon Warning Center (JTWC) expects Faxai will move west-northwest across the Northwestern Pacific Ocean and turn north after three days. It is expected to make landfall near Tokyo at 80 knots on Sunday, Sept. 8.
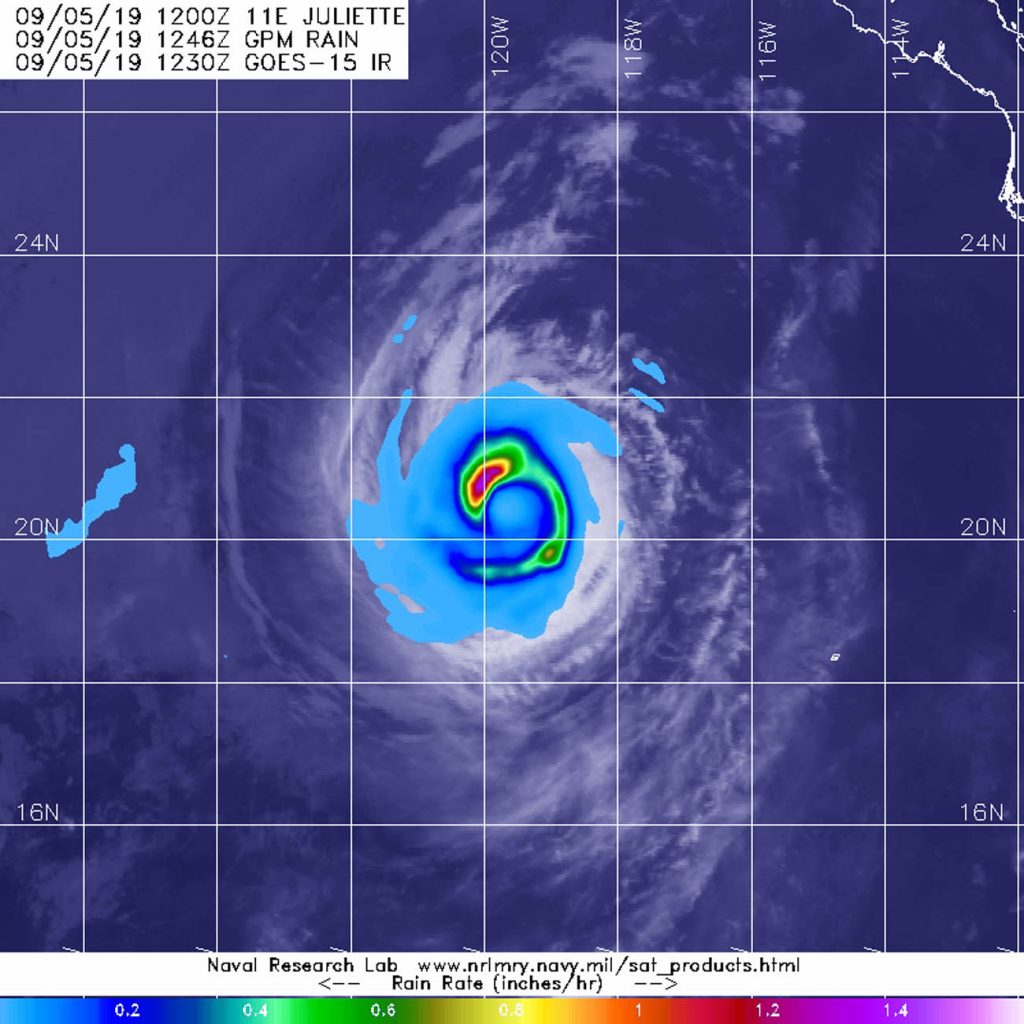
Sep. 05, 2019 – Satellite Finds a “Hook” of Heavy Rainfall in Hurricane Juliette
From its vantage point in orbit around the Earth, when the Global Precipitation Measurement mission or GPM core satellite passed over the Eastern Pacific Ocean, it gathered data on rainfall rates occurring in Hurricane Juliette. The areas of strongest rainfall resembled a hook.
The GPM core satellite passed over Juliette on Sept. 5 at 8:46 a.m. EDT (1246 UTC). GPM found the heaviest rainfall (purple) in the northwest of thunderstorms circling the center where it was falling at a rate of over 36 mm (about 1.4 inch) per hour. Heavy rainfall of about 25 mm (1 inch per hour) (in yellow and orange) stretched east and south in that same band circling the eye of the storm, giving the appearance of a hook around the storm’s eye. Credit: NASA/JAXA/NRL
The GPM satellite passed over Juliette on Sept. 5 at 8:46 a.m. EDT (1246 UTC). GPM found the heaviest rainfall in the northwest of thunderstorms circling the center where it was falling at a rate of over 36 mm (about 1.4 inch) per hour. Heavy rainfall of about 25 mm (1 inch per hour) stretched east and south in that same thunderstorm band circling the eye of the storm, giving the appearance of a hook around the storm’s eye. GPM is a joint mission between NASA and the Japan Aerospace Exploration Agency, JAXA.
At 5 a.m. EDT (2 a.m. PDT) on Sept. 5, the National Hurricane Center (NHC) noted, “Juliette’s cloud pattern has changed little during the past several hours. If anything, the spiral bands appear to have improved a bit in the western portion of the cyclone.” At that time, the center of Hurricane Juliette was located near latitude 20.2 degrees north and longitude 119.1 degrees west. That’s about 620 miles (995 km) west-southwest of the southern tip of Baja California, Mexico.
Juliette is moving toward the northwest near 9 mph (15 kph). The hurricane is expected to move to the west-northwest at a slightly faster forward speed on Friday and should continue this motion through Saturday. Maximum sustained winds remain near 90 mph (150 kph) with higher gusts. The estimated minimum central pressure is 976 millibars.
Gradual weakening is forecast to resume today [Sept. 5] as the storm is expected to move over cooler sea surface temperature and encounter dry air and outside winds (vertical wind shear). Further weakening is expected during the next several days. Juliette should weaken to a tropical storm on Friday.
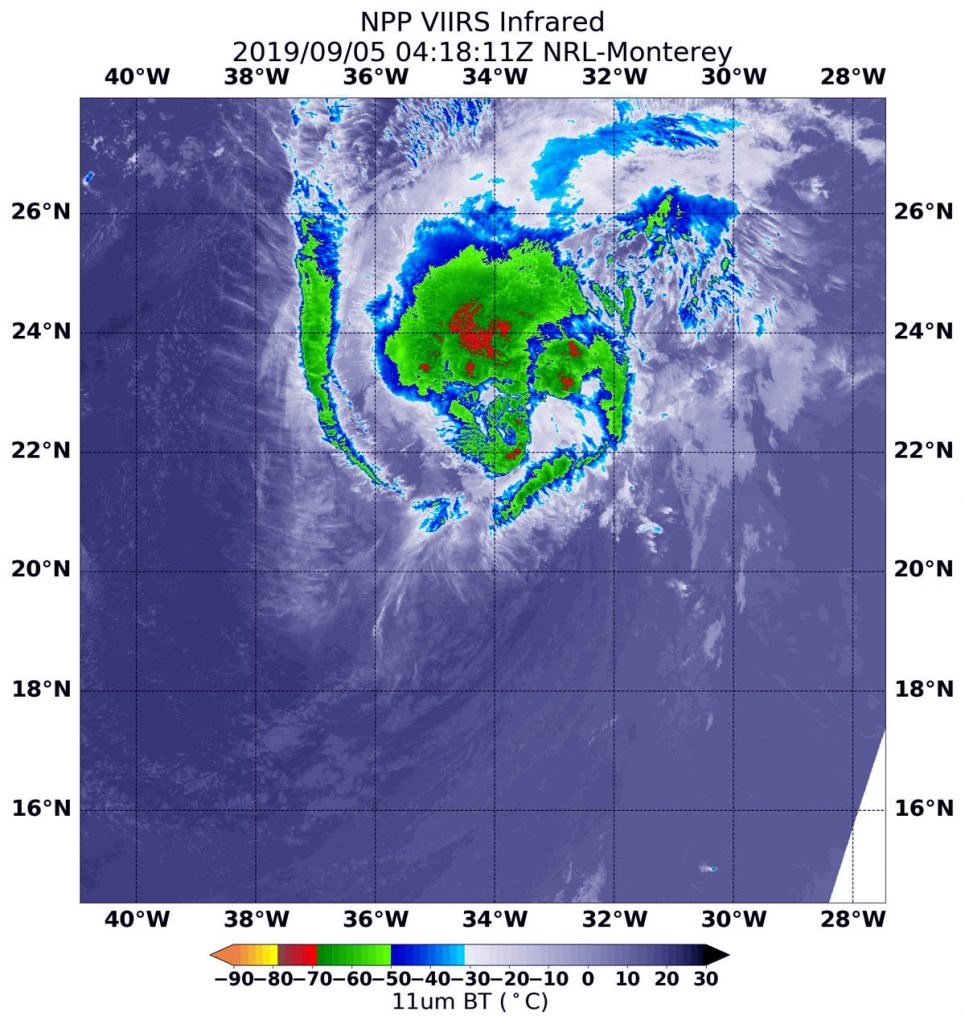
NASA-NOAA’s Suomi NPP satellite passed over the eastern Atlantic Ocean and infrared data revealed that the storm was being adversely affected by wind shear, pushing its strongest storms northeast of its center.
NASA-NOAA’s Suomi NPP satellite passed over Tropical Storm Gabrielle and the VIIRS instrument aboard captured this image of the storm on Sept. 5 at 12:18 a.m. EDT (0418 UTC). Suomi NPP found strongest thunderstorms north of the center had cloud top temperatures as cold as minus 70 degrees Fahrenheit (minus 56.6 Celsius). Credit: NASA/NOAA/NRL
NASA-NOAA’s Suomi NPP satellite used infrared light to analyze the strength of storms in the remnants of Tropical Storm Gabrielle. Infrared data provides temperature information, and the strongest thunderstorms that reach high into the atmosphere have the coldest cloud top temperatures.
On Sept. 5 at 12:18 a.m. EDT (0418 UTC), the Visible Infrared Imaging Radiometer Suite (VIIRS) instrument aboard Suomi NPP found strongest thunderstorms northeast of the center had cloud top temperatures as cold as minus 70 degrees Fahrenheit (minus 56.6 Celsius). Cloud top temperatures that cold indicate strong storms with the potential to generate heavy rainfall. The southern quadrant of the storm appeared to be almost devoid of clouds because of outside winds blowing from the southwest, or southwesterly vertical wind shear.
In general, wind shear is a measure of how the speed and direction of winds change with altitude. Tropical cyclones are like rotating cylinders of winds. Each level needs to be stacked on top each other vertically in order for the storm to maintain strength or intensify. Wind shear occurs when winds at different levels of the atmosphere push against the rotating cylinder of winds, weakening the rotation by pushing it apart at different levels.
NOAA’s National Hurricane Center (NHC) noted in the discussion on Sept. 5, “Although Gabrielle could experience some intensity fluctuations during the next 24 hours, the cyclone should remain in a rather harsh environment during the next 36 to 48 hours, due to south to southwesterly vertical [wind] shear, some dry air in the middle portions of the atmosphere, and oceanic sea surface temperatures on the order of 25 to 26 Celsius.” Afterward, gradual strengthening is forecast as Gabrielle moves into a more favorable environment.
At 5 a.m. EDT (0900 UTC) NOAA’s National Hurricane Center (NHC) said the center of Tropical Storm Gabrielle was located near latitude 21.9 degrees north and longitude 35.0 degrees west. That’s about 825 miles (1,330 km) west-northwest of the Cabo Verde Islands. Gabrielle is moving toward the northwest near 8 mph (13 kph), and this motion is expected to continue for the next few days with an increase in forward speed. Maximum sustained winds remain near 50 mph (85 kph) with higher gusts. The estimated minimum central pressure is 1002 mb (29.59 inches).
The NHC said, “Little change in strength is forecast during the next couple of days. Afterward, some slow strengthening is expected to begin by this weekend.”
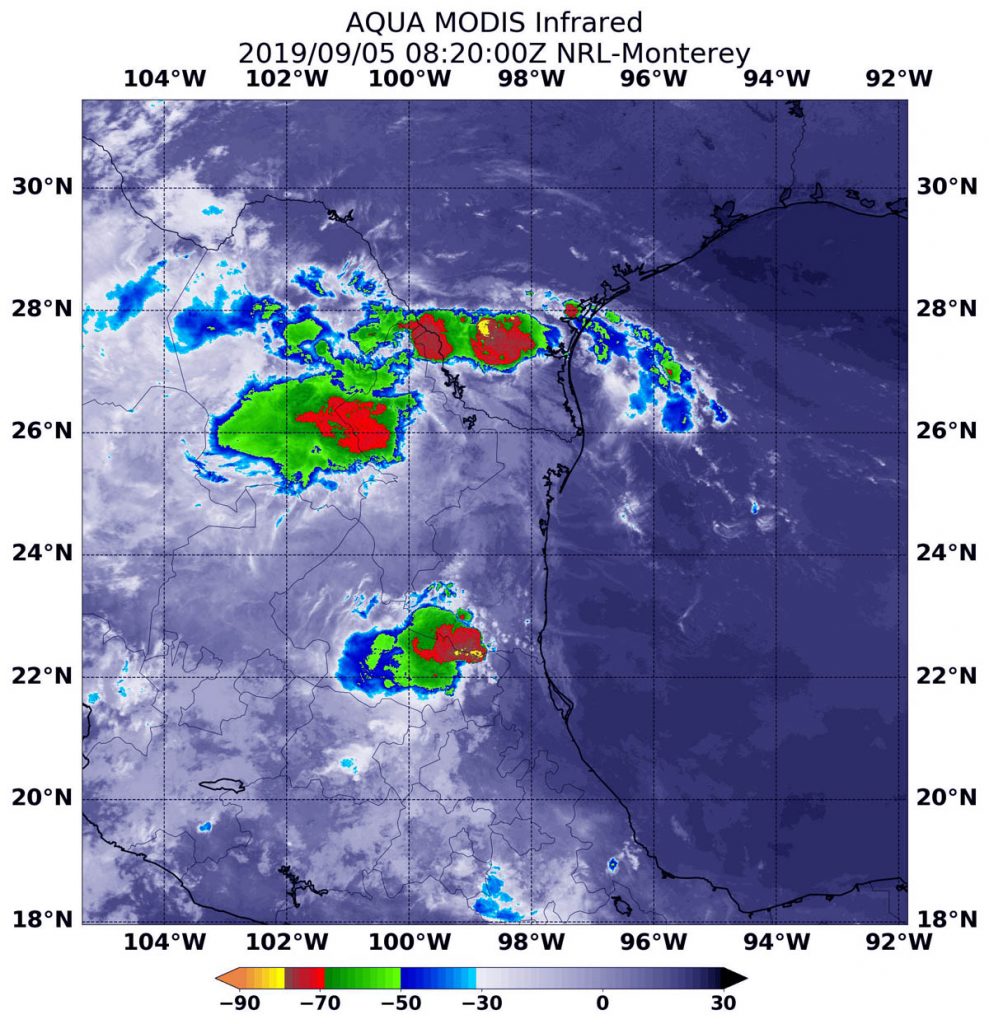
Sep. 05, 2019 – NASA Finds a Few Strong Storms Left in Fernand’s Remnants Over Northeastern Mexico
Tropical Storm Fernand made landfall in northeastern Mexico and began dissipating. However, infrared imagery from NASA’s Aqua satellite shows that there are still fragmented strong storms left in the tropical cyclone’s remnants. Those storms have the potential to generate heavy rainfall and there were warnings posted on Sept. 5.
On Sept. 5 at 4:20 a.m. EDT (0820 UTC) the MODIS instrument that flies aboard NASA’s Aqua satellite showed strongest storms (red) in fragmented thunderstorms in the remnants of Fernand over northeastern Mexico. There, cloud top temperatures were as cold as minus 70 degrees Fahrenheit (minus 56.6 Celsius). Credit: NASA/NRL
NASA’s Aqua satellite used infrared light to analyze the strength of storms in the remnants of Tropical Storm Fernand. Infrared data provides temperature information, and the strongest thunderstorms that reach high into the atmosphere have the coldest cloud top temperatures.
On Sept. 5 at 4:20 a.m. EDT (0820 UTC), the Moderate Imaging Spectroradiometer or MODIS instrument that flies aboard NASA’s Aqua satellite found strongest thunderstorms had cloud top temperatures as cold as minus 70 degrees Fahrenheit (minus 56.6 Celsius). Cloud top temperatures that cold indicate strong storms with the potential to generate heavy rainfall.
The Servicio Meteorológico Nacional (SMN) is Mexico’s national weather organization. On Sept. 5, SMN issued several warnings for rainfall from Fernand’s remnants. SMN forecasters expect rainfall will total up to 15 inches over northeastern Mexico. In Tamaulipas less than one additional inch is expected. However, in central and southern Nuevo Leon, another 3 to 6 inches is expected. In northern Nuevo Leon and southern Coahuila, 2 to 5 inches are forecasts, and south Texas and the lower Texas coast can expect between 1 to 2 inches, totalling 6 inches in that area.
NOAA’s National Hurricane Center (NHC) issued the final advisory on the remnants of Fernand at 0300 UTC on Sept. 5 (11 p.m. EDT on Sept. 4). At that time, the remnants were centered near 23.0 degrees north latitude and 99.0 degrees west longitude. That’s about 130 miles west-southwest of the mouth of the Rio Grande River. The remnants were moving to the west-northwest and the remnants had maximum sustained winds near 30 knots (34.5 mph/55.5 kph).
Fernand is expected to dissipate over the next day or two.
Sep. 05, 2019 – Update #2 – NASA Measures Dorian’s Heavy Rainfall from Bahamas to Carolinas
Hurricane Dorian continues to generate tremendous amounts of rainfall, and has left over three feet of rain in some areas of the Bahamas and is now lashing the Carolinas. NASA’s IMERG product provided a look at those rainfall totals.
By September 5, Hurricane Dorian had dumped heavy rain on coastal South Carolina. An even greater accumulation of over 10 inches was occurring off shore along the path of Dorian’s inner core. In part because of Hurricane Dorian’s forward motion during the past two days, the recent rainfall totals have remained below the 36-inch accumulation observed when Dorian was stalled over the Bahamas. The graphic shows the distance that tropical-storm force (39 mph) winds extend from Hurricane Dorian’s low-pressure center as reported by the National Hurricane Center. The Saffir-Simpson intensity category is the number following the “H” in the label on the image. Credit: NASA Goddard.
By Thursday morning, September 5, Hurricane Dorian had dumped heavy rain on coastal South Carolina. An even greater accumulation of over 10 inches was occurring off shore along the path of Dorian’s inner core. In part because of Hurricane Dorian’s forward motion during the past two days, the recent rainfall totals have remained below the 36-inch accumulation observed when Dorian was stalled over the Bahamas.
NASA has the ability to estimate the rainfall rates occurring in a storm or how much rain has fallen. Rainfall imagery was generated using the Integrated Multi-satEllite Retrievals for GPM or IMERG product at NASA’s Goddard Space Flight Center in Greenbelt, Maryland. These near-realtime rain estimates come from the NASA IMERG algorithm, which combines observations from a fleet of satellites in the GPM or Global Precipitation Measurement mission constellation of satellites, and is calibrated with measurements from the GPM Core Observatory as well as rain gauge networks around the world. The measurements are done in near-real time, to provide global estimates of precipitation every 30 minutes.
The storm-total rainfall at a particular location varies with the forward speed of the hurricane, with the size of the hurricane’s wind field, and with how vigorous the updrafts are inside the hurricane.
This false-colored infrared image taken from NASA’s Aqua satellite on Sept. 4 at 2:29 p.m. EDT (18:29 UTC) shows Dorian after it re-strengthened into a Category 3 hurricane off the Georgia and South Carolina coast. The image shows a clear eye in the storm. Intense storms capable of generating heavy rainfall appear in purple. Credit: NASA JPL/Heidar Thrastarson
Warnings and Watches on Sept. 5
NOAA’s National Hurricane Center noted the following warnings and watches on Sept. 5. A Storm Surge Warning is in effect from the Savannah River to Poquoson, VA, Pamlico and Albemarle Sounds, Neuse and Pamlico Rivers and Hampton Roads, VA. A Hurricane Warning is in effect from the Savannah River to the North Carolina/Virginia border and for the Pamlico and Albemarle Sounds. A Tropical Storm Warning is in effect from the North Carolina/Virginia border to Chincoteague, VA, and for the Chesapeake Bay from Smith Point southward. A Tropical Storm Watch is in effect for north of Chincoteague VA to Fenwick Island, DE and the Chesapeake Bay from Smith Point to Drum Point, the Tidal Potomac south of Cobb Island, Woods Hole to Sagamore Beach, MA, Nantucket and Martha’s Vineyard, MA.
NHC: Dorian’s Status on Sept. 5
This near visible image taken from NASA’s Aqua satellite on Sept. 4 at 2:29 p.m. EDT (18:29 UTC) shows Dorian after it re-strengthened into a Category 3 hurricane off the Georgia and South Carolina coast. Credit: NASA JPL/Heidar Thrastarson
NHC’s latest bulletin at 8 a.m. EDT (1200 UTC) noted the eye of Hurricane Dorian was located near latitude 32.1 degrees North, longitude 79.3 degrees West. That puts the eye of Dorian about 70 miles (115 km) south-southeast of Charleston, South Carolina. Dorian is now moving toward the north-northeast near 8 mph (13 kph). Maximum sustained winds are near 115 mph (185 km/h) with higher gusts. Dorian is a category 3 hurricane on the Saffir-Simpson Hurricane Wind Scale. Some fluctuations in intensity are expected this morning, followed by slow weakening through Saturday. However, Dorian is expected to remain a hurricane for the next few days. Hurricane-force winds extend outward up to 60 miles (95 km) from the center, and tropical-storm-force winds extend outward up to 195 miles (315 km). Charleston International Airport recently reported a wind gust of 61 mph (98 kph). The estimated minimum central pressure based on Air Force Reserve Hurricane Hunter data is 959 millibars.
Dorian’s Forecast Path
The National Hurricane Center forecast calls for Dorian to turn toward the northeast by tonight, and a northeastward motion at a faster forward speed is forecast on Friday. On the forecast track, the center of Dorian will continue to move close to the coast of South Carolina today, and then move near or over the coast of North Carolina tonight and Friday. The center should move to the southeast of extreme southeastern New England Friday night and Saturday morning, and approach Nova Scotia later on Saturday.
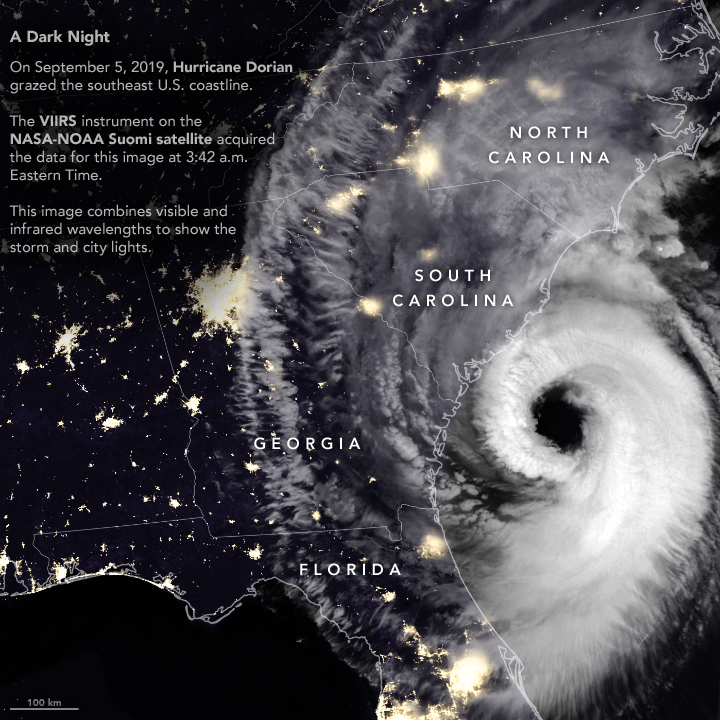
The Visible Infrared Imaging Radiometer Suite (VIIRS) on the Suomi NPP satellite captured this nighttime composite image as the storm approached the coast at 3:42 a.m. Eastern Time (07:42 UTC) on September 5, 2019. Credit: NASA/NOAA
After devastating the Bahamas and grazing Florida and Georgia, Hurricane Dorian rebounded and raked the coast of South Carolina with strong winds, heavy rains, and a storm surge. Wind, falling trees, and flooding damaged power infrastructure in coastal areas of the southeast U.S.
The Visible Infrared Imaging Radiometer Suite (VIIRS) on the Suomi NPP satellite captured this nighttime composite image as the storm approached the coast at 3:42 a.m. Eastern Time (07:42 UTC) on September 5, 2019. At the time, Dorian packed maximum sustained winds of 115 miles (185 kilometers) per hour and was moving north at 8 miles per hour.
The VIIRS sensor observed thick cloud bands circulating around Dorian’s large eye, the part of the storm with mostly calm weather and the lowest atmospheric pressure. Hurricane eyes average about 20 miles (32 kilometers); the National Hurricane Center reported Dorian’s eye had a diameter of 50 miles (80 kilometers) around the time this image was acquired. Thinner clouds—part of the storm’s higher-level outflow—extended well inland across Georgia, South Carolina, and North Carolina.
The VIIRS image was captured by the sensor’s day-night band, which detects light in a range of wavelengths from green to near-infrared and uses filtering techniques to observe signals such as gas flares, city lights, and reflected moonlight. Infrared observations from VIIRS were used to enhance the visibility of clouds. Optical MODIS satellite data was layered into the image to make it easier to distinguish between ocean and land surfaces.
As of 2 p.m. on September 5, several utility companies and Poweroutages.us were reporting more than 240,000 outages in South Carolina. The hardest hit area was Charleston County, where companies were reporting more than 130,000 outages. Credit: PowerOutage.us
It is not possible to identify the locations of power outages based on the VIIRS night light image alone. However, as of 2 p.m. on September 5, several utility companies and Poweroutages.us were reporting more than 240,000 outages in South Carolina. The hardest hit area was Charleston County, where companies were reporting more than 130,000 outages.
In the coming days, forecasters expect Dorian to move near or over the coast of North Carolina and then toward New England and Nova Scotia.