Gelena (Southern Indian Ocean)

Feb. 11, 2018 – NASA’s Aqua Satellite Shows Winds Shear Affecting Tropical Cyclone Gelena

Visible imagery from NASA’s Aqua satellite revealed the effects of wind shear on Tropical Cyclone Gelena in the Southern Indian Ocean. The storm weakened to a tropical storm.

MODIS image of Gelena
On Feb. 11, 2019, the MODIS instrument aboard NASA’s Aqua satellite captured a visible light image of Tropical Cyclone Gelena in the Southern Indian Ocean. Wind shear pushed the bulk of clouds and storms east of the center. Credit: NASA Worldview, Earth Observing System Data and Information System (EOSDIS)

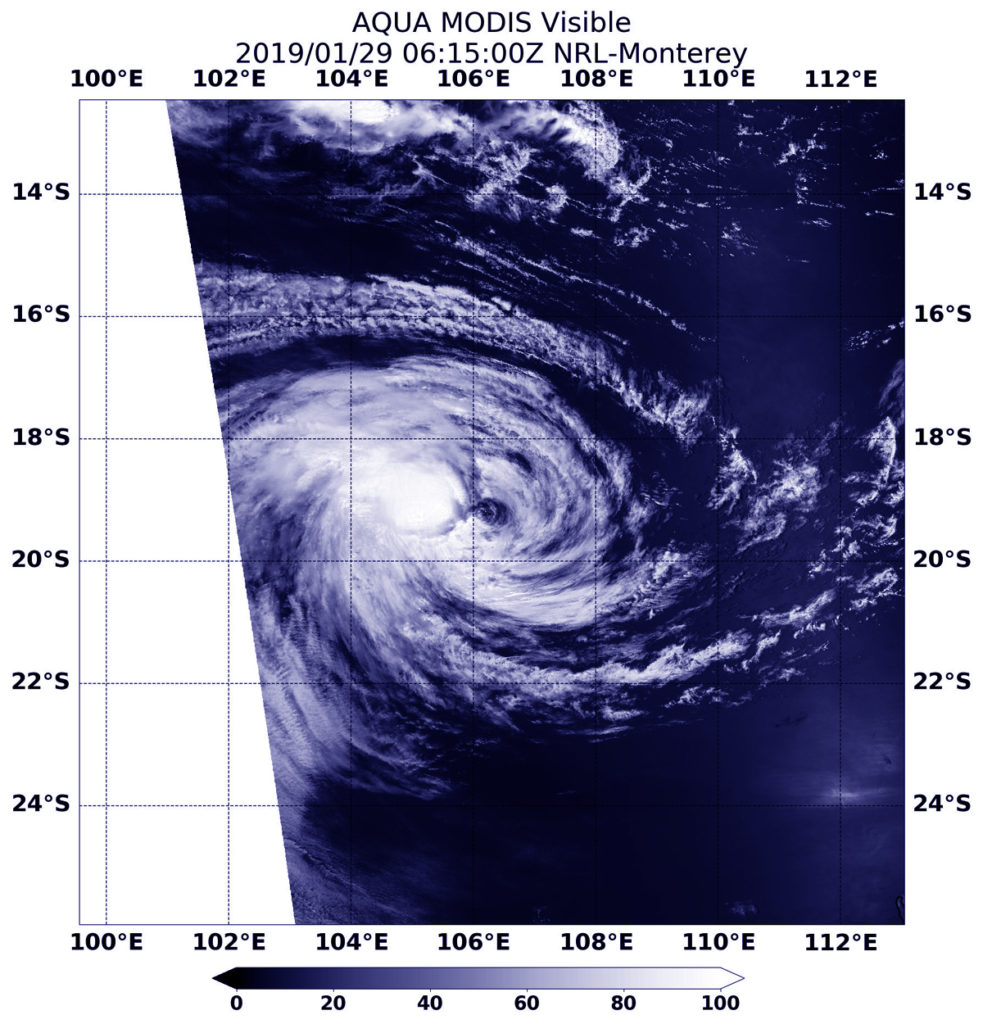
On Feb. 11, 2019, the Moderate Resolution Imaging Spectroradiometer or MODIS instrument aboard NASA’s Aqua satellite captured a visible image of Tropical Cyclone Gelena. Westerly wind shear pushed the bulk of clouds and storms east of the center. Wind shear is a measure of how the speed and direction of winds change with altitude.

At 10 a.m. EDT (1500 UTC) on Feb. 11, Gelena was located near 24.6 degrees south latitude and 70.3 east longitude, approximately 745 nautical miles east-southeast of Port Louis, Mauritius. Gelena was moving to the southeast. Maximum sustained winds were near 55 knots (63 mph/102 kph).

Forecasters at the Joint Typhoon Warning Center expect Gelena to dissipate in three days, by February 14.

By Rob Gutro
NASA’s Goddard Space Flight Center

Gelena (Southern Indian Ocean)

Feb. 8, 2019 – NASA’s Aqua Satellite Finds Tropical Cyclone Gelena’s Strongest Side

NASA’s Aqua satellite passed over the Southern Indian Ocean and captured an infrared image of Tropical Cyclone Gelena that revealed strongest storms were northwest of the eye.

Satellite image of storm Gelena
At 5:05 a.m. EST (1005 UTC) on Feb. 8, the MODIS instrument that flies aboard NASA’s Aqua satellite gathered infrared data on Tropical Cyclone Gelena. Strongest thunderstorms were in the northwestern quadrant of the storm, where cloud top temperatures were as cold as minus 80 degrees Fahrenheit (minus 62 Celsius) and appear in yellow in this false colored image. Credit: NASA/NRL

On Feb. 8, a tropical cyclone warning class 2 is in force at Mauritius and Rodrigues.

At 5:05 a.m. EST (1005 UTC) on Feb. 8 the MODIS instrument that flies aboard NASA’s Aqua satellite gathered infrared data on Tropical Cyclone Gelena. Infrared data provides temperature information. MODIS found coldest cloud top temperatures as cold as minus 80 degrees Fahrenheit (minus 62 Celsius) in storms in the northwestern quadrant, outside of the eye. NASA research has shown that cloud tops with temperatures that cold were high in the troposphere and have the ability to generate heavy rain.

At 10 a.m. EDT (1500 UTC), the center of Tropical Cyclone Gelena was located near latitude 15.7 degrees south and longitude 55.3 degrees east. That’s about 288 nautical miles north-northwest of Port Louis, Mauritius. Maximum sustained winds were near 105 knots (121 mph/194.5 kph) and strengthening.

The Joint Typhoon Warning Center noted that Gelena will strengthen to 130 knots (149.6 /241 kph) within 24 hours. Although a weakening trend will then begin, Gelena is forecast to have winds of about 120 knots (138 mph/222 kph) upon closest approach to Rodrigues on Feb. 9.

Rob Gutro
NASA’s Goddard Space Flight Center, Greenbelt, Md.

Funani (Southern Indian Ocean)

Feb. 8, 2019 – NASA Looks at Tropical Cyclone Funani’s Rainfall Rates

Tropical Cyclone Funani continued tracking southeast through the Southern Indian Ocean on Feb. 7, 2019. When the GPM satellite passed overhead, it revealed that Funani’s strongest rains wrapped around the center and extended northwest.

The Global Precipitation Measurement mission, or GPM, core satellite passed over Tropical Cyclone Funani on Feb. 8. GPM found the heaviest rainfall around the center and a fragmented band of thunderstorms northwest of center. In both areas rain was falling at a rate between 10 and 13 mm (0.4 and 0.5 inches) per hour. GPM is a joint mission between NASA and the Japan Aerospace Exploration Agency, JAXA.

satellite image of Funani rainfall
The GPM core satellite passed over Tropical Cyclone Funani on Feb. 8, 2019. GPM found the heaviest rainfall (red) was around the center and a fragmented band of thunderstorms northwest of center. In both areas rain was falling at a rate between 10 and 13 mm (0.4 and 0.5 inches) per hour. Credit: NASA Worldview, Earth Observing System Data and Information System (EOSDIS), JAXA
Link to high-res image: https://go.nasa.gov/2Sg1ASi

At 10 a.m. EST (1500 UTC), the center of Funani was located near latitude 24.4 degrees south and longitude 71.2 degrees west. That’s about 813 nautical miles east-southeast of Port Louis, Mauritius. Maximum sustained winds were near 105 knots (121 mph/195 kph).

Forecasters at the Joint Typhoon Warning Center expect Funani will continue to move southeast. The storm will gradually weaken before becoming extra-tropical after a day or so.

Rob Gutro
NASA’s Goddard Space Flight Center, Greenbelt, Md.  

Gelena (Southern Indian Ocean)

Feb. 7, 2019 – NASA Satellite Shows Tropical Cyclone Gelena Near Madagascar

A visible-light image from NASA’s Terra satellite revealed Tropical Cyclone Gelena was strengthening off the northeastern coast of Madagascar.

Satellite image of Gelena
On Feb. 7, 2019, the MODIS instrument aboard NASA’s Terra satellite provided a visible-light image of Tropical Cyclone Gelena in the Southern Indian Ocean. The image showed thunderstorms wrapping into the low-level center. Credit: NASA Worldview, Earth Observing System Data and Information System (EOSDIS)
High-resolution Link: https://go.nasa.gov/2HYKvru

On Feb. 7, 2019, the Moderate Resolution Imaging Spectroradiometer, or MODIS, instrument aboard NASA’s Terra satellite captured a visible image of Tropical Cyclone Gelena. The visible-light image showed bands of thunderstorms wrapping into what the Joint Typhoon Warning Center called “an intermittent eye feature.” The western quadrant had the bulk of clouds and thunderstorms that extended to the northern tip of Madagascar.

At 10 a.m. EDT (1500 UTC) on Feb. 7, Gelena was located near 13.1 degrees south latitude and 53.7 east longitude, approximately 453 nautical miles north-northwest of St. Denis, La Reunion Island. Gelena was moving to south-southeast. Maximum sustained winds were near 75 knots (86 mph/139 kph). Gelena is a Category 1 hurricane on the Saffir-Simpson hurricane scale.

Forecasters at the Joint Typhoon Warning Center expect Gelena to strengthen rapidly while moving southeast. Gelena is forecast to move away from Madagascar over the next several days, but will pass close enough to Mauritius for the island to feel the tropical cyclone’s effects.

The storm will peak at 120 knots (138 mph/222 kph) upon closest approach to Rodrigues on Saturday, Feb. 9.

Rob Gutro
NASA’s Goddard Space Flight Center

Funani (Southern Indian Ocean)

Feb. 7, 2019 – NASA Finds a Pinhole Eye in Tropical Cyclone Funani

Visible-light imagery from NASA’s Aqua satellite revealed the development of a small eye in Tropical Cyclone Funani as the storm rapidly intensified into a major hurricane in the Southern Indian Ocean.

On Feb. 7, 2019, the Moderate Resolution Imaging Spectroradiometer, or MODIS, instrument aboard NASA’s Aqua satellite captured a visible image of Tropical Cyclone Funani. The visible image revealed a pinhole eye surrounded by a thick ring of powerful thunderstorms.

satellite image of Funani
On Feb. 7, 2019, the MODIS instrument aboard NASA’s Aqua satellite provided a visible image of Tropical Cyclone Funani in the Southern Indian Ocean. The image revealed a pinhole eye surrounded by a thick ring of powerful thunderstorms. Credit: NASA Worldview, Earth Observing System Data and Information System (EOSDIS)

At 10 a.m. EDT (1500 UTC) on Feb. 7, Funani was located near 19.9 degrees south latitude and 66.7 east longitude, approximately 530 nautical miles east of Port Louis, Mauritius. Funani was moving to south-southeast. Maximum sustained winds were near 115 knots (132 mph/213 kph). Funani is now a Category 4 hurricane on the Saffir-Simpson Hurricane Wind Scale.

Forecasters at the Joint Typhoon Warning Center expect Funani to strengthen slightly more and then begin a weakening trend on its trek to the south-southeast.

Rob Gutro
NASA’s Goddard Space Flight Center

Funani (Southern Indian Ocean)

Feb. 6, 2019 – NASA Looks at Tropical Storm Funani’s Rainfall

Tropical Storm Funani (formerly classified as 12S) continued to affect Rodrigues Island in the South Pacific Ocean when the GPM satellite passed overhead and analyzed its rainfall.

On Feb. 6, a tropical cyclone warning class 2 is in force at Rodrigues, with cyclonic conditions starting to occur from late evening (local time).

The Global Precipitation Measurement mission, or GPM, Core Satellite passed over Tropical Storm Funani at 7:51 a.m. EDT (1251 UTC). GPM found the heaviest rainfall was southwest of the center of circulation. There, rain was falling at a rate of 1.2 inches per hour. Other areas of heavy rainfall were occurring in fragmented bands of thunderstorms east of the center. GPM is a joint mission between NASA and the Japan Aerospace Exploration Agency, JAXA.

Satellite image of Funani
The GPM Core Observatory passed over Tropical Storm Funani at 7:51 a.m. EDT (1251 UTC). GPM found the heaviest rainfall was southwest of the center of circulation. There, rain was falling at a rate of 1.2 inches per hour. Credit: NASA/JAXA/NRL

At 11 a.m. EDT (1500 UTC), the center of Tropical Cyclone Funani was located near latitude 17.5 degrees south and longitude 64.4 degrees east. That’s about 432 nautical miles east-northeast of Port Louis, Mauritius. Maximum sustained winds were near 65 knots (75 mph/120 kph), making it a Category 1 hurricane on the Saffir-Simpson Hurricane Wind Scale.

The Joint Typhoon Warning Center noted Funani is rapidly strengthening as it moves southeast. The storm will intensify to 105 knots (121 mph/192 kph) within two days, before starting to weaken.

Rob Gutro
NASA’s Goddard Space Flight Center, Greenbelt, Md.

Gelena (Southern Indian Ocean)

Feb. 6, 2019 – NASA Catches Development of Tropical Cyclone Gelena

Visible-light imagery from NASA’s Aqua satellite revealed the development of Tropical Depression 13S into a tropical storm. Tropical Storm Gelena intensified rapidly and appeared to have a cloud-filled eye.

At 5:20 a.m. EDT (1020 UTC) on Feb. 6 the Moderate Resolution Imaging Spectroradiometer, or MODIS, instrument aboard NASA’s Aqua satellite provided a visible image of Tropical Storm Gelena in the Southern Indian Ocean. The image showed the storm developing an eye, with bands of thunderstorms wrapping into the low-level center.

image of Gelena
At 5:20 a.m. EDT (1020 UTC) on Feb. 6, 2019, the MODIS instrument aboard NASA’s Aqua satellite provided a visible image of Tropical Storm Gelena in the Southern Indian Ocean. The image showed the storm developing an eye, with bands of thunderstorms wrapping into the low-level center. Credit: NASA/NRL

At 10 a.m. EDT (1500 UTC) on Feb. 6, the Joint Typhoon Warning Center or JTWC noted that Trami had maximum sustained winds near 45 knots (52 mph/83 kph). It was centered near 12.3 degrees south latitude and 53.4 degrees east longitude. That’s 504 nautical miles north-northwest of St. Denis, La Reunion Island.

JTWC has forecast Gelena to strengthen rapidly and will eventually turn to the southeast. It is expected to reach hurricane-strength upon approach to Rodrigues, on Feb. 9.

Rob Gutro
NASA’s Goddard Space Flight Center, Greenbelt, Md.

12S (Southern Indian Ocean)

Feb. 5, 2019 – NASA-NOAA’s Suomi NPP Satellite Catches Development of Tropical Cyclone 12S

Tropical Cyclone 12S has developed east of the African island nation of Madagascar. NASA-NOAA’s Suomi NPP satellite passed over the Southern Indian Ocean and captured a visible image of the newly formed storm that has triggered a warning for Rodrigues, an outer island of the Republic of Mauritius.

Tropical Cyclone 12S
On Feb. 5, 2019, the VIIRS instrument aboard NASA-NOAA’s Suomi NPP satellite captured a visible image of Tropical Cyclone 12S, located northeast of Madagascar, in the Southern Indian Ocean. Credit: NASA Worldview, Earth Observing System Data and Information System (EOSDIS) https://go.nasa.gov/2HRTDhi

On Feb. 5, 2019, the Visible Infrared Imaging Radiometer Suite (VIIRS) instrument aboard NASA-NOAA’s Suomi NPP satellite captured visible image of Tropical Cyclone 12S. VIIRS imagery showed powerful thunderstorms wrapping into the low-level center from a large, thick band of thunderstorms spiraling in from the southern quadrant of the storm. Outer clouds from the western quadrant were just brushing the northeastern coast of Madagascar.

At 10 a.m. EDT (1500 UTC) on Feb. 5 the center of Tropical Storm 12S was located near latitude 15.8 degrees south and longitude 64.3 degrees east. That’s about 492 nautical miles (566 miles/912 km) east-northeast of Port Louis, Mauritius. Maximum sustained winds are near 35 knots (40 mph/65 kph) with higher gusts. The Joint Typhoon Warning Center expects continuous strengthening and 12S is expected to reach hurricane-force by Feb. 7. It is expected to reach peak intensity near 105 knots (121 mph/194 kph) in three days.

A tropical cyclone warning class 1 is in force at Rodrigues. For local forecasts from the Mauritius Meteorological Service, visit: http://metservice.intnet.mu/.

12S is moving southwestward and is forecast to turn to the southeast and move away from Mauritius and La Reunion Islands.

By Rob Gutro
NASA’s Goddard Space Flight Center

Riley (Southern Indian Ocean)

Jan. 29, 2019 – NASA’s Aqua Satellite Shows Winds Shear Affecting Tropical Cyclone Riley

Visible from NASA’s Aqua satellite revealed the effects of wind shear on Tropical Cyclone Riley in the Southern Indian Ocean.

Aqua image of Riley
On Jan. 29, 2019, the MODIS instrument aboard NASA’s Aqua satellite looked at Tropical Cyclone Riley far to the west of Western Australia. Wind shear pushed the bulk of clouds and storms west of the center. Credit: NASA/NRL

On Jan. 29, 2019, the Moderate Resolution Imaging Spectroradiometer or MODIS instrument aboard NASA’s Aqua satellite captured a visible image of Tropical Cyclone Riley, located far to the west of Western Australia. Easterly wind shear pushed the bulk of clouds and storms west of the center.

At 4 a.m. EDT (0900 UTC) on Jan. 29, Riley was located near 19.4 degrees south latitude and 105.8 east longitude, approximately 475 nautical miles west-northwest of Learmonth, Australia. Rile was moving to the west-southwestward. Maximum sustained winds were near 35 knots (40 mph/65 kph).

Forecasters at the Joint Typhoon Warning Center expect Riley to maintain its west-southwestward track until it dissipates later in the day.

By Rob Gutro
NASA’s Goddard Space Flight Center

Riley (Southern Indian Ocean)

Jan. 28, 2019 – Satellite Sees Tropical Cyclone Riley Pushing Further from Australia

Tropical Cyclone Riley continued to move west in the Southern Indian Ocean, and move away from Western Australia. NASA-NOAA’s Suomi NPP satellite provided a visible image of the storm.

Suomi NPP Image of Riley
NASA-NOAA’s Suomi NPP satellite passed over the Southern Indian Ocean and captured a visible image of Tropical Cyclone Riley on Jan. 28, 2019. Credit: NASA Worldview, Earth Observing System Data and Information System (EOSDIS).

Suomi NPP passed over Riley on Jan. 28 and the Visible Infrared Imaging Radiometer Suite (VIIRS) instrument provided a visible image of the storm. The VIIRS image showed a rounded area of storms in the northwestern quadrant of the storm. The Joint Typhoon Warning Center (JTWC) noted “A microwave image indicated the bulk of the deep convection is confined to the northwest quadrant with tightly-curved shallow banding wrapping into a defined low-level circulation center.”

On January 28, the Australian Bureau of Meteorology noted that “Tropical Cyclone Riley lies over open waters well to the northwest of the west Pilbara coast. Riley is forecast to move towards the west southwest over the coming days, continuing on its path away from the Western Australia mainland.” At 10 a.m. EDT (1500 UTC), Riley was near 18.4 degrees south longitude and 108.9 east latitude, about 375 nautical miles northwest of Learmonth, Western Australia. Maximum sustained winds were near 60 knots

Forecasters at the Joint Typhoon Warning Center noted that Riley will track west-southwest and will continue to weaken. Riley is expected to dissipate within 3 days.

By Rob Gutro 
NASA’s Goddard Space Flight Center