33W (Northwestern Pacific Ocean)

November 21, 2018 – NASA Sees Tropical Depression 33W Enter the Sulu Sea

Tropical Depression 33W moved through the central Philippines and entered the Sulu Sea when NASA-NOAA’s Suomi NPP satellite provided a visible image of the storm.

Suomi NPP image of 33W
NASA-NOAA’s Suomi NPP satellite passed over the Northwestern Pacific Ocean and captured a visible image of Tropical Depression 33W in the Sulu Sea on Nov. 21, 2018. Credit: NASA Worldview, Earth Observing System Data and Information System (EOSDIS)

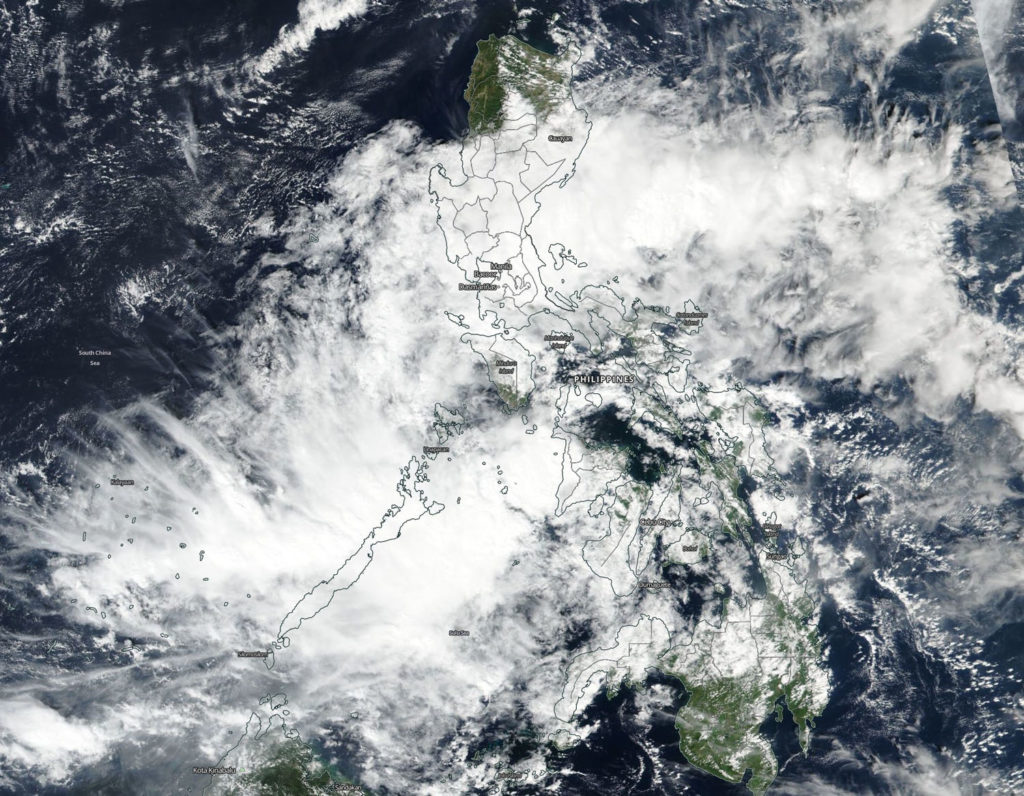
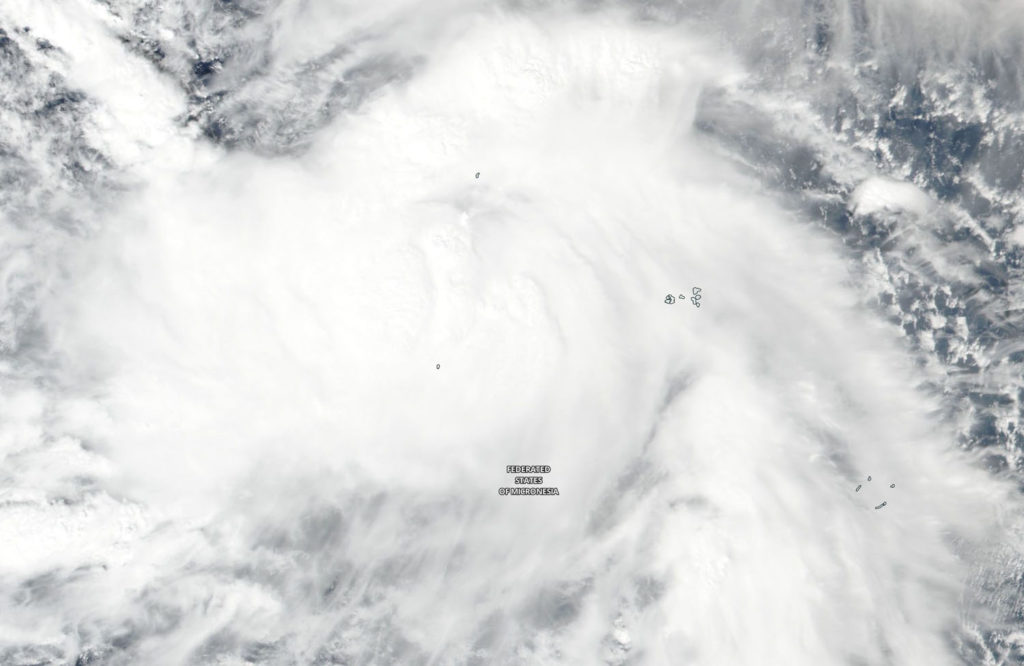
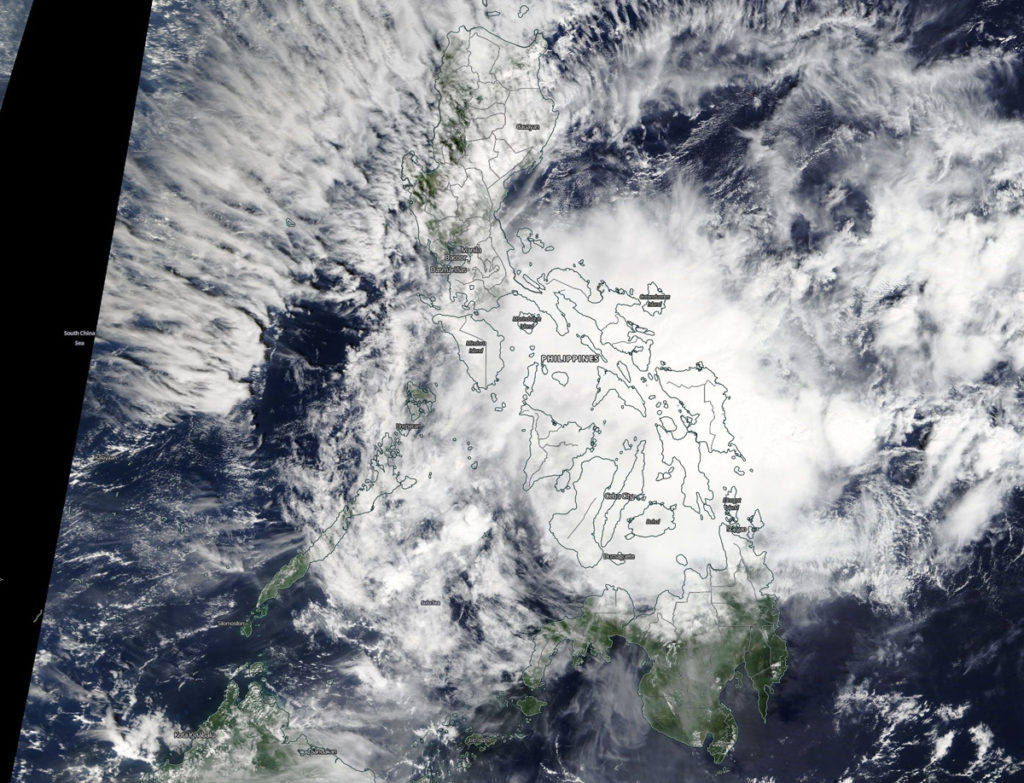
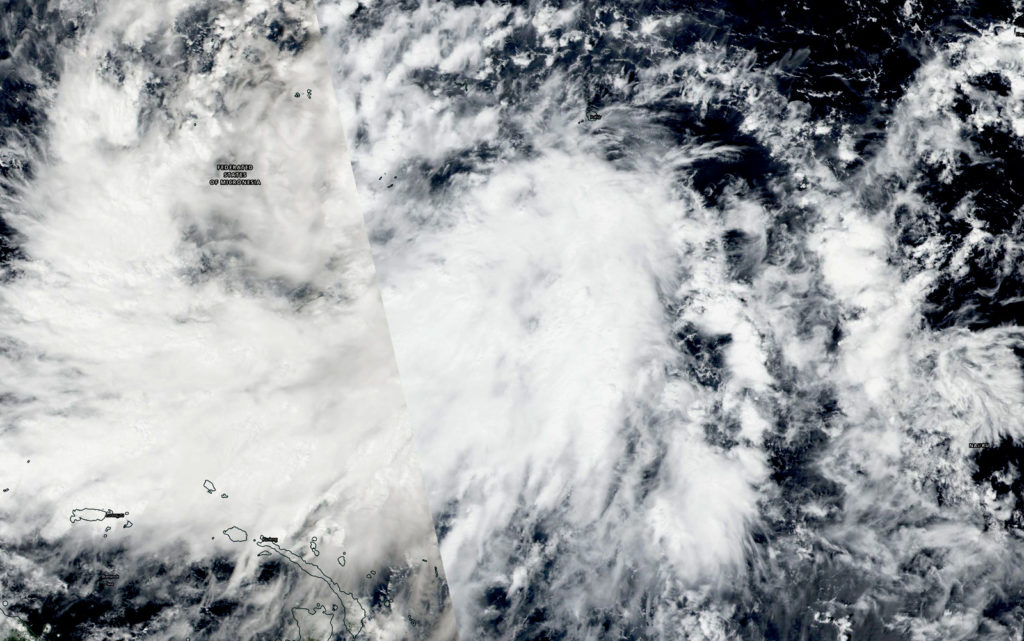
The Sulu Sea is located west of the central and southern Philippines. The VIIRS instrument aboard the Suomi NPP satellite revealed that 33W’s center was in the Sulu Sea on Nov. 21 as the elongated storm extended over the island of Palawan. The storm appeared stretched out from southwest to northeast, and clouds associated with the depression stretched back into the central and northern Philippines.

At 10 a.m. EST (1500 UTC) the center of Tropical Depression 33W was located near latitude 10.7 degrees north and longitude 119.8 degrees east. That’s 237 nautical miles south of Manila, Philippines. 33W is moving west-southwest. Maximum sustained winds remain at 25 knots (29 mph/46 kph).
Warm sea surface temperatures are helping keep the storm together as it battles moderate vertical wind shear of winds 20 to 25 knots (23 to 29 mph/37 to 46 kph). 33W was moving west toward the South China Sea where the wind shear is expected to ease. 33W is then forecast to strengthen as it crosses the sea and heads toward Vietnam.

By Rob Gutro 
NASA’s Goddard Space Flight Center

Man-yi (Northwestern Pacific Ocean)

November 21, 2018 – NASA Sees Tropical Storm Man-yi Approaching Typhoon Strength

Tropical Storm Man-Yi continued to strengthen in the Northwestern Pacific Ocean as NASA-NOAA’s Suomi NPP satellite provided a visible image of the storm. Warnings are in effect through the Federated States of Micronesia at the storm continues to affect the region.

Suomi NPP image of Man-yi
NASA-NOAA’s Suomi NPP satellite passed over the Northwestern Pacific Ocean and captured a visible image of Tropical Storm Man-Yi on Nov. 21, 2018. Credit: NASA Worldview, Earth Observing System Data and Information System (EOSDIS)

The National Weather Service (NWS) in Tiyan, Guam noted several watches and warnings in effect. A Tropical Storm Watch remains in effect for Fais and Ulithi in Yap State. A Typhoon Watch remains in effect for Faraulep in Yap State. A Tropical Storm Warning remains in effect for Satawal and Faraulep in Yap State…and for Guam and Rota in the Mariana Islands.

The Suomi NPP satellite passed over Man-yi on Nov. 21 and the VIIRS instrument provided a visible image. The VIIRS image showed Man-yi was a large and strong tropical storm over the Federated States of Micronesia. Tropical storm force winds extend outward from the center up to 115 miles making the storm about 230 miles in diameter.

At 7 a.m. EST (10 p.m. CHST local time/1200 UTC) the center of Tropical Storm Man-yi was located near latitude 8.9 degrees north and longitude 146.5 degrees east. Man-yi is moving west-northwest at 23 mph. It is expected to maintain this general course and speed over the next 24 hours. Maximum sustained winds remain at 65 mph.

NWS said “Man-yi will track east of Faraulep tonight…then pass about 200 miles southwest of Guam Thursday afternoon…and about 150 miles northeast of Ulithi and Fais Thursday evening, Nov. 22.”

Man-yi is forecast to intensify through Thursday possibly becoming a typhoon as it moves in a northwesterly direction. Maximum sustained winds are forecast to peak near 110 mph on Friday, Nov. 23.

For updated forecasts, visit: http://www.prh.noaa.gov/guam/cyclone.php

By Rob Gutro 
NASA’s Goddard Space Flight Center

Toraji (Gulf of Thailand)

November 20, 2018 – NASA Tracks Tropical Depression Toraji in the Gulf of Thailand

Visible from NASA’s Terra satellite revealed the extent of Tropical Depression Toraji as it continued moving through the Gulf of Thailand and affecting southern Thailand and Malaysia.

Terra image of Toraji
On Nov. 20, the MODIS instrument aboard NASA’s Terra satellite looked at Tropical Depression Toraji moving through the Gulf of Thailand. Credit: NASA Worldview, Earth Observing System Data and Information System (EOSDIS)

On Nov. 20 a visible image from the Moderate Resolution Imaging Spectroradiometer or MODIS instrument aboard NASA’s Terra satellite showed that Tropical Depression Toraji appeared somewhat disorganized. Toraji’s elongated northern quadrant stretched into the northern Gulf of Thailand, while the western side of the storm stretched over land from Surat Thani south to northern Malaysia.

Toraji formed on Nov. 19, fizzled and  regenerated in the Gulf of Thailand on Nov. 20 after a brief existence.

At 10 a.m. EST (1500 UTC) Tropical depression Toraji, known previously as Tropical Depression 32W was located near 8.3 degrees north latitude and 102.0 east longitude, about 340 west-southwest of Ho Chi Minh City, Vietnam. Toraji was moving to the west-southwest and had maximum sustained winds near 25 knots (28.7 mph).

Toraji will cross the Malay Peninsula and is expected to dissipate in the Malakka Strait

By Rob Gutro
NASA’s Goddard Space Flight Center

Bouchra (Southern Indian Ocean)

November 20, 2018 – NASA Sees Tropical Cyclone Bouchra Being Blown Apart

Tropical Cyclone Bouchra may have been re-born over the weekend of Nov. 17 and 18 but by Nov. 20 it was blown apart by wind shear and NASA’s Aqua satellite confirmed that.

Aqua image of Bouchra
On Nov. 20 the MODIS instrument aboard NASA’s Aqua satellite saw Tropical Storm Bouchra being torn apart by winds. The center appeared almost cloud free while the bulk of clouds were pushed to the southeast. Credit: NASA Worldview, Earth Observing System Data and Information System (EOSDIS)

In general, wind shear is a measure of how the speed and direction of winds change with altitude. Wind shear can tear a tropical cyclone apart or weaken it.

On Nov. 20 the MODIS or Moderate Resolution Imaging Spectroradiometer instrument aboard NASA’s Aqua satellite saw Tropical Storm Bouchra being torn apart by winds. The center appeared almost cloud free while the bulk of clouds were pushed to the southeast. That’s an indication that winds or wind shear was affecting the storm and elongating its circulation center, weakening the storm again.

By 4 a.m. EST (0900 UTC) on Nov. 20, Bouchra was already weakening and the Joint Typhoon Warning Center issued their final bulletin on the system. At that time, maximum sustained winds were near 35 knots (40 mph/62 kph). It was located near 5.4 degrees south latitude and 78.0 degrees east longitude, about 604 nautical miles southeast of Diego Garcia. Wind shear had increased since Nov. 19 and was pushing the bulk of clouds to the southeast and about 150 nautical miles away from the center.

Bouchra is expected to make its final dissipation by the end of the day on Nov. 20.

By Rob Gutro
NASA’s Goddard Space Flight Center

33W (Northwestern Pacific Ocean)

November 20, 2018 – NASA Sees Tropical Depression 33W Affecting Philippines

Visible imagery from NASA’s Terra satellite revealed the extent of Tropical Depression 33W showed the tropical low pressure system moving into the central part of the Philippines on Nov. 20.

Terra image of 33W
On Nov. 20 a visible image from the Moderate Resolution Imaging Spectroradiometer or MODIS instrument aboard NASA’s Terra satellite showed Tropical Depression 33W, a large disorganized storm moving over the south-central Philippines. Credit: NASA Worldview, Earth Observing System Data and Information System (EOSDIS)

Tropical Depression 33W (33W), known locally in the Philippines as Tropical Cyclone Samuel has triggered many warnings and watches.

Storm Signal 1 was in effect in three regions of the Philippines.In Luzon, Signal 1 was in effect for Masbate, Ticao Island, Romblon, southern Oriental and southern Occidental Mindoro, northern Palawan including Cuyo Island and the Calamian group of islands. In Visayas, Signal 1 was in effect for Northern Samar, Samar, Eastern Samar, Biliran, Leyte, Southern Leyte, Bohol, Cebu, Siquijor, Negros Oriental and Occidental, Guimaras, Iloilo, Capiz, Aklana and Antique. In Mindanao, Signal 1 was in effect for Surigao del Norte and Sur, Agusan del Norte and Sur, Dinagat Islands, Misamis Oriental and Camiguin

On Nov. 20 a visible image from the Moderate Resolution Imaging Spectroradiometer or MODIS instrument aboard NASA’s Terra satellite showed a large disorganized storm moving through the central Philippines.

AT 10 a.m. EST (1500 UTC) On Nov. 20, Tropical depression 33W, (Philippines designation Samuel) was located near 10.9 degrees north latitude and 126.3 degrees east longitude, about 381 miles southeast of Manila, Philippines.  33W was moving to the west-northwest and had maximum sustained winds near 25 knots (28.7 mph)

33W will move generally west and cross the south-central Philippines. It is then forecast to move into the South China Sea and strengthen. The system will make a final landfall in central Vietnam and dissipate there.

By Rob Gutro
NASA’s Goddard Space Flight Center

Man-yi (Northwestern Pacific Ocean )

November 20, 2018 – NASA Sees Tropical Depression Man-yi, Warnings Triggered

Tropical depression Man-yi for med in the Northwestern Pacific Ocean and NASA captured an image of the storm. Yap state is already under watches and warnings.

Suomi NPP image of 34W
NASA-NOAA’s Suomi NPP satellite provided a visible image of newly formed Tropical Depression Man-yi affecting the Federated States of Micronesia (top left). Warnings are already in effect for Yap State. Credit: NASA Worldview, Earth Observing System Data and Information System (EOSDIS)

The National Weather Service (NWS) in Tiyan, Guam has issued a typhoon watch and Tropical Storm warning on Nov. 20. A Typhoon Watch remains in effect for Faraulep in Yap State and for Puluwat in Chuuk State. A Tropical Storm Warning is in effect for Chuuk Lagoon, Lukunor, Losap, Fananu, Ulul, and Puluwat in Chuuk State and for Satawal in Yap State. A Tropical Storm Watch remains in effect for Guam and Rota.

Tropical Depression Man-yi formed on Nov. 20 and NASA-NOAA’s Suomi NPP satellite passed overhead. The Visible Infrared Imaging Radiometer Suite (VIIRS) instrument aboard NASA-NOAA’s Suomi NPP satellite provided a visible image of the storm. Man-yi is a large area of low pressure. The image showed powerful thunderstorms around the center of circulation and a large, thick band of thunderstorms feeding into the center from the west were bringing gusty winds and rainfall to the Federated States of Micronesia.

On Nov. 20 at 7 a.m. EST (1200 UTC/10 p.m. CHST local time), the center of Tropical Depression Man-yi was located near Latitude 4.8 degrees north and longitude 154.2 degrees east. Man-yi is moving west at 10 mph. It is expected to make a slight turn toward the west-northwest with an increase in forward speed through Thursday. NWS in Guam said that maximum sustained winds remain at 30 mph. Man-yi is forecast to intensify through Friday possibly becoming a tropical storm Wednesday.

For updated forecasts, visit: http://www.prh.noaa.gov/guam/cyclone.php

By Rob Gutro
NASA’s Goddard Space Flight Center

Bouchra (Southern Indian Ocean)

November 19, 2018 – Satellite Finds Tropical Cyclone Bouchra Reborn in Southern Indian Ocean

Tropical Cyclone 04S, known as Bouchra formed in the Southern Indian Ocean during the week of Nov. 12 and by the end of the week it had become a remnant low pressure area. Over the weekend of Nov. 17 and 18 it regenerated into a tropical cyclone and the NOAA-20 satellite passed overhead and captured a visible image of the storm.

NOAA-20 image of Bouchra
At 3:24 a.m. EDT (0824 UTC) on Nov. 19, the VIIRS instrument aboard NOAA’s NOAA-20 satellite captured a visible image of Tropical Cyclone Bouchra in the Southern Indian Ocean. Credit: NASA/NRL

At 3:24 a.m. EDT (0824 UTC) on Nov. 19the Visible Infrared Imaging Radiometer Suite (VIIRS) instrument aboard the NOAA-20 polar orbiting satellite saw the elongated storm. The VIIRS image revealed that the storm appeared to stretch from northwest to southeast. That’s an indication that winds or wind shear was affecting the storm and elongating its circulation center, weakening the storm (again).

In general, wind shear is a measure of how the speed and direction of winds change with altitude. Wind shear can tear a tropical cyclone apart or weaken it.

On Nov. 19 at 10 a.m. EST (1500 UTC) Bouchra’s maximum sustained winds were near 50 knots (57 mph/92 mph) making it a tropical storm. It was located approximately 672 nautical miles southeast of Diego Garcia near 15.2 south latitude and 80.4 east longitude. Bouchra was moving southwestward and is expected to maintain intensity over the next several days before weakening.

Bouchra is expected to dissipate by Nov. 22.

NOAA-20 is the first in the JPSS series of satellites. JPSS is a collaborative program between the National Oceanic and Atmospheric Administration (NOAA) and its acquisition agent, the National Aeronautics and Space Administration (NASA). NOAA is responsible for managing and operating the JPSS program, and developing portions of the ground segment, while NASA is responsible for developing and building the JPSS instruments, spacecraft, and portions of the ground segment and providing launch services.

For more information about the JPSS series of satellites, visit: https://www.jpss.noaa.gov/ 

By Rob Gutro
NASA’s Goddard Space Flight Center

33W (Northwestern Pacific Ocean)

November 19, 2018 – GPM Satellite Sees Light Rain Occurring in Tropical Depression 33W’s Eastern Side

The Global Precipitation Measurement mission or GPM core satellite is providing data on rain rates within Tropical Cyclone 33W as it moves over the Philippines on Nov. 19.

GPM image of 33W
The GPM core observatory satellite measured that rainfall rates in the eastern half of Tropical Depression 33W on Nov. 19 at 3:06 a.m. EST (0806 UTC) and found that the heaviest rainfall was occurring around the center at a rate of 1.2 inches per hour (red) while light rain was occurring throughout much of the eastern half of the storm. The bulk of the storm appears to be in the western quadrant. Credit: NASA/JAXA/NRL

Tropical Depression 33W is about to traverse the south-central Philippines. In the Philippines, 33W is designated “Samuel.”

The GPM satellite passed over the eastern half of Tropical Depression 33W on Nov. 19 at 3:06 a.m. EST (0806 UTC) and measured the rainfall rates. The heaviest rainfall was occurring around the center at a rate of 1.2 inches per hour while light rain was occurring throughout much of the eastern half of the storm. The bulk of the clouds and showers associated with 33W are located in the storm’s western quadrant.

GPM is a joint satellite mission between NASA and the Japan Aerospace Exploration Agency called JAXA.

At 10 a.m. EST (1500 UTC), the center of 33W was located near latitude 9.1 degrees north and longitude 129.7 degrees east. 33W is moving toward the west-northwest and has maximum sustained winds near 30 knots (34.5 mph/55.5 kph)

Philippines storm signal 1 has been placed in effect for Luzon that includes Masbate, and for the Visayas region that includes Samar, Eastern Samar, Biliran, Leyte, Southern Leyte, Bohol, Cebu, Siquijor, Negros Oriental and Occidental. In the Mindanao region, Signal 1 is in effect for Surigao del Norte and Sur, Agusan del Norte and Sur, Dinagat Islands, Misamis Oriental and Camiguin

33W will move west-northwest, later west and into the South China Sea.

By Rob Gutro
NASA’s Goddard Space Flight Center

Gaja (Southern Indian Ocean)

November 16, 2018 – NASA Catches Tropical Cyclone Gaja’s Landfall

Caught in the act of landfall, Tropical Cyclone Gaja was seen by NASA’s Aqua satellite as it passed overhead and collected temperature information.

AIRS image of Gaja
NASA’s Aqua satellite provided an infrared picture of Tropical Cyclone Gaja’s cloud top temperatures from Nov. 15 at 3:29 p.m. EDT (2029 UTC). Gaja’s center was making landfall along the coast of southeastern India. Coldest clouds tops and strongest storms appear in purple. Credit: NASA JPL, Heidar Thrastarson

The Atmospheric Infrared Sounder or AIRS instrument aboard NASA’s Aqua satellite passed over Tropical Cyclone Gaja on Nov. 15 at 3:29 p.m. EDT (2029 UTC) and analyzed the storm in infrared light. Infrared light provides temperature data and that’s important when trying to understand how strong storms can be. The higher the cloud tops, the colder and the stronger they are.

When Aqua passed over the Indian Ocean, Gaja’s center was making landfall along the coast of southeastern India. The AIRS instrument found coldest cloud top temperatures in thunderstorms around the center, where temperatures were as cold as minus 63 degrees Fahrenheit (minus 53 degrees Celsius). Storms with cloud top temperatures that cold have the capability to produce heavy rainfall.

At 10 a.m. EST (1500 UTC), the center of Tropical Cyclone Gaja was located near latitude 9.7 degrees north and longitude 75.9 degrees west. Gaja was moving toward west-southwest. Maximum sustained winds are near 46 mph (40 knots/74 kph) with higher gusts.

Gaja was exiting the southwestern coast of India on Nov. 16 at 7 a.m. EST (1200 UTC) and was moving into the Arabian Sea where it is expected to maintain strength and travel in a westerly direction over the next several days.

By Rob Gutro
NASA’s Goddard Space Flight Center

Gaja (Southern Indian Ocean)

Nov. 15, 2018 – NASA Finds a Cloud-Filled Eye in Tropical Cyclone Gaja

Tropical Cyclone Gaja continued to organize in the Bay of Bengal as it made its approach to southeastern India when NASA-NOAA’s Suomi NPP satellite passed overhead and captured an image. The image revealed that Gaja had developed a cloud-filled eye.

Suomi NPP image of Gaja
On Nov. 15, the VIIRS instrument aboard NASA-NOAA’s Suomi NPP satellite captured a visible image of Tropical Storm Gaja in the Bay of Bengal approaching southern India (left). Credit: NASA Worldview, Earth Observing System Data and Information System (EOSDIS)

The Bay of Bengal is in the Northern Indian Ocean basin, east of India.

On Nov. 15, the Visible Infrared Imaging Radiometer Suite (VIIRS) instrument aboard NASA-NOAA’s Suomi NPP satellite took a visible light image of Tropical Storm Gaja. It revealed what appeared to be a cloud-filled eye. The Joint Typhoon Warning Center confirmed that “animated multispectral satellite imagery shows a more compact system with a dimple feature on the central convection – indicative of a formative eye.”

On Nov. 15 at 10 a.m. EDT (1500 UTC) Gaja’s maximum sustained winds were near 55 knots (63 mph/102 kph), but weakening is expected as it nears the coast of southeastern India. Gaja was located near 10.8 degrees north latitude 80.7 east longitude. It was about 145 nautical miles south-southeast of Chennai, India.

The Joint Typhoon Warning Center or JWTC noted that Gaja will move west-southwest and is approaching landfall near Cuddalore before Nov. 16 at 4 a.m. EDT (0900 UTC). After crossing southern India, the storm will re-strengthen in the Arabian Sea, before dissipating after 5 days.

By Rob Gutro
NASA’s Goddard Space Flight Center