Nov. 14, 2018 – Tropical Cyclone Gaja Approaching Southeastern India
Tropical Cyclone Gaja continued to track toward a landfall in southeastern India when NASA-NOAA’s Suomi NPP satellite flew over the Bay of Bengal and provided a visible image of the storm.
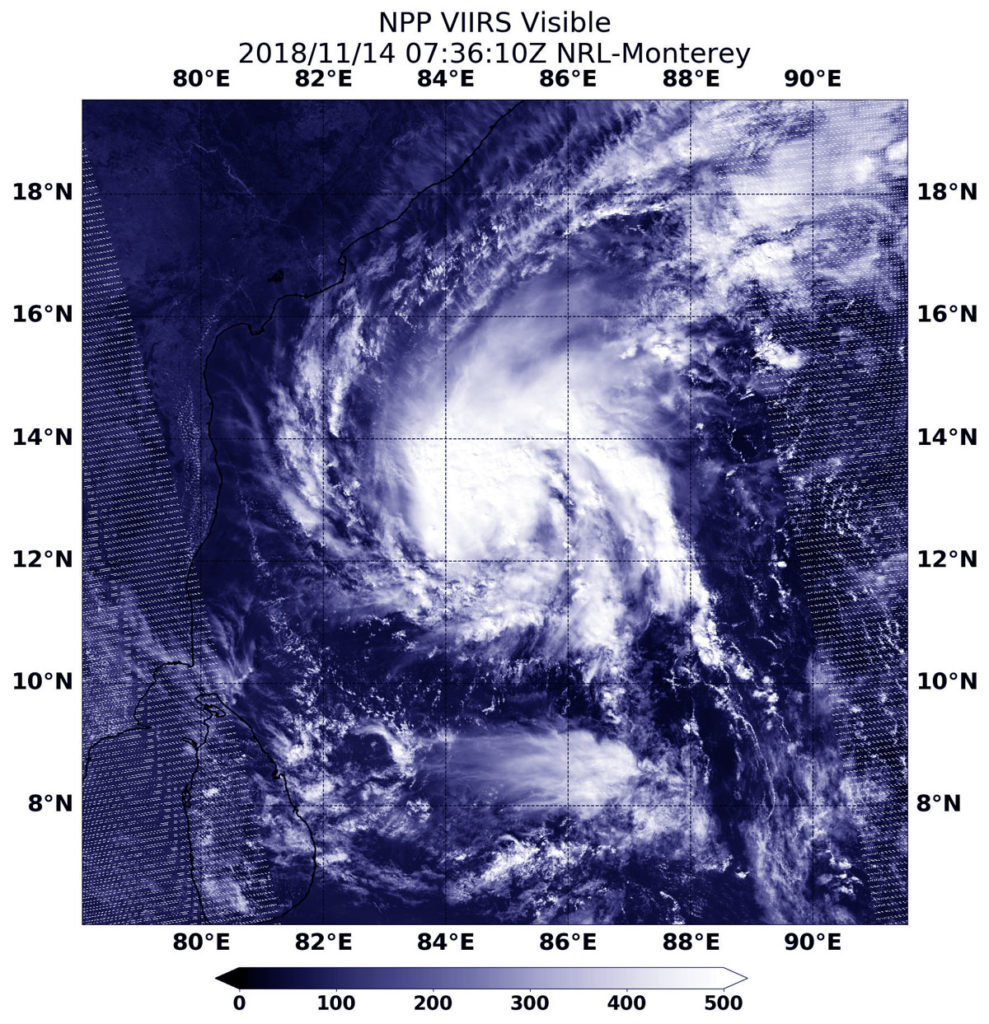
NASA-NOAA’s Suomi NPP satellite passed over the Northern Indian Ocean and captured a visible image of Tropical Cyclone Gaja approaching the southeastern coast of India at 2:36 a.m. EDT (0736 UTC) on Nov. 14, 2018. Credit: NASA/NOAA/NRL
Suomi NPP passed over Gaja on Nov. 14 at 2:36 a.m. EDT (0736 UTC) and the VIIRS instrument provided a visible image. The VIIRS image showed Gaja appeared more organized than the previous day as powerful thunderstorms circled the center. A thick band of thunderstorms wrapped into the low level center from the eastern quadrant.
At 4 a.m. EDT (0900 UTC) Tropical Cyclone Gaja was located near 12.6 degrees north latitude and 84.5 degrees east longitude. That’s about 623 nautical miles south-southwest of Calcutta, India. Gaja is moving to the west-southwest and has maximum sustained winds near 45 knots (52 mph/83 kph).
The Regional Specialized Meteorological Center for Tropical Cyclones over the Northern Indian Ocean or RSMC has issued a tropical storm warning for southern India. For updates visit: http://www.rsmcnewdelhi.imd.gov.in/index.php?lang=en
The Joint Typhoon Warning Center or JTWC forecasters expect Gaja to track over the southern Indian Peninsula, where may likely hold together and reach the Arabian Sea.
Nov. 13, 2018 – NASA-NOAA Satellite Finds a Large Tropical Cyclone Gaja
NASA-NOAA’s Suomi NPP satellite passed over the Bay of Bengal, Northern Indian Ocean and captured a visible image of Tropical Cyclone Gaja.
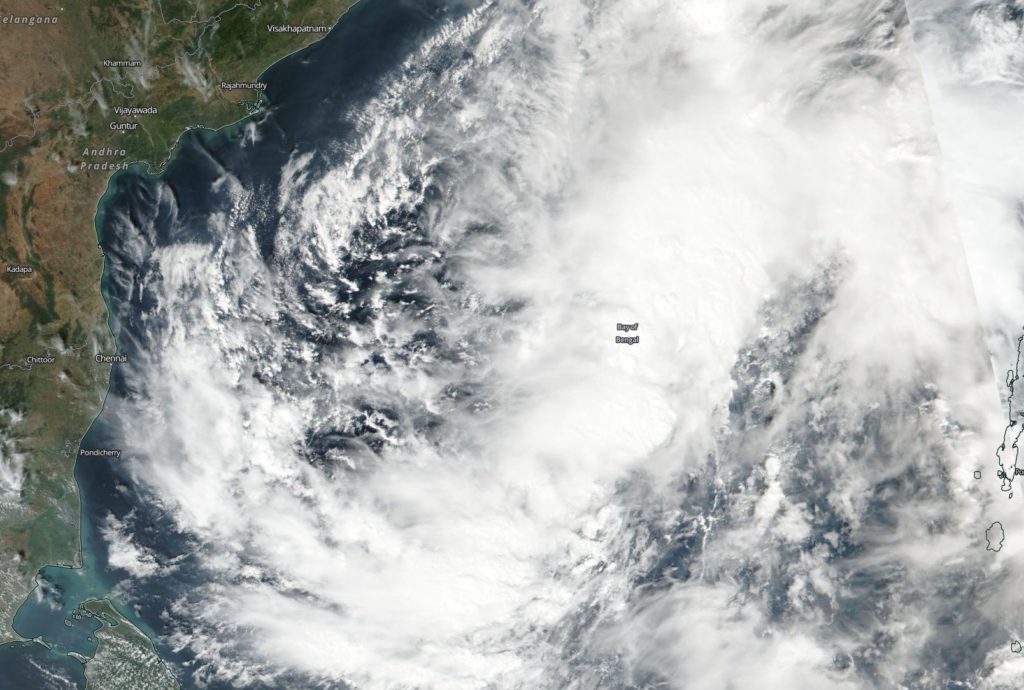
On Nov.13, the VIIRS instrument aboard NASA-NOAA’s Suomi NPP satellite captured a visible image of Tropical Cyclone Gaja in the Northern Indian Ocean. Credit: NASA Worldview, Earth Observing System Data and Information System (EOSDIS)
Gaja formed on Nov. 10 at 4 p.m. EST (2100 UTC) as tropical cyclone 07B, about 569 miles south-southwest of Chittagong, Bangladesh. It strengthened into a tropical storm and was renamed Gaja.
On Nov. 13, the Visible Infrared Imaging Radiometer Suite (VIIRS) instrument aboard NASA-NOAA’s Suomi NPP satellite gathered data on Tropical Cyclone Gaja. Gaja appeared somewhat elongated and had bands of thunderstorms wrapping into the center. Gaja appeared to extend over much of the Bay of Bengal in satellite imagery.
The Joint Typhoon Warning Center or JTWC noted “animated multispectral satellite imagery shows expansive but disorganized and fragmented rain bands loosely wrapping into an obscured low level circulation with the deep central convection sheared northeastward.”
On Nov., 13 at 10 a.m. EST (1500 UTC) Gaja’s maximum sustained winds were near 40 mph (35 knots/62 kph). It was located approximately 320 nautical miles east of Chennai, India near 13.4 degrees north latitude and 85.6 degrees east longitude. Gaja was moving west-southwest.
JTWC forecasters expect a slow intensification, peaking at 50 knots (57.5 mph/92.6 kph) by landfall in southern India just south of Chennai on Nov. 15.
Tropical Cyclone Bouchra formed on Nov. 10 in the Southern Indian Ocean and was already on its way to dissipation when NASA-NOAA’s Suomi NPP satellite passed overhead on Nov. 13.
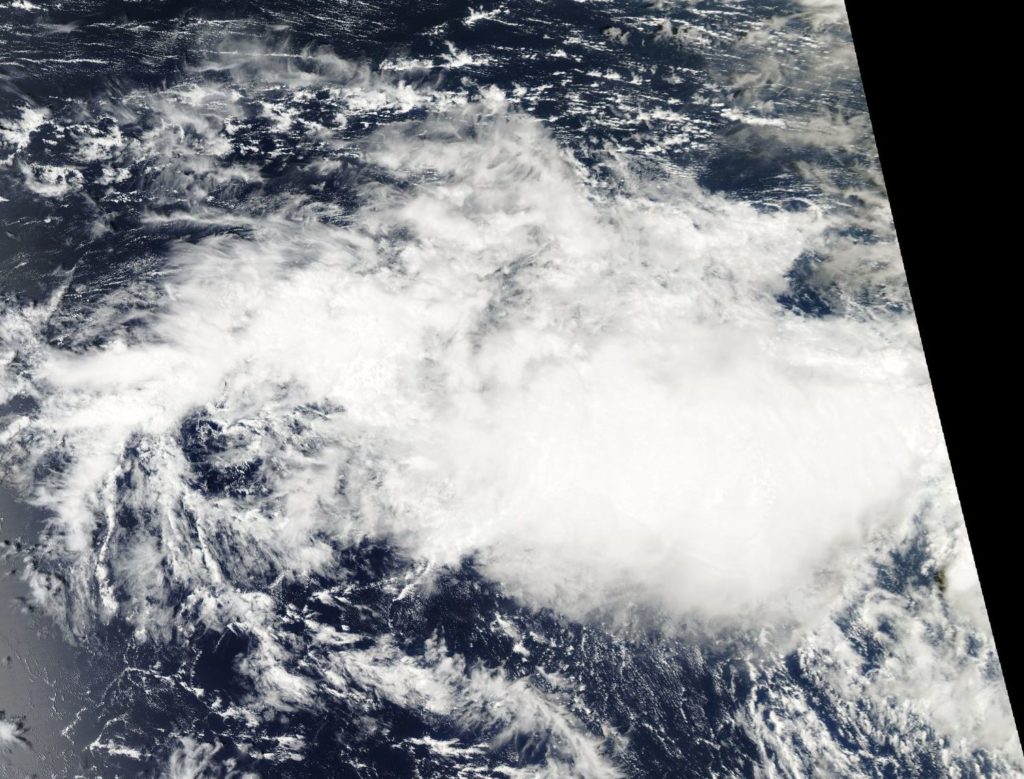
On Nov.13, the VIIRS instrument aboard NASA-NOAA’s Suomi NPP satellite captured a visible image of Tropical Cyclone Bouchra in the Southern Indian Ocean. Credit: NASA Worldview, Earth Observing System Data and Information System (EOSDIS)
Bouchra formed on Nov. 10 around 4 a.m. EDT (0900 UTC) about 220 miles northwest of Cocos Island, near 5.5 degrees south latitude and 90.7 east longitude. It was the fourth tropical cyclone of the Southern Indian Ocean cyclone season.
On Nov. 13, the Visible Infrared Imaging Radiometer Suite (VIIRS) instrument aboard NASA-NOAA’s Suomi NPP satellite analyzed Tropical Depression Bouchra showed a disorganized storm. The Joint Typhoon Warning Center noted the storm appeared to have “shallow disorganized central convection sheared eastward, partly exposing a weak and ragged low level circulation.”
Wind shear was stretching the storm out from west to east. In general, wind shear is a measure of how the speed and direction of winds change with altitude. Winds at different levels of the atmosphere pushed against the cylindrical circulation center and skewed it, weakening the rotation.
On Nov., 13 at 4 a.m. EDT (0900 UTC) Bouchra’s maximum sustained winds had dropped to 34.5 mph (30 knots/55.5 kph). It was located approximately 495 nautical miles northwest of Cocos Island near 7.2 degrees south latitude and 90.3 degrees east longitude. Bouchra was moving southeastward, and will dissipate later in the day.
Nov. 13, 2018 – NASA Analyzed Tropical Cyclone Alcide’s Rainfall Before Dissipation
Tropical Cyclone Alcide dissipated over the weekend of Nov. 11 and 12 in the Southern Indian Ocean.
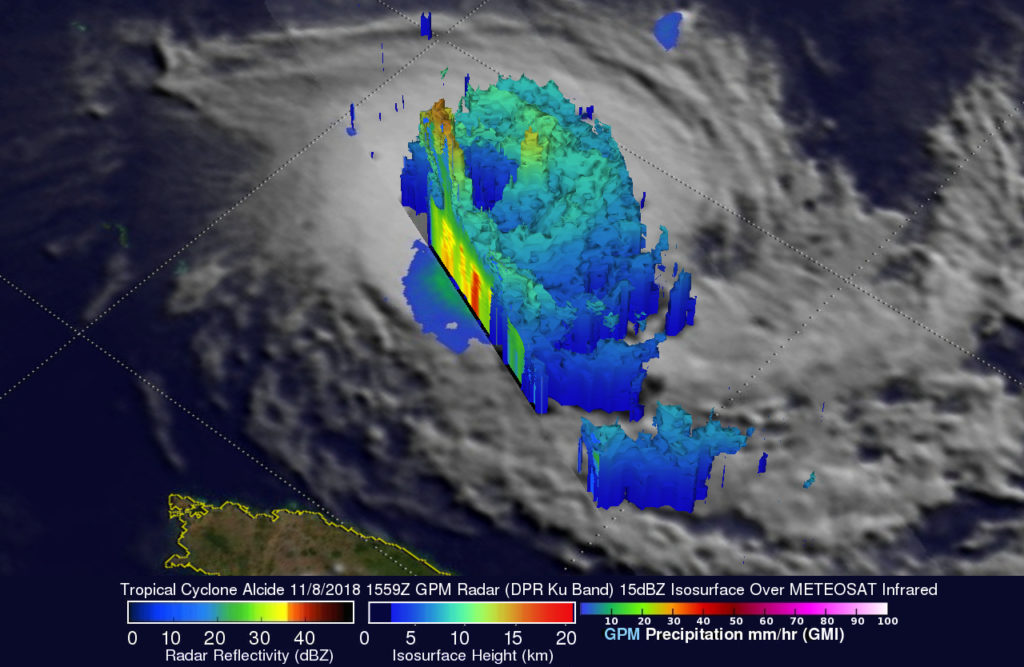
On Nov. 8, when Tropical Cyclone Alcide was at peak intensify, Data collected by the GPM core satellite revealed that the powerful tropical cyclone was producing extremely heavy rainfall. GPM’s radar (DPR Ku Band) indicated that tall convective storms in the northwestern side of Alcide’s eyewall were dropping rain at a rate of more than 255 mm (10 inches) per hour. In tropical cyclone Alcide’s western eye wall. A few of these tall storms were found by GPM to reach heights above 16.0 km (9.92 miles). Credit: NASA/JAXA, Hal Pierce
However, when it was near peak intensity, the Global Precipitation Measurement mission or GPM core satellite provided a look at the rain falling within.
The GPM core observatory satellite, a joint mission between NASA and the Japan Aerospace Exploration Agency, JAXA, had an excellent view of tropical cyclone Alcide on November 8, 2018 at 10:59 a.m. EDT (1559 UTC) after it had moved to a location northeast of Madagascar. At that time Alcide had reached its peak intensity with winds of about 95 knots (109 mph) making it the equivalent of a strong category two hurricane on the Saffir-Simpson hurricane wind scale.
Data collected by GPM’s Microwave Imager (GMI) and GPM’s Dual-Frequency Precipitation Radar (DPR) instruments revealed that the powerful tropical cyclone was producing extremely heavy rainfall. GPM’s radar (DPR Ku Band) indicated that tall convective storms in the northwestern side of Alcide’s eyewall were dropping rain at a rate of more than 255 mm (10 inches) per hour.
GPM’s radar data (DPR Ku Band) were used to create an image to probe the 3D structure of precipitation within tropical cyclone Alcide. The well-defined eye of the powerful tropical cyclone is revealed with this simulated view from the southwest. GPM’s DPR found that the most powerful convective storms were located in tropical cyclone Alcide’s western eye wall. A few of these tall storms were found by GPM to reach heights above 16.0 km (9.92 miles).
On Nov. 11, Tropical cyclone Alcide dissipated near 12.3 south latitude and 51.9 east longitude, about 529 miles north-northwest of St Denis, La Reunion.
Nov. 09, 2018 – NASA Satellite Sees Tropical Cyclone Alcide Nearing Madgascar
Tropical Cyclone Alcide continued to linger just northeast of the Island nation of Madagascar in the Southern Indian Ocean when NASA’s Aqua satellite passed overhead and captured an image of the storm.
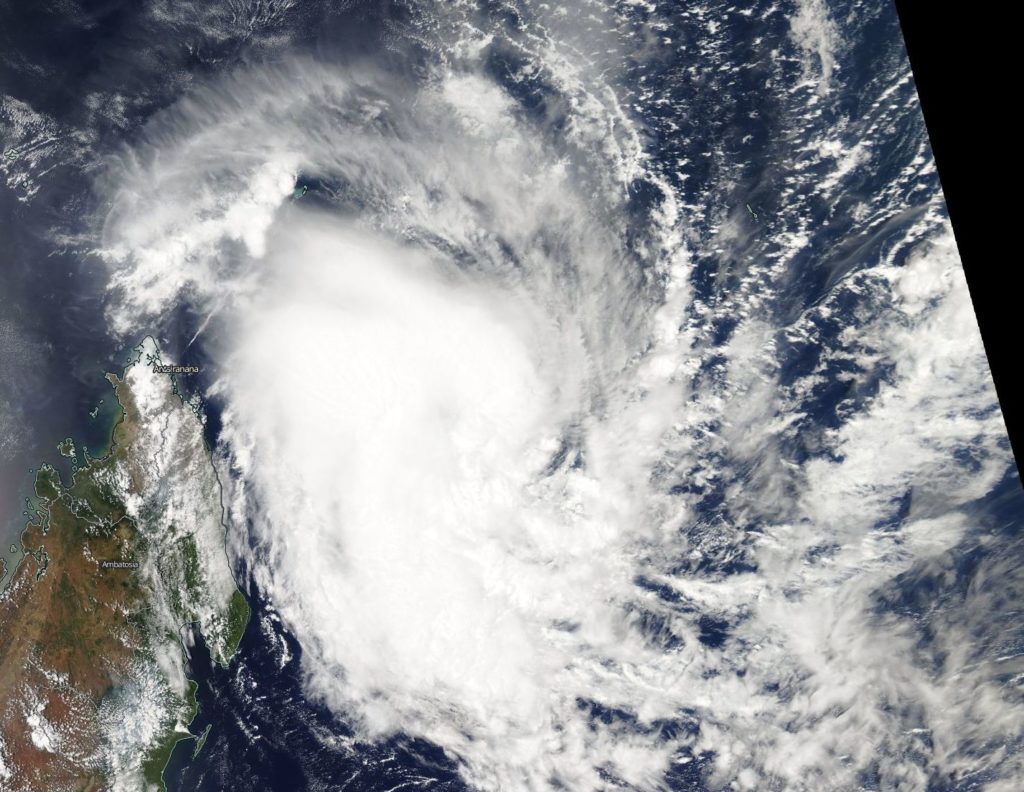
On Nov. 9 the MODIS instrument aboard NASA’s Aqua satellite captured a visible image of Tropical Cyclone Alcide in the Southern Indian Ocean, located northeast of Madagascar. Credit: NASA Worldview, Earth Observing System Data and Information System (EOSDIS)
On Nov. 9 the Moderate Resolution Imaging Spectroradiometer or MODIS instrument aboard NASA’s Aqua satellite provided a visible light image of the storm. The MODIS image showed a somewhat elongated storm from northwest to southeast with the bulk of clouds in the western quadrant of the storm.
On Nov. 9, the Joint Typhoon Warning Center or JTWC noted that animated multispectral satellite imagery showed that Alcide has lost much of its deep convection (rising air that forms the thunderstorms that make up a tropical cyclone) but maintained its spiral banding, and convection is newly flaring over the low level circulation center.
On Nov. 9 at 10 a.m. EST (1500 UTC), Alcide’s maximum sustained winds had dropped to 80 mph (70 knots/129.6 kph). It was located approximately 487 nautical miles north-northwest of Port Louis, Mauritius. Alcide is moving southward at 1.1 mph (1 knot1.8 kph) and is expected to curve to the northwest.
Because of the storm’s slow movement, it is bringing up cooler waters from below the ocean’s surface, which will in turn, weaken the storm.
The Joint Typhoon Warning Center now expects Alcide to move to the northwest and pass just north of the northern point of Madagascar over the next several days.
The Global Precipitation Measurement mission or GPM core satellite passed over the Southern Indian Ocean and analyzed the rainfall occurring in pre-season Tropical Cyclone Alcide.
On Nov. 6, the GPM core satellite showed strong convective storms northwest of Alcide’s center of circulation were dropping rain at a rate of more than 44 mm (1.73 inches) per hour. Credit: NASA/JAXA, Hal Pierce
Tropical cyclone Alcide (03S), the first tropical cyclone of the 2018-2019 South-West Indian Ocean tropical cyclone season, has formed in the South Indian Ocean northeast of Madagascar. The Joint Typhoon Warning Center (JTWC) issued its first warning for 03S on Nov. 6, 2018 at 0000 UTC (Nov. 5 at 7 p.m. EST) when the tropical cyclone was located about 1,313 km (709 nautical miles) west of Diego Garcia. This is a little early for a tropical cyclone to develop in that part of the world. The South-West Indian Ocean tropical cyclone season doesn’t officially begin until November 15, 2018.
The GPM core observatory satellite had a good view of tropical cyclone Alcide on November 6, 2018 at 11:09 a.m. EST (1609 UTC). At that time Alcide had maximum sustained winds of about 35 knots (40.3 mph). GPM’s Microwave Imager (GMI) and GPM’s Dual-Frequency Precipitation Radar (DPR) instruments collected data that showed the location and intensity of precipitation within Alcide. GPM’s GMI indicated that strong convective storms northwest of Alcide’s center of circulation were dropping rain at a rate of more than 44 mm (1.73 inches) per hour. GPM’s radar (DPR Ku Band) probed Alcide in a swath through the eastern side of the tropical cyclone. Those data revealed the locations of precipitation within feeder bands spiraling into the southeastern side of the intensifying tropical cyclone.
On Nov. 6, the GPM core satellite showed strong convective storms northwest of Alcide’s center of circulation were dropping rain at a rate of more than 44 mm (1.73 inches) per hour. Credit: NASA/JAXA, Hal Pierce
At NASA’s Goddard Space Flight Center in Greenbelt, Maryland, a 3D animation was created from the data that showed a simulated flyby above Tropical Cyclone Alcide. Measurements of the relative heights of precipitation within tropical cyclone Alcide were made possible using GPM’s radar data (DPR Ku Band). DPR’s Ku Band radar enables three dimensional measurements of precipitation within a 152 mile (245 km) wide swath. The heights of precipitation over a larger area were estimated by blending measurements from GPM’s radar (DPR Ku band) with heights based on the Meteosat satellite’s infrared temperatures. GPM is a joint mission between NASA and the Japan Aerospace Exploration Agency, JAXA.
On Nov. 8 at 10 a.m. EST (1500 UTC), Alcide had achieved peak wind speed when maximum sustained winds were near 95 knots (110 mph/178 kph). A weakening trend is now expected, according to the JTWC. Alcide was centered near 12.1 degrees south latitude and 53.6 degrees east longitude, about 528 nautical miles north-northwest of Port Louis, Mauritius. Alcide was moving to the southwest.
Satellite data on Nov. 8 showed that the eye had become ragged and cloud-filled.
The JTWC forecast calls for Alcide to loop. Alcide is expected to remain well northeast of Madagascar. Alcide is then expected to move into an area of increasing vertical wind shear and lower sea surface temperatures causing the tropical cyclone to gradually weaken.
Nov. 07, 2018 – NASA Sees Tropical Cyclone Alcide Reach Hurricane Strength
NASA’s Terra satellite provided a visible image of a more organized Tropical Cyclone Alcide in the Southern Indian Ocean after it reached hurricane-force.
On Nov. 7, the MODIS instrument aboard NASA’s Terra satellite provided a visible image of Tropical Cyclone Alcide in the Southern Indian Ocean after it strengthened to hurricane-force. Credit: NASA Worldview, Earth Observing System Data and Information System (EOSDIS)
On Nov. 7, a visible image of Alcide taken by the Moderate Resolution Imaging Spectroradiometer or MODIS instrument aboard NASA’s Terra satellite showed an organized storm with a thick band of powerful thunderstorms circling the center. The eye appears ragged on the MODIS imagery and is about 10 nautical miles wide. Satellite data taken after the MODIS image showed that the system continued to strengthen.
The Joint Typhoon Warning Center said that at 10 a.m. EST (1500 UTC) on Nov. 7, Alcide had maximum sustained winds near 75 knots (86 mph/139 kph). It was centered near 10.6 degrees south latitude and 55.7 degrees east longitude. Tropical cyclone Alcide is located approximately 587 nautical miles north of Port Louis, Mauritius, and was moving to the west-southwest.
Alcide is expected to strengthen over the next day or two before starting a weakening trend over cooler ocean waters.
Nov. 06, 2018 – Satellite Finds Tropical Cyclone 03S Develop in Southern Indian Ocean
Tropical Cyclone 03S formed in the Southern Indian Ocean and the NOAA-20 satellite passed overhead and captured a visible image of the storm.
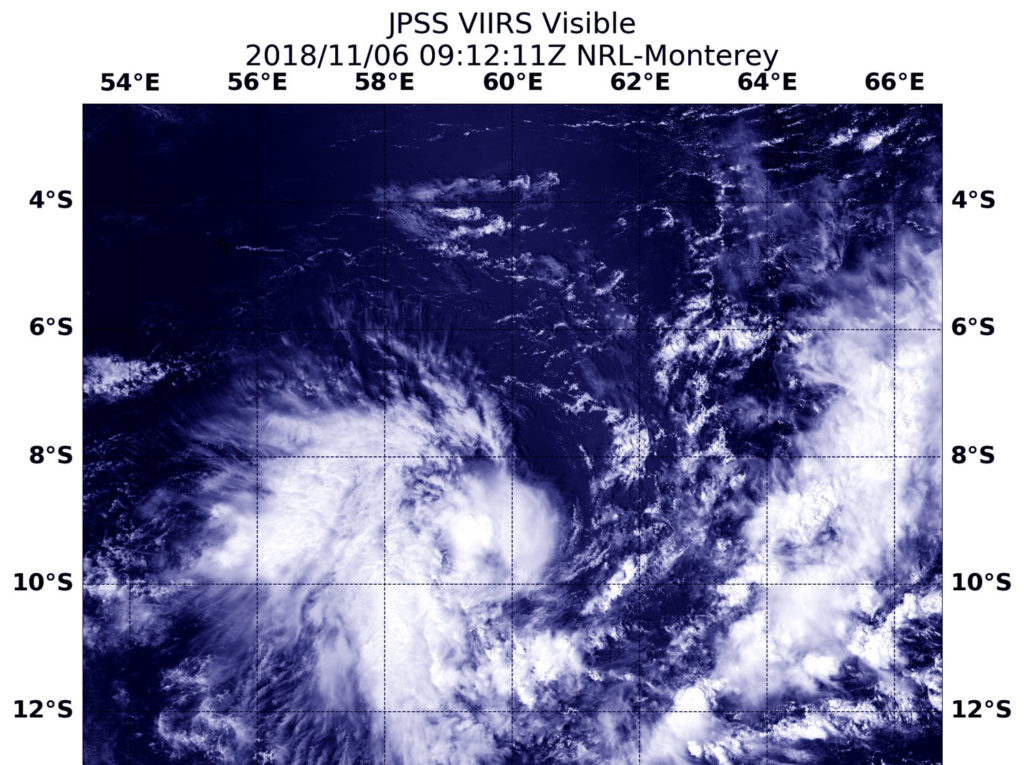
At 5:12 a.m. EDT (0912 UTC) on Nov.6, the VIIRS instrument aboard NOAA’s NOAA-20 satellite captured a visible image of Tropical Cyclone 03S in the Southern Indian Ocean Credit: NASA/NRL
At 5:12 a.m. EDT (0912 UTC) on Nov.6, the Visible Infrared Imaging Radiometer Suite (VIIRS) instrument aboard the NOAA-20 polar orbiting satellite saw fragmented bands of thunderstorms around Tropical Storm 03S’s center of circulation. The VIIRS image revealed that the bulk of clouds and storms were south of the center. The Joint Typhoon Warning Center noted “The bulk of the deep convection remains concentrated southwestward of the low level circulation.”
On Nov. 6 at 11 a.m. EDT (1500 UTC) 03S’s maximum sustained winds were near 35 knots (40 mph/62 mph) making it a tropical storm. It was located approximately 641 nautical miles north of Port Louis, Mauritius near 9.7 south latitude and 58.9 east longitude. 03S was moving west-southwestward and is expected to strengthen over the next several days.
NOAA-20 is the first in the JPSS series of satellites. JPSS is a collaborative program between the National Oceanic and Atmospheric Administration (NOAA) and its acquisition agent, the National Aeronautics and Space Administration (NASA). NOAA is responsible for managing and operating the JPSS program, and developing portions of the ground segment, while NASA is responsible for developing and building the JPSS instruments, spacecraft, and portions of the ground segment and providing launch services.
Nov. 06, 2018 – Weakening Tropical Storm Xavier Observed By NASA
As Tropical Storm Xavier continued to rain on western Mexico, the Global Precipitation Measurement mission or GPM core satellite analyzed the rate in which rain was falling. The next day, Nov, 6, Xavier had weakened to a remnant low pressure area.
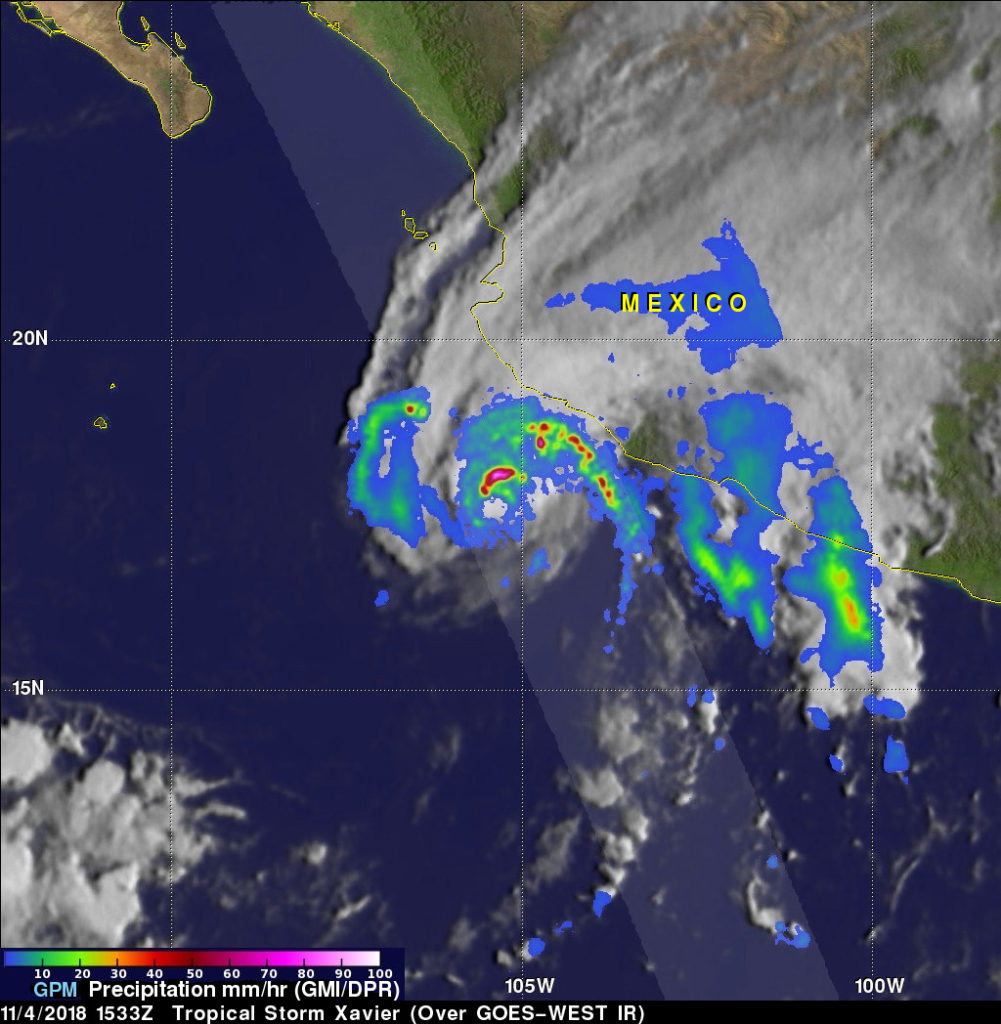
On November 4, 2018 at 11:33 a.m. EDT (1533 UTC) the GPM satellite found rain was falling at over 9.5 inches (241.3 mm) per hour in some of the powerful convective storms that were located to the northeast of Xavier’s low level center of circulation. Credit: NASA/JAXA, Hal Pierce
The GPM core observatory satellite passed directly above tropical storm Xavier’s low level center of circulation on November 4, 2018 at 11:33 a.m. EDT (1533 UTC). At that time Xavier was located in the eastern Pacific Ocean less than 150 nautical miles (277.8 km) south of Puerto Vallarta, Mexico. Xavier was experiencing strong southwesterly vertical wind shear.
The low level center of circulation was located well offshore while the tropical storm’s deep convection had been pushed toward Mexico’s coast. GPM’s Dual-Frequency Precipitation Radar (DPR) revealed that rain was falling at over 9.5 inches (241.3 mm) per hour in some of the powerful convective storms that were located to the northeast of Xavier’s low level center of circulation.
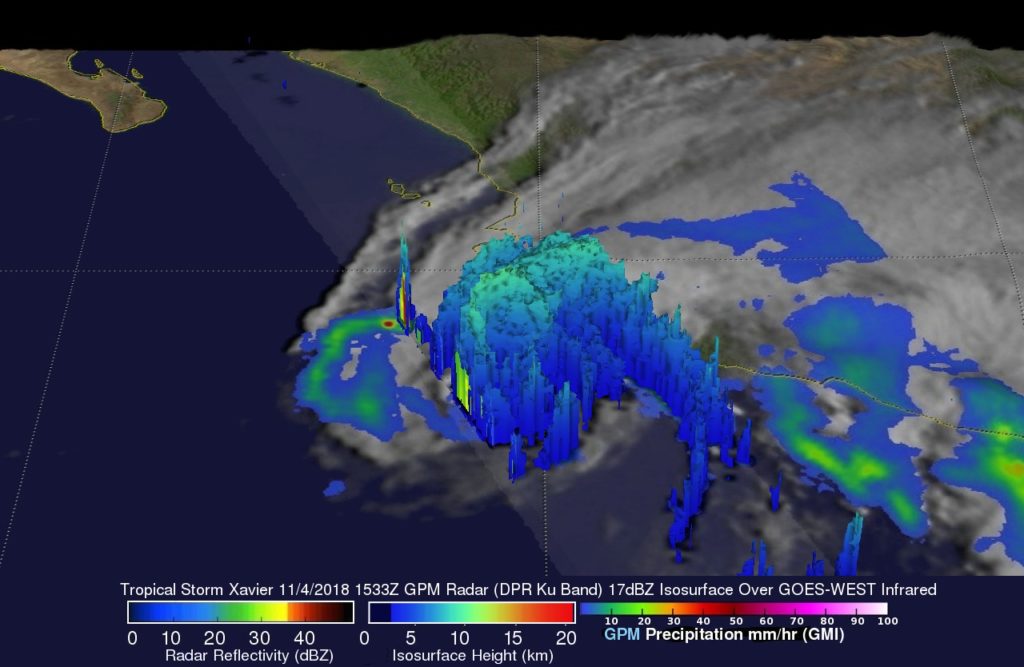
On November 4, 2018 at 11:33 a.m. EDT (1533 UTC) the GPM satellite found rain was falling at over 9.5 inches (241.3 mm) per hour in some of the powerful convective storms that were located to the northeast of Xavier’s low level center of circulation. Strong convective storms north and northeast of Xavier’s low level center of circulation are shown reaching altitudes of about 6.9 miles (11.1 km). Credit: NASA/JAXA, Hal Pierce
At NASA’s Goddard Space Flight Center in Greenbelt, Maryland a 3D image of Xavier’s precipitation structure was created from data collected by the GPM core observatory satellite’s radar (DPR Ku Band). In the 3D image, a view from the south shows that less precipitation was occurring in the southern side of the tropical storm. At the same time the strong convective storms north and northeast of Xavier’s low level center of circulation are shown reaching altitudes of about 6.9 miles (11.1 km). GPM is a joint mission between NASA and the Japan Aerospace Exploration Agency, JAXA.
On November 4, 2018 at 11:33 a.m. EDT (1533 UTC) the GPM or Global Precipitation Measurement Mission core satellite found rain was falling at over 9.5 inches (241.3 mm) per hour in some of the powerful convective storms that were located to the northeast of Xavier’s low level center of circulation. Strong convective storms north and northeast of Xavier’s low level center of circulation are shown reaching altitudes of about 6.9 miles (11.1 km). This animation shows multiple simulated 3D slices through and a simulated flight above tropical storm Xavier using GPM’s radar (DPR Ku Band) reflectivity data. Credit: NASA/JAXA, Hal Pierce
On Nov. 6, Tropical Storm Xavier moved away from Mexico’s coast and weakened into a remnant low pressure area. The National Hurricane Center noted “The remnant low of Tropical Storm Xavier near 19 degrees north latitude and 1089 degrees west longitude at 4 a.m. EDT (1 a.m. PDT) continues to produce minimal gale force winds. Winds will diminish below gale force this morning as the remnant low continues to spin down.”
Nov. 05, 2018 – NASA Sees Tropical Storm Xavier Affecting Western Mexico
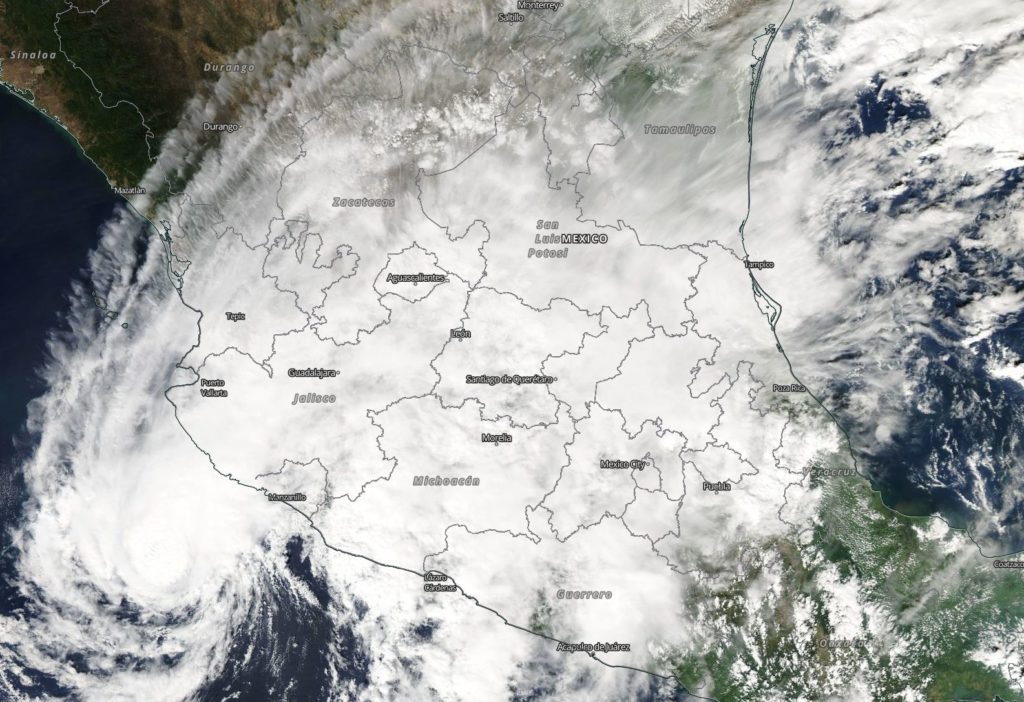
Visible from NASA’s Aqua satellite revealed the extent of Tropical Storm Xavier into western Mexico from its position just off-shore from Mexico’s Jalisco state.
On Nov. 4, the MODIS instrument aboard NASA’s Aqua satellite looked at Tropical Storm Xavier just off-shore from western Mexico over the Eastern Pacific Ocean. Thunderstorms were streaming over the Mexican states of Jalisco and Michocan Credit: NASA Worldview, Earth Observing System Data and Information System (EOSDIS)
Tropical Depression Twenty-Five-E (25E) formed on Nov. 3 and strengthened in a tropical storm on by 11 p.m. EDT that day. When it became a tropical storm it was re-named Xavier. Xavier has continued to hug the coast of western Mexico since it formed.
On Nov. 4 a visible image from the Moderate Resolution Imaging Spectroradiometer or MODIS instrument aboard NASA’s Aqua satellite showed an organized storm with a thick band of powerful thunderstorms circling the center.
On Nov. 5, a Tropical Storm Warning is in effect for Punta San Telmo to Playa Perula, Mexico. A Tropical Storm Warning means that tropical storm conditions are expected somewhere within the warning area.
The National Hurricane Center noted at 11 a.m. EDT the center of Tropical Storm Xavier was located near latitude 18.5 degrees north and longitude 106.2 degrees west. Xavier is moving slowly toward the west-northwest near 3 mph (6 kph), but an increase in forward speed is expected later today. Maximum sustained winds are near 60 mph (95 kph) with higher gusts. Weakening is forecast during the next few days, and Xavier is expected to degenerate into a remnant low by Tuesday night. Tropical-storm-force winds extend outward up to 115 miles (185 km) from the center. The estimated minimum central pressure is 999 millibars from the center. The estimated minimum central pressure is 1006 millibars.
NHC said that Xavier is expected to produce total rain accumulations of 1 to 3 inches over coastal sections of the Mexican states of Colima and Jalisco, with isolated maximum amounts of 4 inches possible. This rainfall may produce flooding. Swells generated by Xavier will affect portions of the coast of southwestern Mexico during the next few days.
On the forecast track, Xavier’s center is expected to remain offshore the coast of southwestern Mexico and continue to move farther away from the coast today.