December 11, 2018 – NASA Measures Rainfall from Tropical Cyclone Owen’s Remnants at Queensland Coast
The low pressure area formerly known as Tropical Cyclone Owen continued to organize and cross the southern Gulf of Carpentaria, Australia on Dec. 11. The Global Precipitation Measurement mission or GPM core satellite provided a look at the rainfall rates within the system.

On Dec. 11, Australian warnings were posted as Owen continued to consolidate in the Gulf of Carpentaria. A tropical cyclone watch is in force from Cape Shield Northern Territory to Burketown Queensland, including Mornington Island and Groote Eylandt.
But it was one week before that Tropical cyclone Owen weakened and was downgraded to a tropical low on December 4, 2018. The tropical low pressure area, also called 05P revived and became a little better organized before it hit the Queensland coast on Dec. 9. Winds in the cyclone had increased to about 35 knots (40 mph) as it moved ashore. The disturbance is expected to intensify again as it moves westward over the warm waters of the Gulf of Carpentaria. Lower vertical wind shear is also predicted to contribute to a more favorable environment for the low’s intensification into a significant tropical cyclone.
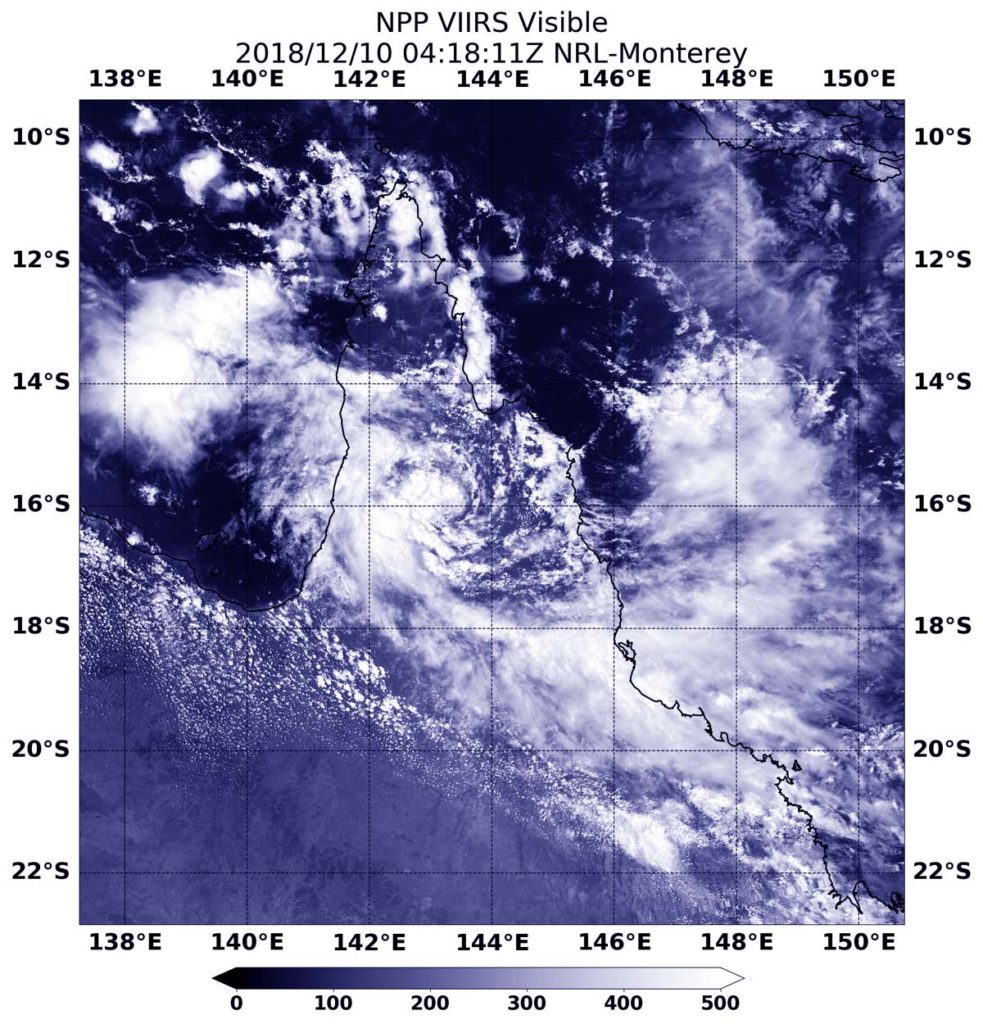
On December 9, 2018 at 11:31 p.m. AEST (8:31 a.m. EST/1331 UTC). GPM showed rain was falling at a rate of over 32.4 mm (1.3 inches) per hour over northeastern Queensland’s coastline and greater than 52 mm (2 inches) in feeder bands in the Coral Sea off Australia’s coast. This 3-D image showed feeder bands of thunderstorms on the eastern side of tropical cyclone Owen’s remnants contained a few storms that reached heights of 13 km (8.1 miles).Credit: NASA/JAXA, Hal Pierce
The GPM core observatory satellite passed above Tropical Cyclone Owen’s remnants as they approached Australia’s coast on December 9, 2018 at 11:31 p.m. AEST (8:31 a.m. EST/1331 UTC). GPM’s Microwave Imager (GMI) and GPM’s Dual-Frequency Precipitation Radar (DPR) instruments collected data that showed the intensity of rainfall in the low’s convective storms. GMI indicated that rain was falling at a rate of over 32.4 mm (1.3 inches) per hour over northeastern Queensland’s coastline. GPM’s DPR revealed that rain was falling at a rate of greater than 52 mm (2 inches) in feeder bands in the Coral Sea off Australia’s coast.
A 3-D view was created at NASA’s Goddard Space Flight Center in Greenbelt, Maryland that was derived from GPM’s radar data (DPR Ku Band). It showed the 3-D structure of precipitation within the remnants of tropical cyclone Owen. A simulated flyby of Owen’s remnants, also created at NASA, showed that feeder bands on the eastern side of tropical cyclone Owen’s remnants contained a few storms that reached heights of 13 km (8.1 miles). GPM is a joint mission between NASA and the Japan Aerospace Exploration Agency, JAXA.
On Dec. 11, Owen was located in the southern part of the Gulf of Carpentaria and tracking to the west-northwest. The Australian Bureau of Meteorology or ABM noted that Owen was a Category 1 storm with maximum sustained winds near the center of 75 kilometers (46 miles) per hour. That means that Owen has regained its status as a tropical cyclone. Owen was located near 14.9 degrees south latitude and 138.8 degrees east longitude, about 200 kilometers (124 miles) north-northwest of Mornington Island and 300 kilometers (186 miles) east northeast of Borroloola. Owen was moving to the west-northwest.
Owen is expected to continue moving slowly to the west for a day, then change course to move eastward and back towards the Queensland coast on Thursday Dec. 13. ABM noted that Owen may reach category 3 intensity by Thursday if conditions remain favorable. A coastal crossing along the southeast Gulf of Carpentaria coast during Friday, Dec. 14 is most likely.
For updated forecasts, visit ABM: http://www.bom.gov.au
By Harold F. Pierce / Rob Gutro
NASA Goddard Space Flight Center